Entry: around 3,745 – 3,750 (sell limit or after bearish confirm1. Market Structure
Price previously made a higher high, but then reversed downward.
Currently, the resistance zone (supply) around 3,750 – 3,760 has been tested multiple times but failed to break → showing strong selling pressure there.
The support zone (demand) around 3,715 – 3,725 is the next potential target.
2. Price Pattern
The chart suggests an M/W formation or a double top variation, with repeated rejection at the blue resistance zone.
The blue arrows you drew indicate the expectation that price will:
Continue dropping from the 3,750 resistance zone.
Retest the 3,720 support zone.
If 3,720 breaks, the next target is 3,700.
3. Technical Signals
Strong volume appeared during the previous drop from 3,780 → confirming sellers are in control.
Each retracement to retest supply is weaker, with lower highs → a sign of distribution.
If another strong bearish candle (e.g., bearish engulfing) forms, the probability of reaching 3,700 is high.
4. Trade Scenarios
Bearish scenario (main bias):
Entry: around 3,745 – 3,750 (sell limit or after bearish confirmation).
TP1: 3,720.
TP2: 3,700.
SL: above 3,760 resistance zone.
Alternative bullish scenario (less likely):
If price breaks above 3,760 and closes strongly on H1/H4, upside targets are 3,780 – 3,800.
👉 In summary: This chart leans strongly toward a bearish outlook, targeting 3,720 first, and potentially 3,700.
Trading

Gold price analysis September 26#XAUUSD Technical Analysis
In the New York session, selling pressure is dominating as gold is continuously restrained by the falling trendline. This suggests that the market may enter a short-term correction. The nearest target of the decline is determined around the 3705 area today.
However, the 3750 area is still an important key level. If the price has a confirmation candle closing above this area, the uptrend will likely return, opening up opportunities for the uptrend to continue.
📉 Reference strategy
SELL: When the price reacts and rejects at the 3750 area
Target: 3705

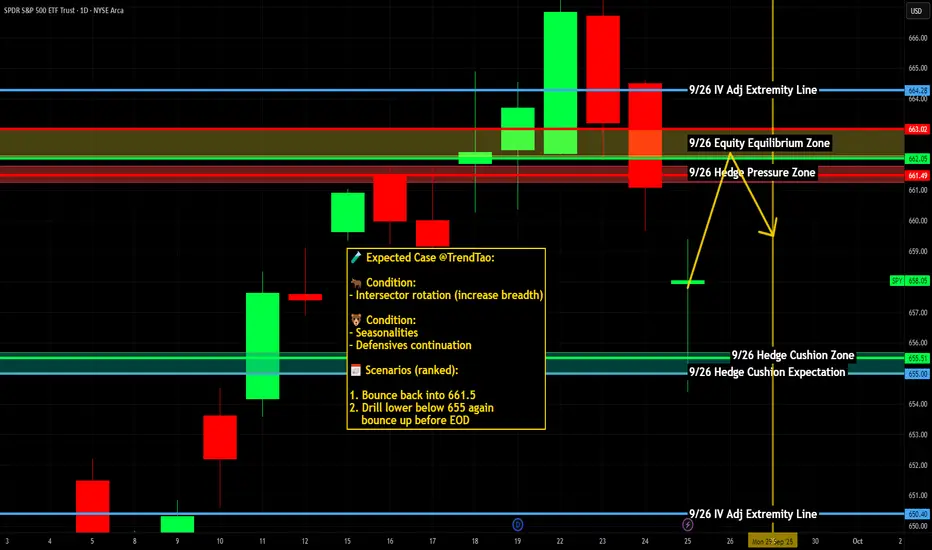
SPY SEP 25,2025 READ NOTESSpy can still hit $676 but as a trader my job is to understand the risk then put Stop loss & then trade.
So, I am long with stocks only:
SL @$653 with a target of $676.
The level is pretty average & most of the traders who learnt price action from me won't even call this a level. If you don't understand a level, then don't trade it(simple).
I initiated the long trade when I posted the chart in the morning.
If it hits my SL then il accept and move on. I am waiting for this week to close &will publish the video analysis tomorrow after market close.
NOTE: DO NOT TRADE OPTIONS

$SPY / $SPX Scenarios — Friday, Sept 26, 2025🔮 AMEX:SPY / SP:SPX Scenarios — Friday, Sept 26, 2025 🔮
🌍 Market-Moving Headlines
📉 Month-end flows: Positioning shuffle as traders square books into Q3-end.
💵 Fed lens: Multiple Fed appearances keep policy tone in focus post-SEP.
💻 Tech + growth watch: AMEX:XLK flows remain sensitive to yields + inflation gauges.
🛢️ Commodities check: Oil and dollar volatility continue to set cross-asset tone.
📊 Key Data & Events (ET)
⏰ 🚩 8:30 AM — Personal Income & Spending (Aug)
⏰ 🚩 8:30 AM — PCE Price Index (Aug) + Core PCE (YoY & MoM)
⏰ 10:00 AM — Consumer Sentiment (Final, Sep)
🗣️ Fed Speakers:
• 7:30 AM — Tom Barkin (Richmond Fed, TV appearance)
• 9:00 AM — Tom Barkin (speech)
• 1:00 PM — Michelle Bowman (Fed Vice Chair for Supervision)
⚠️ Disclaimer: Educational/informational only — not financial advice.
📌 #trading #stockmarket #SPY #SPX #PCE #inflation #Fed #Powell #joblessclaims #consumer #Dollar #bonds #megacaps
GOLD BULLISH BIAS|LONG|
✅XAUUSD Price forms a bullish flag above the wide demand area, showing ICT displacement. Smart Money likely drives momentum toward liquidity resting at 3,780$. Time Frame 3H.
LONG🚀
✅Like and subscribe to never miss a new idea!✅

CAD-JPY Free Signal! Sell!
Hello,Traders!
CADJPY rejects a horizontal supply area after a fakeout sweep, signaling SMC distribution. Bears aim to drive price lower into liquidity resting near 107.27. Time Frame 2H.
-------------------
Stop Loss: 107.616
Take Profit: 107.271
Entry: 107.435
Time Frame: 2H
-------------------
Sell!
Comment and subscribe to help us grow!
Check out other forecasts below too!
Disclosure: I am part of Trade Nation's Influencer program and receive a monthly fee for using their TradingView charts in my analysis.

CHF_JPY WILL KEEP GROWING|LONG|
✅CHFJPY Price reacts from demand area, confirming ICT displacement. Liquidity grab hints at bullish continuation, with Smart Money aiming for imbalance near 187.50. Time Frame 2H.
LONG🚀
✅Like and subscribe to never miss a new idea!✅

BB BlackBerry Limited Options Ahead of EarningsIf you haven`t bought BB before the prevous earnings:
Now analyzing the options chain and the chart patterns of BB BlackBerry Limited prior to the earnings report this week,
I would consider purchasing the 3.50usd strike price Calls with
an expiration date of 2025-10-24,
for a premium of approximately $0.53.
If these options prove to be profitable prior to the earnings release, I would sell at least half of them.

NZD-JPY Will Go Down! Sell!
Hello,Traders!
NZDJPY taps a supply zone and we see a bearish rejection, with Smart Money pushing price lower toward imbalance cleanup near 86.180. Time Frame 3H.
Sell!
Comment and subscribe to help us grow!
Check out other forecasts below too!
Disclosure: I am part of Trade Nation's Influencer program and receive a monthly fee for using their TradingView charts in my analysis.

GBP_CAD FREE SIGNAL|LONG|
✅GBPCAD sweeps liquidity into the support block, showing a bullish rejection. Smart Money likely shifts flow upward, aiming for inefficiency fill near 1.8611. Time Frame 2H.
—————————
Entry: 1.8575
Stop Loss: 1.8548
Take Profit: 1.8611
Time Frame: 2H
—————————
LONG🚀
✅Like and subscribe to never miss a new idea!✅

HBAR Long Spot Setup – Retesting Major SupportHBAR is pulling back into a key support zone between $0.19–$0.21, a historically significant area where buyers have previously stepped in with strength. With the broader market showing signs of stabilization, this zone may offer a solid opportunity for laddered spot accumulation.
Price action shows confluence with previous demand levels, and volume is beginning to stabilize, which could signal waning selling pressure. If this level holds, a bounce toward higher resistance zones becomes likely in the coming sessions or weeks.
🔁 Trade Setup:
• Entry Zone: $0.19–$0.21 (laddered entries)
• Target 1: $0.28–$0.31
• Target 2: $0.36–$0.40
• Stop Loss: Below $0.18

EUR-GBP Short From Supply Level! Sell!
Hello,Traders!
EURGBP taps into supply, rejecting premium levels as Smart Money shifts flow. The reaction signals distribution, with price likely targeting 0.8732 to rebalance inefficiency and clear buy-side stops.Time Frame 5H.
Sell!
Comment and subscribe to help us grow!
Check out other forecasts below too!
Disclosure: I am part of Trade Nation's Influencer program and receive a monthly fee for using their TradingView charts in my analysis.

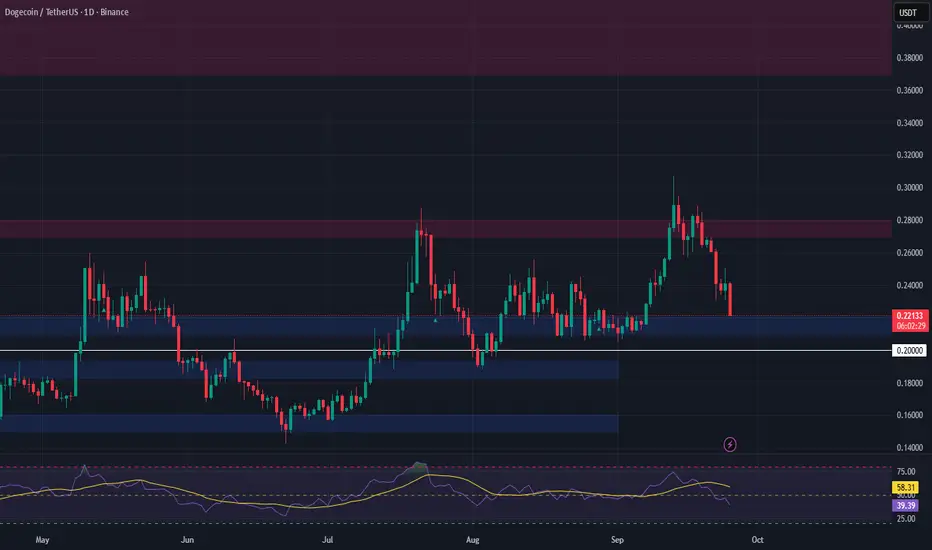
DOGE — Watching for a Relief Bounce from SupportDogecoin has pulled back into a key support zone at $0.21–$0.22, a level that has historically acted as both resistance and support. With the broader market showing signs of consolidation, this area could offer a short-term bounce opportunity.
That said, this is likely a relief rally within a broader downtrend, so managing risk is critical. A failure to hold this support could lead to a deeper correction later this month.
🔹 Trade Plan:
• Entry Zone: $0.21–$0.22
• Targets: $0.27–$0.28, $0.37–$0.44
• Stop Loss: Below $0.20
This is a spot-only setup with an asymmetric risk-reward profile if the bounce materializes. Avoid overleveraging and stick to your plan.
CHFJPY: Trend ContinuationI see another trend continuation opportunity over on the CHFJPY pair. One thing to note is that rollover is in a few hours so consider exiting and re-entering this position to avoid getting stopped out.
Daily Timeframe:
Price crossed above HTL and the fakeout was invalidated quickly as price crossed back above HTL
H1 Timeframe:
I see quite a bit of confluence here with the following signals observed in the subsequent bullets
Price is moving out of EMA band again
Price crossed above DTL so that signals a likely end to the intraday counter-trend move
EMA20 remains above EMA60 to show overall uptrend confluence with the daily timeframe

AUDCAD What Next? BUY!
My dear friends,
My technical analysis for AUDCAD is below:
The market is trading on 0.9118 pivot level.
Bias - Bullish
Technical Indicators: Both Super Trend & Pivot HL indicate a highly probable Bullish continuation.
Target - 0.9138
Recommended Stop Loss - 0.9107
About Used Indicators:
A pivot point is a technical analysis indicator, or calculations, used to determine the overall trend of the market over different time frames.
Disclosure: I am part of Trade Nation's Influencer program and receive a monthly fee for using their TradingView charts in my analysis.
———————————
WISH YOU ALL LUCK

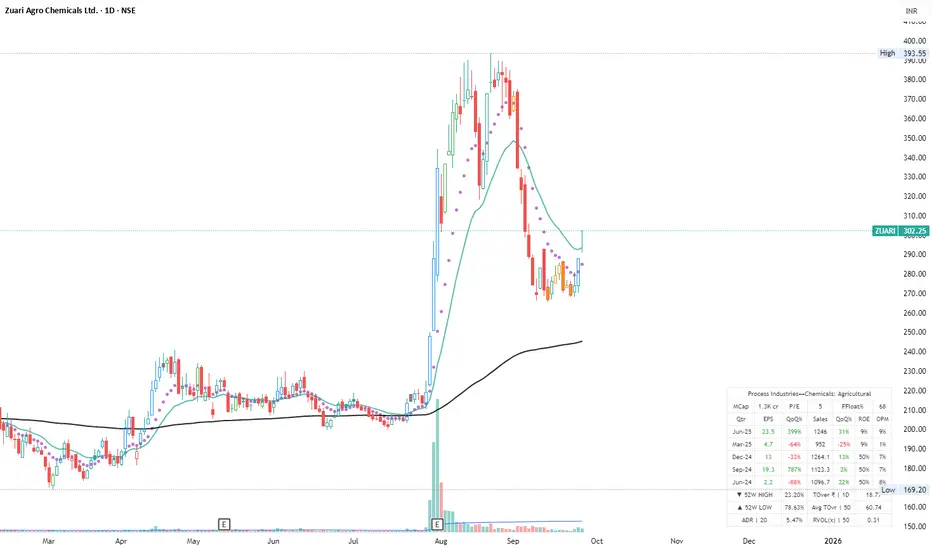
Zuari - Flag and Pole SetupZuari Stock after giving decent run and then a healthy retracement looks like it is again getting ready for the next run. Keep an eye on Zuari.
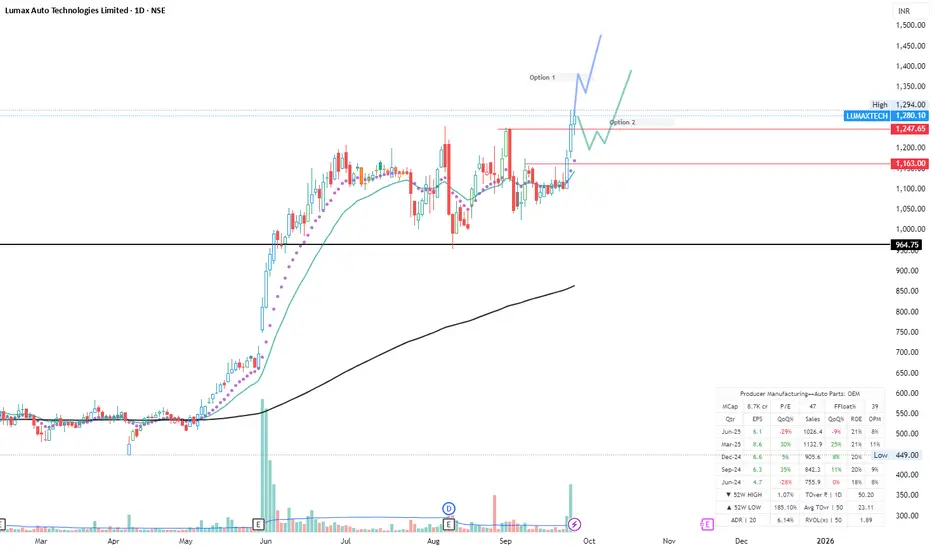
Lumaxtech - Go LongAuto being a strong sector, lot of proxy auto stocks are giving decent breakout. One of them is Lumaxtech.
Since last 2 days it has given decent movement there are 2 options being all time high there is a good strength it can still go high or option 2 it can come down slightly, consolidate and then start the journey.
Bullish Setup, Swing Trade Opportunity in XAGUSDJust wait for a Price to Enter in our Discount Zone and then we are Ready to go Long with Proper Risk Management

DAX: Move Up Expected! Long!
My dear friends,
Today we will analyse DAX together☺️
The recent price action suggests a shift in mid-term momentum. A break above the current local range around 23,517.46 will confirm the new direction upwards with the target being the next key level of 23,580.90 and a reconvened placement of a stop-loss beyond the range.
❤️Sending you lots of Love and Hugs❤️

GOLD: Local Bullish Bias! Long!
My dear friends,
Today we will analyse GOLD together☺️
The in-trend continuation seems likely as the current long-term trend appears to be strong, and price is holding above a key level of 3,731.85 So a bullish continuation seems plausible, targeting the next high. We should enter on confirmation, and place a stop-loss beyond the recent swing level.
❤️Sending you lots of Love and Hugs❤️

SILVER: Absolute Price Collapse Ahead! Short!
My dear friends,
Today we will analyse SILVER together☺️
The market is at an inflection zone and price has now reached an area around 44.284 where previous reversals or breakouts have occurred.And a price reaction that we are seeing on multiple timeframes here could signal the next move down so we can enter on confirmation, and target the next key level of 44.004.Stop-loss is recommended beyond the inflection zone.
❤️Sending you lots of Love and Hugs❤️

TSLA LONG SWING READ NOTES 25 SEP 2025I have bought some Tesla stocks now around $424 for swings. I know market is all time high & Tsla can do $450 here. I am just taking market over all support which is again very poor.
This is an average trade
If you are not confident dont trade.
I have gone long with stocks only

EURUSD: Will Go Down! Short!
My dear friends,
Today we will analyse EURUSD together☺️
The price is near a wide key level
and the pair is approaching a significant decision level of 1.17013 Therefore, a strong bearish reaction here could determine the next move down.We will watch for a confirmation candle, and then target the next key level of 1.16688.Recommend Stop-loss is beyond the current level.
❤️Sending you lots of Love and Hugs❤️
