APPLE Buyers In Panic! SELL!
My dear subscribers,
APPLE looks like it will make a good move, and here are the details:
The market is trading on 245.18 pivot level.
Bias - Bearish
My Stop Loss - 247.18
Technical Indicators: Both Super Trend & Pivot HL indicate a highly probable Bearish continuation.
Target - 241.25
About Used Indicators:
The average true range (ATR) plays an important role in 'Supertrend' as the indicator uses ATR to calculate its value. The ATR indicator signals the degree of price volatility.
Disclosure: I am part of Trade Nation's Influencer program and receive a monthly fee for using their TradingView charts in my analysis.
———————————
WISH YOU ALL LUCK
Trading

CGPT - READY TO FLY$CGPT - bullish breakout ✅🚀
✅120 days downtrend breakout + retest
✅H4 breakout candle
💣A weeekly candle close above 1.050$ would be a catalyst for the bulls!
Price might start a new bull cycle from here 📈
30%+ pump potential !
Importants levels are in my view! #DYOR

You See the Signals, So Why Are You Still Losing Money?The Crypto Conundrum: You See the Signals, So Why Are You Still Losing Money?
Every morning, thousands of traders boot up their rigs. Their screens light up with flashing RSI, MACD, and moving averages. Crypto Twitter is buzzing with analysts calling the next big move. All the information you could ever want is right at your fingertips. So why, by the end of the week, is your account balance smaller than when you started?
Let’s get one thing straight: the problem isn’t the indicators or the analysts. The problem is the "wetware"—the trader sitting in the chair.
You’re not losing because the signals are wrong. You’re losing because of how you react to them. Let's break down the real reasons your account is bleeding.
Reason #1: Psychology Trumps Logic. Every Single Time.
This is the #1 account killer. The market is an arena ruled by the twin demons of Fear and Greed. Your brilliant technical analysis is just a spectator.
FOMO (Fear Of Missing Out) – The Rocket Ship Trap
The Scene: Some altcoin, let's call it $WAGMI, has pumped 30% in an hour. Every indicator is screaming "overbought." Analysts are saying the news is already priced in. But all you see is a giant green candle. Your brain screams, "What if this thing 100x's? I gotta get in on this rocket ship!"
The Action: You ape in at the top.
The Result: The early buyers start taking profits, and the price nosedives. You're left holding the bag, wondering what went wrong and blaming "market manipulation."
The Mistake: You let an emotional impulse override every logical signal in front of you.
FUD (Fear, Uncertainty, and Doubt) – The Paper Hands Plague
The Scene: You entered a trade following your rules perfectly. The price bounced off a key support level, and the RSI showed a bullish divergence. But an hour later, the market dips slightly, and you're down 2%. A vague headline about crypto regulation in some far-off country flashes across your feed.
The Action: Panic. You slam the "close position" button to "cut your losses before it gets worse."
The Result: A few hours later, the price reverses and rips upward, hitting the exact target you originally set for a 15% gain.
The Mistake: You abandoned your own system because you got spooked by market "noise."
Reason #2: You Have No System. You Have a Gambling Habit.
An indicator signal isn't a magic bullet; it's just one piece of the puzzle.
"Indicator Soup"
The Scene: Your chart is a mess. You’ve got RSI, MACD, Stochastic, Bollinger Bands, and the Ichimoku Cloud all layered on top of each other. One says buy, another says sell, and a third is neutral.
The Action: You either freeze up from "paralysis by analysis" or, even worse, you cherry-pick the one signal that confirms what you wanted to do anyway.
The Result: A series of chaotic, random trades. Any profits are pure luck; the losses are inevitable.
The Mistake: Believing that more indicators equal more certainty. In reality, it just creates noise and confusion.
Ignoring the Stop-Loss: The Ultimate Sin
The Scene: You enter a long position based on a solid signal. But the price immediately starts moving against you. You told yourself you'd exit at a 5% loss, but as the price hits your stop level, you think, "It's gotta turn around any second now. I don't want to lock in a loss."
The Action: You delete your stop-loss, turning what was supposed to be a quick trade into a long-term "investment" you never wanted.
The Result: That 5% loss snowballs into a 20%, then 50% loss, tying up your capital and killing your account.
The Mistake: You violated the golden rule of trading: protect your capital. Hope is not a strategy.
Reason #3: You're Missing the Forest for the Trees
Indicators are useless without understanding the broader market context.
The Scene: The RSI on the 4-hour chart is deep in "oversold" territory—a classic buy signal.
The Action: You go long.
The Result: The price keeps tanking. Why? Because you failed to zoom out. On the daily chart, the asset is in a brutal, multi-month downtrend. A bullish signal in a bear market is often just a bull trap, a brief pause before the next leg down.
The Mistake: You analyzed a single timeframe in a vacuum, ignoring the primary trend.
So, What's the Fix? It's All About Strategy.
A real trading strategy isn't just "buy when the green line crosses the red one." It's a non-negotiable set of rules that dictates your every move. It must include:
Entry Trigger: Exactly what conditions must be met to open a position.
Example: The price must be above the 200-day EMA (confirming an uptrend), and MACD must have a bullish cross on the 4-hour chart.
Stop-Loss (Your Exit for a Loss): A pre-defined price point where you get out, no questions asked. This is your insurance policy against catastrophic loss.
Example: Place the stop-loss just below the most recent swing low.
Take-Profit (Your Exit for a Win): A pre-defined target where you lock in gains. Your potential profit should always be significantly larger than your potential loss (a good Risk/Reward Ratio is at least 2:1).
Example: If your stop-loss is 3% below your entry, your first take-profit target should be at least 6% above it.
A Simple, No-Nonsense Strategy Framework:
Concept: Trade with the trend, not against it.
Toolkit: The 200-day Exponential Moving Average (EMA) for the main trend, and basic support/resistance levels.
The Rules:
If the price is above the 200 EMA on the daily chart, you ONLY look for buys (longs).
Wait for the price to pull back to a key support level.
Enter a long position ONLY when you see a confirmation signal at that level (like a bullish engulfing candle).
Place your stop-loss below that support level. Place your take-profit at the next resistance level.
If the price is below the 200 EMA, you do the exact opposite and ONLY look for sells (shorts).
The Bottom Line
Indicators, charts, and expert analysis are just tools. In the hands of a disciplined craftsman, they can build wealth. In the hands of an emotional amateur, they’re just a way to smash your own thumb.
You lose money not because your tools are bad, but because you lack a plan, discipline, and risk management. Success in trading isn't about finding a holy grail indicator. It’s about the boring, repetitive work of following your rules, day in and day out.
The market doesn't pay you for being smart; it pays you for being disciplined. Period.

USDJPY Is Bullish! Buy!
Here is our detailed technical review for USDJPY.
Time Frame: 1D
Current Trend: Bullish
Sentiment: Oversold (based on 7-period RSI)
Forecast: Bullish
The market is on a crucial zone of demand 147.950.
The oversold market condition in a combination with key structure gives us a relatively strong bullish signal with goal 150.890 level.
P.S
The term oversold refers to a condition where an asset has traded lower in price and has the potential for a price bounce.
Overbought refers to market scenarios where the instrument is traded considerably higher than its fair value. Overvaluation is caused by market sentiments when there is positive news.
Like and subscribe and comment my ideas if you enjoy them!

AUDUSD Is Very Bullish! Long!
Take a look at our analysis for AUDUSD.
Time Frame: 6h
Current Trend: Bullish
Sentiment: Oversold (based on 7-period RSI)
Forecast: Bullish
The price is testing a key support 0.659.
Current market trend & oversold RSI makes me think that buyers will push the price. I will anticipate a bullish movement at least to 0.666 level.
P.S
We determine oversold/overbought condition with RSI indicator.
When it drops below 30 - the market is considered to be oversold.
When it bounces above 70 - the market is considered to be overbought.
Like and subscribe and comment my ideas if you enjoy them!

EURUSD: Support & Resistance Analysis For Next Week 🇪🇺🇺🇸
Here is my latest structure analysis:
important supports and resistances for EURUSD for next week.
Consider these structures for pullback/breakout trading.
❤️Please, support my work with like, thank you!❤️
I am part of Trade Nation's Influencer program and receive a monthly fee for using their TradingView charts in my analysis.

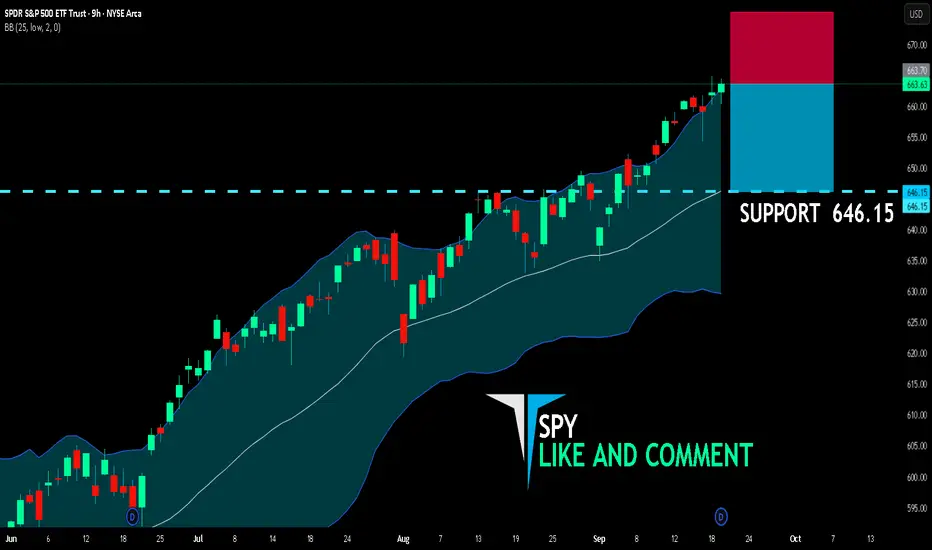
SPY SHORT FROM RESISTANCE
SPY SIGNAL
Trade Direction: short
Entry Level: 663.70
Target Level: 646.15
Stop Loss: 675.36
RISK PROFILE
Risk level: medium
Suggested risk: 1%
Timeframe: 9h
Disclosure: I am part of Trade Nation's Influencer program and receive a monthly fee for using their TradingView charts in my analysis.
✅LIKE AND COMMENT MY IDEAS✅
Bitcoin: Buying Opportunity at Support Before the Next RallyHello everyone, today I’d like to share a brief analysis of Bitcoin BINANCE:BTCUSD and some key developments in the market.
Currently, Bitcoin is experiencing a mild correction after a strong rally in recent weeks. During this phase, Fair Value Gaps (FVGs) are appearing, which could provide opportunities for the market to fill price inefficiencies and continue its prior trend.
From a technical perspective, Ichimoku Cloud shows that the price is hovering around the Cloud area, a crucial region in determining Bitcoin’s next move. If Bitcoin fails to hold above its current support, we could see another slight correction before continuation.
Macro Factors Impacting Bitcoin:
US Bitcoin Reserves: The US government’s recognition of Bitcoin as a national reserve asset has strengthened investor confidence.
Corporate Adoption: Companies such as MicroStrategy are ramping up Bitcoin purchases, injecting significant capital into the market.
Monetary Policy: The Federal Reserve’s rate cuts may enhance Bitcoin’s appeal as a safe-haven investment.
Bitcoin Outlook:
Although Bitcoin is currently in a slight pullback, I anticipate that after retesting the key support zone between 113,000 and 115,000 USD, Bitcoin will attract strong buying pressure and begin to recover. If it holds these levels, the market is likely to resume its bullish momentum toward the next resistance levels, with the first target at 116,000 USD.
Therefore, if you are monitoring Bitcoin, the 113,000 – 115,000 USD range is a strategic area to consider buying, with expectations of continued upside momentum in the near term.
Wishing you successful trades and always exercise caution in your decisions!

NZD/CAD BULLS WILL DOMINATE THE MARKET|LONG
Hello, Friends!
NZD/CAD pair is in the uptrend because previous week’s candle is green, while the price is obviously falling on the 4H timeframe. And after the retest of the support line below I believe we will see a move up towards the target above at 0.816 because the pair is oversold due to its proximity to the lower BB band and a bullish correction is likely.
Disclosure: I am part of Trade Nation's Influencer program and receive a monthly fee for using their TradingView charts in my analysis.
✅LIKE AND COMMENT MY IDEAS✅

XAUUSD – The Decisive Zone and Trading ScenariosTechnical Analysis
Gold prices on the H4 chart are in a recovery phase after testing the 3.661–3.662 support. The latest candle has rebounded strongly to the 3.684 area, yet the structure still shows clear indecisiveness.
The upward trendline was breached in the previous decline, and currently, the price is retesting this area. This is a crucial point to determine whether the short-term uptrend will continue.
A Fair Value Gap (FVG) has formed around the 3.613–3.626 area, aligning with the Fibonacci extension, making it a point of interest for deeper pullbacks.
The Volume Profile indicates the main Point of Control (POC) lies lower, around 3.551, which is a potential target for gold to revisit if selling pressure increases.
The RSI (14) is at ~59, leaning towards buyers but not yet overbought → the current momentum is more of a recovery than a sustainable uptrend.
Trading Scenarios
Scenario 1 – Buy following the short-term trend:
Entry: wait for a retest of 3.673–3.662
SL: below 3.655
TP1: 3.690–3.700
TP2: 3.708–3.715 (2.0–2.618 Fib extension)
Scenario 2 – Short sell after confirmed failure:
If the price fails to hold above 3.661 and there is a reversal signal on H4, consider selling.
Entry: 3.661–3.650 (after confirmation candle)
SL: above 3.673
TP1: 3.626–3.613 (FVG + support)
TP2: 3.579
TP3: 3.551 (POC Volume Profile)
Key Price Levels to Watch
3.708–3.715: extended resistance zone, Fib confluence, key target for buyers.
3.661–3.662: short-term support, boundary to determine the next trend.
3.613–3.626: FVG + intermediate support, a zone prone to reactions.
3.551: volume POC, deep target if the market breaks all support.
I will apply the long-term trading scenario in the new week, so give me a follow for motivation to write more!

ESG & Carbon Credit Trading: A Deep Dive1. Introduction: Why ESG & Carbon Markets Matter Today
In the 21st century, the financial system is no longer only about profits, balance sheets, and shareholder returns. The world is facing an existential challenge: climate change. Rising global temperatures, extreme weather events, biodiversity loss, and resource scarcity have shifted the priorities of governments, businesses, and investors alike. In this context, Environmental, Social, and Governance (ESG) principles and carbon credit trading systems have emerged as critical tools to align finance with sustainability.
Together, they represent the intersection of markets, ethics, and the planet’s survival. ESG provides a holistic framework for evaluating the sustainability of businesses, while carbon credits create a market-based mechanism to reduce greenhouse gas (GHG) emissions.
This essay explores both domains in depth, showing how they interconnect, why they are important, and where they are headed in the future.
2. Understanding ESG
2.1 What ESG Means
ESG stands for Environmental, Social, and Governance – a framework that evaluates companies not just by financial performance, but by how responsibly they operate in the broader ecosystem.
Environmental: How does a company manage its carbon footprint, energy efficiency, waste, water, and natural resource use?
Social: How does it treat employees, customers, suppliers, and communities? Does it promote diversity, inclusion, and human rights?
Governance: How transparent and accountable is its leadership? Does it avoid corruption, insider trading, and unethical practices?
2.2 Evolution of ESG Investing
Originally, sustainability efforts were often seen as “corporate social responsibility” (CSR) or philanthropy. However, investors realized that ESG risks – such as climate regulations, supply chain disruptions, or governance scandals – can directly affect profits and valuations.
By the 2000s, ESG investing became mainstream, with large institutional investors like BlackRock and Vanguard demanding ESG disclosures. Today, ESG funds manage trillions of dollars globally, and regulators like the EU require mandatory ESG reporting.
2.3 Why ESG Matters
It reduces risks from climate laws, carbon taxes, and lawsuits.
It enhances brand value and consumer trust.
It attracts ESG-focused investors.
It ensures long-term sustainability, not just short-term profit.
3. Carbon Credits & Carbon Markets
3.1 What Are Carbon Credits?
A carbon credit represents the right to emit one metric ton of carbon dioxide (CO₂) or equivalent greenhouse gases. Companies buy or earn credits to offset their emissions.
3.2 Compliance vs. Voluntary Markets
Compliance Markets: Governments cap emissions and issue allowances. Companies must buy credits if they exceed their limits. (Example: EU Emissions Trading System).
Voluntary Markets: Businesses or individuals buy credits voluntarily to offset their footprint (e.g., airlines offering “carbon-neutral flights”).
3.3 Cap-and-Trade vs. Carbon Offsets
Cap-and-Trade: A government sets a cap on total emissions. Companies exceeding their cap must buy credits from those with extra allowances.
Offsets: Companies can fund external projects (like reforestation, renewable energy) to earn credits.
3.4 Pricing Mechanisms
Carbon credit prices vary widely:
EU ETS: €60–100 per ton (highly regulated).
Voluntary markets: $2–20 per ton (depending on project quality).
4. How ESG & Carbon Credit Trading Interconnect
ESG is a broad sustainability framework, and carbon credits are one of the most measurable tools within it.
For Corporates: Buying carbon credits improves their ESG score by reducing net emissions.
For Investors: ESG funds often favor companies engaged in carbon markets.
For Regulators: ESG disclosures increasingly include carbon credit purchases and emission offsets.
In essence, carbon credits are the financial “currency” of the environmental pillar of ESG.
5. Global Landscape of Carbon Credit Trading
5.1 Europe – EU Emissions Trading System (ETS)
The EU ETS is the largest and most advanced carbon market in the world. Launched in 2005, it covers power plants, industries, and airlines. It operates under a cap-and-trade system and sets the benchmark for global carbon pricing.
5.2 United States
There is no federal carbon market, but regional initiatives exist:
California Cap-and-Trade Program
Regional Greenhouse Gas Initiative (RGGI) in northeastern states
5.3 China
China launched the world’s largest carbon market in 2021, covering its power sector. Given China’s size, this market has potential to redefine global carbon pricing.
5.4 India & Asia
India has introduced a Carbon Credit Trading Scheme (CCTS) in 2023, aiming to integrate renewable energy projects and industry compliance. Japan and South Korea also run emissions trading systems.
5.5 Voluntary Carbon Markets (VCMs)
VCMs are growing rapidly, driven by corporate net-zero pledges. Platforms like Verra and Gold Standard certify offset projects, from forest conservation to clean cookstoves in Africa.
6. Opportunities & Benefits
6.1 For Corporates
Achieve net-zero targets.
Enhance ESG ratings.
Gain competitive advantage by marketing carbon-neutral products.
6.2 For Investors
Access to ESG-themed ETFs, green bonds, and carbon funds.
Hedge against climate-related risks.
6.3 For Governments
Generate revenue from carbon taxes and auctions.
Meet Paris Agreement targets.
6.4 For Communities
Reforestation and renewable projects bring jobs, energy access, and biodiversity protection.
Carbon finance helps developing nations grow sustainably.
7. Challenges & Criticisms
7.1 Greenwashing Risks
Some companies buy cheap credits instead of reducing real emissions, creating a “pay-to-pollute” system.
7.2 Lack of Standardization
Different countries and agencies certify credits differently, leading to trust issues.
7.3 Price Volatility
Carbon prices can fluctuate widely, reducing market stability.
7.4 Ethical Concerns
Projects in poorer countries may displace communities or fail to deliver promised benefits.
8. Technology & Innovation in Carbon Markets
Blockchain: Ensures transparency and prevents double-counting of credits.
AI & Big Data: Improve ESG ratings and carbon accounting accuracy.
Tokenization: Carbon credits can be turned into digital assets for trading on exchanges.
IoT & Satellites: Verify carbon sequestration in forests or farms.
9. Case Studies
9.1 Tesla
Tesla earned billions by selling carbon credits to traditional automakers who failed to meet emission targets.
9.2 Indian Renewable Energy Projects
Solar and wind farms in India generate certified credits, which are sold internationally.
9.3 Amazon’s Climate Pledge
Amazon invests in carbon offsets like reforestation and carbon removal technologies to fulfill its 2040 net-zero pledge.
10. Future Outlook
Net Zero by 2050: Countries and corporations are setting binding targets, boosting credit demand.
Integration of ESG & Carbon Markets: ESG disclosures will increasingly require detailed carbon offset data.
Rise of Nature-Based Solutions: Forests, wetlands, and agriculture will dominate offset markets.
Global Carbon Price Convergence: Over time, voluntary and compliance markets may merge into a unified global framework.
11. Conclusion
ESG and Carbon Credit Trading are two sides of the same coin. ESG provides the lens through which businesses are judged on sustainability, while carbon credits provide the currency that enables emission reductions to be quantified, traded, and scaled.
However, challenges remain – greenwashing, standardization, and pricing uncertainty. For ESG and carbon markets to fulfill their promise, they must evolve with stronger regulations, technological innovations, and genuine corporate accountability.
In the future, ESG and carbon credits will not remain “add-ons” to business strategy – they will be at the core of financial systems, investment portfolios, and trade. The global economy is slowly transforming into one where sustainability is not optional, but essential.

Energy Transition & Commodity Supercycle1. Introduction
The world is standing at the intersection of two powerful forces shaping the global economy: the energy transition and the possibility of a new commodity supercycle.
The energy transition refers to the global shift away from fossil fuels like coal, oil, and natural gas, toward renewable and cleaner energy sources such as solar, wind, hydrogen, and nuclear. This transformation is driven by climate change concerns, technological advancements, and policy shifts by governments worldwide.
A commodity supercycle is a prolonged period (often 10–20 years) where commodity prices—such as oil, copper, lithium, and agricultural goods—rise significantly due to strong structural demand outpacing supply. Past supercycles were fueled by industrial revolutions, wars, and urbanization waves.
Today, these two phenomena are interlinked. The push for clean energy demands massive amounts of new materials—copper for wires, lithium and cobalt for batteries, rare earths for wind turbines, and silver for solar panels. At the same time, fossil fuel demand doesn’t vanish overnight, creating a tug-of-war between old energy and new energy, each influencing commodity markets in profound ways.
2. Historical Context: Past Commodity Supercycles
To understand today’s situation, it’s important to look at history. Commodity supercycles have occurred several times over the past century:
Late 19th century (Industrial Revolution)
Rapid industrialization in Europe and the U.S. fueled huge demand for steel, coal, and oil.
Post-World War II (1950s–70s)
Reconstruction of Europe and Japan required enormous amounts of metals, oil, and agricultural products.
China-led Boom (2000s–2014)
China’s entry into the World Trade Organization (WTO) and its infrastructure-heavy growth led to a surge in oil, iron ore, copper, and coal demand.
Each of these supercycles reshaped global trade and investment. Today, the green energy revolution may drive the next one.
3. What is the Energy Transition?
The energy transition is about changing the way we produce, distribute, and consume energy.
Key Drivers:
Climate Change: Rising global temperatures, extreme weather, and net-zero commitments.
Technology: Falling costs of solar, wind, and batteries.
Policy: Carbon taxes, emission regulations, and renewable energy mandates.
Consumer Behavior: Electric vehicles (EVs), rooftop solar, and ESG (environmental, social, governance) investing.
Main Pillars of Energy Transition:
Renewables: Solar, wind, hydropower, geothermal.
Electrification: EVs, electric heating, smart grids.
Storage: Lithium-ion batteries, hydrogen, pumped hydro.
Decarbonization of industry: Green hydrogen for steel, carbon capture technologies.
This shift requires enormous physical resources, which links the energy transition directly to commodities.
4. Commodity Demands of the Energy Transition
Unlike the oil-driven 20th century, the 21st-century energy system relies on minerals and metals.
Copper
Vital for electrical wiring, EVs, and renewable grids.
A single EV uses 2.5x more copper than a gasoline car.
Demand could double by 2035.
Lithium
Core of rechargeable batteries for EVs and storage.
Demand may rise 7-fold by 2030.
Cobalt
Improves battery life and performance.
Supply concentrated in the Democratic Republic of Congo (DRC), raising geopolitical concerns.
Nickel
Needed for high-energy-density batteries.
Indonesia is emerging as the global hub.
Rare Earths (Neodymium, Dysprosium, etc.)
Essential for magnets in wind turbines and EV motors.
China controls ~80% of global supply.
Silver
Used in solar panels.
Rising solar installations = surging silver demand.
This demand creates the foundation for a green commodity supercycle.
5. Supply-Side Challenges
Demand growth is one side of the equation. Supply, however, faces major bottlenecks:
Long Lead Times: New mines take 10–15 years to develop.
Geopolitical Risks: Resource nationalism, export bans, and trade tensions.
Environmental & Social Concerns: Local opposition, ESG scrutiny, and water use in mining.
Underinvestment: Years of low prices discouraged new projects in oil and mining sectors.
The result? Structural shortages that push prices higher.
6. The Role of Fossil Fuels in Transition
While the world shifts to renewables, oil and gas remain critical in the short and medium term:
Oil: Needed for transportation, petrochemicals, aviation.
Natural Gas: Acts as a “bridge fuel” to renewables.
Coal: Still dominant in India, China, and parts of Africa.
Ironically, underinvestment in fossil fuels—due to climate pressures—could trigger short-term price spikes, fueling inflation and instability.
This creates a paradox: the transition away from fossil fuels may actually make them more expensive in the interim.
7. Economic Implications of an Energy-Driven Supercycle
If the green transition sparks a commodity supercycle, the ripple effects are vast:
Inflationary Pressures
Higher commodity prices = higher costs of goods.
Potential stagflation risks.
Winners & Losers
Winners: Resource-rich nations (Chile for lithium, Indonesia for nickel, Australia for iron ore, Africa for cobalt).
Losers: Import-dependent nations (India, Japan, Europe).
Investment Shifts
Mining, renewable infrastructure, EV supply chains attract capital.
Traditional oil & gas companies under pressure but may benefit from short-term price spikes.
Currency Impact
Commodity exporters’ currencies (AUD, CAD, CLP) strengthen.
Importers’ currencies weaken.
Global Trade Patterns
New alliances forming around critical minerals (U.S. + Australia, China + Africa).
8. Geopolitics of Energy Transition
Energy has always been geopolitical. In the past, oil shaped wars, alliances, and global dominance. In the future, critical minerals will play that role.
China: Dominates rare earths and battery manufacturing.
U.S. & Europe: Trying to secure supply chains via partnerships (Inflation Reduction Act, EU Critical Raw Materials Act).
Africa & Latin America: Emerging as key battlegrounds for resources.
Middle East: Investing in hydrogen and renewables to stay relevant in a post-oil world.
This geopolitical race adds volatility and competition, feeding into the supercycle narrative.
9. Financial Markets & Commodities
A commodity supercycle doesn’t just impact physical trade—it also reshapes financial markets:
Hedge Funds & ETFs: Increasing exposure to lithium, copper, and rare earths.
Retail Investors: Gaining access via green commodity ETFs.
Central Banks: Worry about inflation and commodity-driven shocks.
Corporates: Automakers (Tesla, BYD, Ford) racing to secure long-term mineral contracts.
Commodities are no longer just “raw materials”—they are becoming strategic assets.
10. Risks to the Supercycle Thesis
While the green supercycle is a strong narrative, there are risks:
Technological Breakthroughs
Battery alternatives (sodium-ion, solid-state) could reduce lithium/cobalt demand.
Policy Shifts
Political resistance to climate policies may slow transition.
Recycling & Circular Economy
Secondary supply from recycling could offset new demand.
Economic Slowdowns
Recessions or prolonged low growth may dampen demand.
Overestimation of Speed
Energy transitions historically take decades, not years.
11. Case Studies
a. Lithium Boom
Between 2020–2023, lithium prices rose more than 500%, driven by EV demand. Though prices later corrected, the volatility highlights supply-demand mismatches.
b. Copper as “New Oil”
Goldman Sachs and other analysts call copper the “new oil” because electrification is impossible without it. Current supply projections suggest a multi-million-ton deficit by 2030.
c. Oil Paradox
Despite climate goals, oil demand hit record highs in 2023–2024, showing the sluggish pace of transition. This means both fossil fuels and green metals can rally simultaneously.
12. Future Outlook: 2025–2040
Looking ahead, the interplay of energy transition and commodities will shape economies:
Short Term (2025–2030):
High volatility, shortages in copper, lithium, and nickel.
Oil remains essential but faces supply tightness.
Prices of key metals remain elevated.
Medium Term (2030–2040):
Renewables and EVs dominate new investment.
Recycling industry scales up.
New supply from Africa/Latin America stabilizes markets somewhat.
Long Term (2040+):
Fossil fuel demand declines sharply.
Clean energy minerals dominate trade flows.
Commodity power shifts from Middle East to Latin America & Africa.
13. Conclusion
The energy transition is not just about climate—it’s a structural re-engineering of the world economy. This transformation requires vast amounts of resources, creating conditions for a commodity supercycle unlike any in history.
But unlike past cycles driven by industrial revolutions or urbanization, this one is shaped by decarbonization, technology, and geopolitics. It’s a cycle that could bring prosperity to resource-rich nations, inflationary shocks to consumers, and massive shifts in global trade.
Whether it lasts 10 years or 20, the green commodity supercycle is likely to redefine wealth, power, and progress in the 21st century.
Derivatives Trading in Emerging Markets1. Understanding Derivatives in Simple Terms
A derivative is essentially a financial contract whose value is derived from an underlying asset. That asset could be anything — stocks, bonds, currencies, commodities, or even interest rates.
Think of it like this:
If you and your friend bet on whether the price of gold will go up or down next month, you’ve entered into a type of derivative contract.
The bet itself has no standalone value; it derives its worth from the movement of gold prices.
The most common types of derivatives include:
Futures Contracts – Agreements to buy or sell an asset at a fixed price on a future date.
Options Contracts – Rights (but not obligations) to buy or sell an asset at a specific price before a given date.
Forwards Contracts – Custom, over-the-counter (OTC) agreements similar to futures, but privately negotiated.
Swaps – Agreements to exchange cash flows, such as fixed interest for floating interest.
In developed economies, derivatives trading is massive. The notional value of global derivatives markets runs into hundreds of trillions of dollars. But in emerging markets, the journey is still evolving.
2. Why Derivatives Matter in Emerging Markets
Emerging markets — like India, Brazil, China, South Africa, Mexico, and Turkey — are characterized by fast economic growth, higher volatility, and developing financial institutions.
Here’s why derivatives play such a crucial role in these economies:
Risk Management (Hedging)
Commodity producers (like farmers in India or oil exporters in Brazil) face price volatility. Derivatives allow them to lock in prices and reduce uncertainty.
For example, an Indian farmer can use a futures contract on wheat to protect against falling prices during harvest.
Price Discovery
Derivatives markets help determine fair prices of commodities and financial assets. Futures on stock indices or currencies often reflect real-time demand-supply expectations.
Liquidity & Market Depth
They increase participation in markets. A liquid derivatives market often boosts liquidity in the cash (spot) market as well.
Investment Opportunities
For global investors, derivatives provide exposure to emerging market growth stories without needing to directly own local stocks or bonds.
Integration with Global Finance
Derivatives connect emerging markets with global capital flows, making them part of the broader financial ecosystem.
3. Historical Development of Derivatives in Emerging Markets
The journey of derivatives in emerging economies is relatively recent compared to the U.S. or Europe. Let’s take a quick tour:
India
India banned derivatives trading in 1952 due to speculation risks.
In 2000, it reintroduced derivatives on stock indices and later expanded into single-stock futures, options, and commodity derivatives.
Today, India has one of the largest derivatives markets in the world by volume.
Brazil
BM&F Bovespa (now part of B3 exchange) has been a pioneer in Latin America.
It introduced futures contracts on commodities like coffee and later expanded into financial derivatives.
China
Initially cautious due to speculation risks, China opened derivatives trading in the 1990s.
Today, the Shanghai Futures Exchange and China Financial Futures Exchange trade a wide range of contracts.
South Africa
The Johannesburg Stock Exchange (JSE) has a robust derivatives segment, including agricultural futures.
Turkey & Mexico
Both countries have developed active currency and interest rate derivative markets, driven by macroeconomic volatility.
The common thread? Derivatives in emerging markets often start with commodities (agriculture, metals, or energy) and later expand into financial products.
4. Key Types of Derivatives in Emerging Markets
a. Commodity Derivatives
Farmers, miners, and exporters rely heavily on futures and options.
Example: Brazil’s coffee futures, India’s gold futures, and South Africa’s maize futures.
b. Equity Derivatives
Stock index futures and options are increasingly popular.
India’s Nifty50 futures are among the most traded globally.
c. Currency Derivatives
Emerging markets often face currency volatility due to capital flows.
Currency futures (like USD/INR in India) help businesses hedge exchange rate risks.
d. Interest Rate Derivatives
Less developed compared to developed nations, but growing fast.
For example, Mexico and Turkey have active interest rate swap markets due to inflation risks.
5. Opportunities in Derivatives Trading in Emerging Markets
Emerging markets present unique opportunities for traders, investors, and institutions:
High Growth Potential
As economies grow, demand for derivatives rises.
Market Inefficiencies
Emerging markets often display mispricing due to less competition, creating arbitrage opportunities.
Commodity Exposure
Emerging economies are major commodity producers. Derivatives give exposure to commodities like oil, metals, and agriculture.
Retail Participation
In markets like India, retail investors are driving growth in equity derivatives.
Global Diversification
International investors can diversify by accessing emerging market derivatives.
6. Risks and Challenges
While the opportunities are strong, derivatives in emerging markets come with risks:
Volatility
Emerging markets often face sharp price swings due to political or economic shocks.
Regulatory Uncertainty
Policies can change overnight, restricting or liberalizing derivative trading.
Liquidity Issues
Some contracts lack depth, making it hard to exit positions.
Counterparty Risk
In over-the-counter markets, the risk of default is higher.
Speculation vs. Hedging
Regulators often worry about excessive speculation destabilizing markets.
Lack of Awareness
Many small businesses or retail traders in emerging markets don’t fully understand derivatives, leading to misuse.
7. Regulatory Landscape
Regulation plays a defining role in shaping derivative markets.
India: The Securities and Exchange Board of India (SEBI) oversees derivatives trading. It has gradually opened the market but remains cautious about speculation.
Brazil: B3 Exchange operates under the Brazilian Securities and Exchange Commission (CVM).
China: The China Securities Regulatory Commission (CSRC) keeps a tight grip, limiting speculative contracts.
South Africa: The Financial Sector Conduct Authority regulates derivatives under the JSE.
A common theme is balancing market development with financial stability. Too much speculation could cause systemic risks; too much control could stifle growth.
8. Case Studies
Case 1: India’s Nifty Derivatives Boom
Nifty index futures and options dominate global trading volumes.
Low margin requirements and high retail participation fueled this growth.
Case 2: Brazil’s Coffee Futures
Brazil is the world’s largest coffee producer. Coffee futures contracts in São Paulo provide global benchmarks for pricing.
Case 3: China’s Cautious Path
China introduced stock index futures in 2010 but imposed heavy restrictions after the 2015 market crash. This shows the delicate balance regulators maintain.
9. The Future of Derivatives in Emerging Markets
The next decade could see explosive growth in emerging market derivatives:
Digital Platforms & Fintech
Online trading apps will democratize access.
ESG & Green Derivatives
New contracts may emerge around carbon credits and renewable energy.
Cross-Border Trading
Greater integration with global exchanges.
Blockchain & Smart Contracts
Could reduce counterparty risks and improve transparency.
Retail Power
Just like in India, retail traders will drive volume growth in many countries.
10. Conclusion
Derivatives trading in emerging markets is both a story of promise and caution. On one hand, these instruments help farmers, exporters, and investors hedge against volatility, improve price discovery, and connect to global finance. On the other, misuse and over-speculation can destabilize fragile economies.
For investors, derivatives in emerging markets are not just about chasing profits — they are about understanding the heartbeat of fast-growing economies. As regulations mature, technology spreads, and education improves, these markets could very well become the engines of global derivatives growth.
LiamTrading – A Long-Term Trend in XAUUSD is EmergingGold continues its strong upward momentum, currently trading around 3,680 – 3,685. Following a series of consecutive bullish candles, the price is showing signs of consolidation and slight correction, paving the way for an important scenario in the upcoming phase.
Technical Analysis
On the Daily chart, the RSI has surpassed the 70 mark, indicating an overbought condition. This is often an early warning sign for a potential correction.
The price structure suggests that the FVG zone of 3,630 – 3,600 will be the first observation point if a short-term correction occurs.
A stronger support zone lies at 3,510 – 3,475, coinciding with the Fibonacci 0.5 – 0.382 levels and also the previous resistance area that has been broken. This is considered a potential long-term 'Buy zone'.
If the correction phase completes, gold could fully resume its upward trend with a further target around 3,800 (Fibonacci extension levels 2.618 – 3.618).
Trading Scenarios
Short-term: Monitor the reaction at 3,630 – 3,600. If it holds, a short-term rebound may occur. Pay attention to the price area around 3552-3562 for reactions.
Medium-term: Wait for the price to test the 3,500 – 3,475 zone to find more sustainable buying opportunities.
Long-term: The major trend still leans towards an increase, with the expected target aiming for 3,800.
This is my personal view on XAUUSD, and you can use it as a reference to build your own plan. If you find it helpful, follow me for the latest updates on gold scenarios.

XAUUSD – Strong Resistance at 3760–3770 Await ConfirmationHello trader,
Gold continues to oscillate within an accumulation zone following its recent recovery. While the overall trend leans towards an increase, a stronger breakout requires clear confirmation at key resistance-support levels.
Strong Resistance: 3760 – 3770, confluence with the Fibonacci extension zone. This is a pivotal level if the price aims to set a new ATH in the mid-term.
Key Level Sell: 3685 – 3695, currently a short-term resistance zone. If the price fails to break through, gold may face downward pressure.
Important Support:
3564 – 3574: mid-term support.
3534 – 3540: deep support zone, aligning with previous liquidity.
MACD H4: Histogram remains weak, momentum is unclear → the market needs further confirmation to clarify the trend direction.
Trading Scenarios
Bullish Scenario
Condition: Price breaks above 3695 and holds.
Entry: Retest 3665 – 3668.
Target: 3680-3698-3715-3730 – 3760 – 3770.
Extension: If successfully surpassing 3770 → expect a move towards 3800+.
Bearish Scenario
Condition: Price fails at 3695 and reverses.
Entry: Sell at 3685 – 3695 when a rejection signal appears.
Target: 3672-3655-3635 – 3600 – 3574.
Extension: If 3574 breaks, the decline may target 3540, or even lower.
Mid-term Scenario
Price may retest 3534 – 3550 to gather liquidity, then rebound according to the larger trend. This will be an attractive long-term Buy zone.
The gold market is at a crucial stage: buyers need to break 3695 to confirm an uptrend, while sellers still have opportunities at the short-term resistance zone. Deep support areas will continue to serve as the foundation for mid-term Buy strategies.
Keep a close eye on the 3695 and 3760 – 3770 zones to determine the next direction.
Stay tuned for the latest scenarios as the price structure evolves.

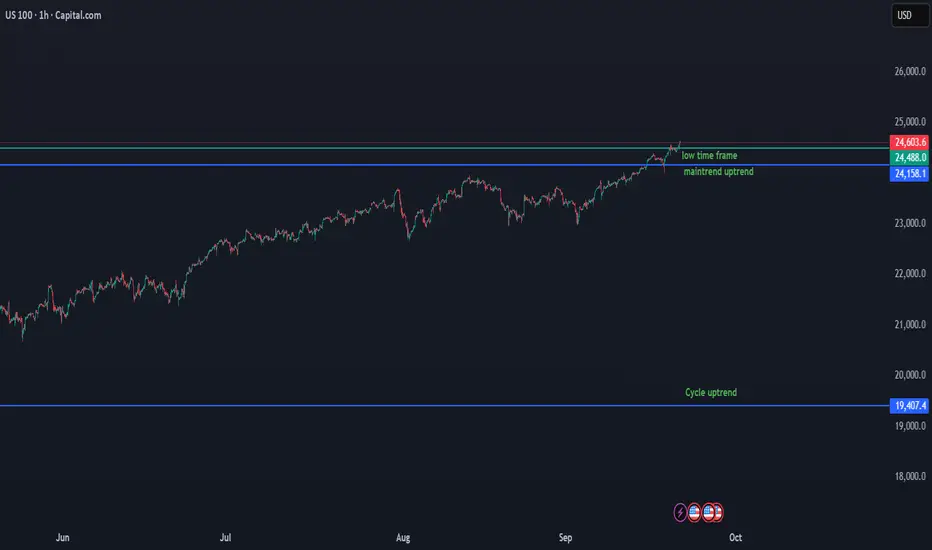
US100 Key Levels & Trend OutlookUS100 Update
We use advanced data that counts the start of the cycle and all important key levels.
On the low time frame, Nasdaq is consolidating just above the 24,516 – 24,488 support zone, which now acts as the key base for continuation.
Key levels:
24,516 – 24,488 → critical short-term support. Holding above confirms continuation of the uptrend.
24,603+ → current resistance. A clean breakout and hold above this level would extend bullish momentum and push toward new highs.
Downside risk: If price breaks back below 24,488, the next support sits around 24,158. A deeper breakdown from there could open a correction toward 23,404.
Cycle support: 19,407 is the major cycle uptrend level. Nasdaq must stay above this to keep the long-term bullish structure intact.
📌 Summary
Above 24,516 – 24,488 → bullish continuation in play.
Break & hold above 24,603 → signals further upside.
Below 24,488 → correction risk, first support at 24,158, then 23,404.
19,407 → cycle-level support for the long-term trend.
BTC DATA UPDATEBTC/USDT Update
On the low time frame, BTC is still in a breakdown structure. Price is consolidating under pressure around the 115.7K zone.
Key levels to watch:
116K → first level where momentum could shift.
116.5K → confirmation level. A strong break and hold above 116.5K would confirm a new uptrend and open the way to higher levels.
Failure to confirm above 116.5K means risk remains for further downside continuation.
Critical support: 112.8K is an important cycle level BTC must hold to stay inside the green cycle.
If 112.8K breaks, probability increases for a deeper correction toward lower zones (110K–108K).
Until BTC closes and confirms above 116.5K, bias remains cautiously bearish/sideways.
📌 Summary
Below 116K → breakdown structure remains active.
Break & confirmation above 116.5K → bullish scenario opens.
112.8K → must-hold cycle support for the green cycle.

The Big Short? BTCHere we have an ascending channel on the 15 minute chart bulls have been weak since our recent top. I feel a strong move is coming here soon in the market time to lock in.

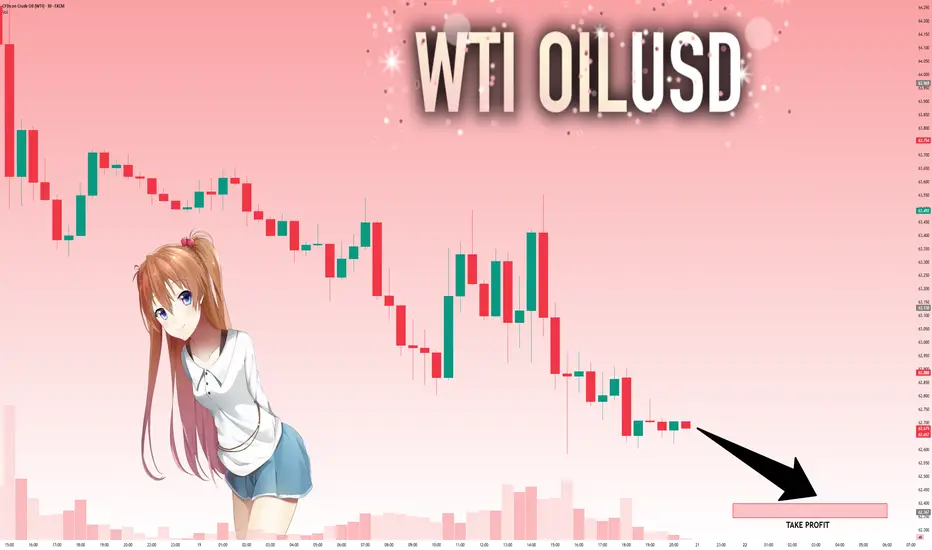
USOIL: Strong Bearish Sentiment! Short!
My dear friends,
Today we will analyse USOIL together☺️
The in-trend continuation seems likely as the current long-term trend appears to be strong, and price is holding below a key level of 62.657 So a bearish continuation seems plausible, targeting the next low. We should enter on confirmation, and place a stop-loss beyond the recent swing level.
❤️Sending you lots of Love and Hugs❤️
NG1!: Bulls Are Winning! Long!
My dear friends,
Today we will analyse NG1! together☺️
The market is at an inflection zone and price has now reached an area around 2.920 where previous reversals or breakouts have occurred.And a price reaction that we are seeing on multiple timeframes here could signal the next move up so we can enter on confirmation, and target the next key level of 2.958.Stop-loss is recommended beyond the inflection zone.
❤️Sending you lots of Love and Hugs❤️

NI225: Next Move Is Up! Long!
My dear friends,
Today we will analyse NI225 together☺️
The price is near a wide key level
and the pair is approaching a significant decision level of 45,043.01 Therefore, a strong bullish reaction here could determine the next move up.We will watch for a confirmation candle, and then target the next key level of 45,362.30.Recommend Stop-loss is beyond the current level.
❤️Sending you lots of Love and Hugs❤️

CAD_CHF RESISTANCE AHEAD|SHORT|
✅CAD_CHF is set to retest
A strong resistance level
Above at 0.5790 after trading
In a local uptrend for some time
Which makes a bearish pullback
A likely scenario with the target
Being a local support
Below at 0.5763
SHORT🔥
✅Like and subscribe to never miss a new idea!✅

NZD_CAD IS OVERSOLD|LONG|
✅NZD_CAD is going down
Now but a strong support
Level is ahead at 0.8060
And as the pair is oversold
I am expecting a rebound
And a move up towards
The target of 0.8080
LONG🚀
✅Like and subscribe to never miss a new idea!✅
