Role of the US Dollar as the World Reserve Currency1. What is a Reserve Currency?
A reserve currency is a foreign currency held in significant amounts by central banks and financial institutions for international transactions, investments, and foreign exchange reserves.
Key Functions of a Reserve Currency:
Medium of Exchange – Used for international trade settlement (e.g., oil, gold, technology).
Store of Value – Trusted to maintain value during crises and inflation.
Unit of Account – Used to price global commodities and contracts.
Anchor Currency – Many countries peg their currencies to it to maintain stability.
Currently, the US dollar fulfills these functions more than any other currency.
2. Historical Background: Rise of the Dollar
2.1 Before the Dollar – The Age of the British Pound
Before World War II, the British Pound Sterling was the dominant reserve currency. Britain’s vast empire, global trade routes, and London’s financial power made the pound central to world commerce.
2.2 The Shift During World War II
The war weakened Europe’s economies, especially the UK.
The United States emerged as the world’s strongest industrial and financial power.
Gold reserves shifted heavily to the US during the war, strengthening the dollar.
2.3 The Bretton Woods Agreement (1944)
The turning point came in 1944, when 44 countries met in Bretton Woods, New Hampshire. They agreed:
The US dollar would be pegged to gold ($35 per ounce).
Other currencies would peg themselves to the dollar.
Institutions like the IMF and World Bank were created to support this system.
This effectively made the dollar the anchor of the global financial system.
2.4 The Nixon Shock (1971)
In 1971, President Richard Nixon ended the dollar’s convertibility to gold due to inflation and trade imbalances. The world moved to a fiat currency system—currencies not backed by gold but by trust and government regulation.
Even without gold, the dollar remained dominant because:
The US economy was still the largest.
Oil-producing nations priced oil in dollars (the Petrodollar system).
Global trust in American institutions continued.
3. Why the US Dollar Became the Global Reserve Currency
Several reasons explain why the US dollar holds its unique position:
3.1 Economic Strength of the US
The US has the world’s largest economy in nominal GDP.
Strong industrial and technological base.
Stable growth and global innovation leadership.
3.2 Trust in American Institutions
Independent central bank (Federal Reserve).
Transparent financial markets.
Rule of law and strong property rights.
3.3 Deep and Liquid Financial Markets
US Treasury bonds are seen as the safest investment in the world.
Massive and liquid stock and bond markets.
Foreign investors can easily buy and sell dollar assets.
3.4 Global Trade and Commodities in Dollars
Oil, natural gas, and many commodities are priced in dollars.
Shipping contracts, loans, and international trade settlements are often dollar-denominated.
3.5 Network Effect
The more countries use the dollar, the stronger its dominance becomes. This creates a self-reinforcing cycle.
4. The Dollar’s Role in International Trade
The US dollar is the language of global trade:
About 60% of global foreign exchange reserves are held in dollars.
Around 40-50% of global trade invoices are denominated in dollars, even when the US is not directly involved.
Over 80% of foreign exchange transactions involve the dollar.
4.1 Petrodollar System
After the 1970s oil crisis, the US struck deals with oil-producing nations (like Saudi Arabia) to price oil exclusively in dollars. This forced every country to hold dollars to buy oil, cementing the dollar’s global demand.
4.2 International Loans and Debt
Many developing countries borrow in dollars.
The IMF and World Bank often lend in dollars.
Dollar-denominated debt makes countries vulnerable to dollar fluctuations.
5. Benefits of Dollar Dominance
The US enjoys “exorbitant privilege” (a term coined by French economist Valéry Giscard d’Estaing) because of the dollar’s global role.
5.1 For the United States
Lower Borrowing Costs – US Treasury bonds are in high demand, allowing the US government to borrow cheaply.
Trade Advantage – The US can run trade deficits without the same risks as other nations.
Financial Power – Ability to impose sanctions (cutting nations off from the dollar system).
Seigniorage – Printing money at low cost while others must earn or buy dollars.
5.2 For the World
Stability – Dollar provides a stable benchmark for trade.
Liquidity – Large, efficient financial markets for dollar assets.
Safe Haven – Investors flock to the dollar during crises.
6. Risks and Criticisms of Dollar Hegemony
While the dollar has advantages, it also creates challenges:
6.1 Dollar Dependence
Countries dependent on dollars are vulnerable to US monetary policy.
A stronger dollar raises costs for emerging markets with dollar debt.
6.2 US Sanctions Power
The US uses the dollar system as a geopolitical tool (e.g., against Iran, Russia).
Critics argue this overuse could push countries to seek alternatives.
6.3 Global Imbalances
Persistent US trade deficits.
Surplus countries (like China, Japan) accumulate massive dollar reserves.
6.4 Inflation Export
US monetary policy (like money printing during crises) affects the whole world.
Dollar weakness can cause global commodity price swings.
7. Challenges to Dollar Dominance
7.1 The Euro
The Euro is the second most held reserve currency.
Used heavily in Europe and trade with neighboring nations.
But limited by EU fragmentation and debt crises.
7.2 The Chinese Yuan (Renminbi)
China pushes for internationalization of the yuan.
Initiatives like the Belt and Road, yuan-based oil contracts, and digital yuan.
But limited by capital controls, lack of transparency, and political risks.
7.3 Cryptocurrencies and Digital Assets
Bitcoin and stablecoins provide alternatives for cross-border transfers.
Central Bank Digital Currencies (CBDCs) may reduce reliance on the dollar.
7.4 Gold and Commodity-Backed Systems
Some nations diversify reserves into gold.
Talk of commodity-backed trading blocs (e.g., BRICS discussions).
8. Future Outlook
The US dollar remains dominant, but its future is debated.
Short Term (next 10 years): Dollar dominance will likely continue due to lack of credible alternatives.
Medium Term (10-30 years): Multipolar system possible, with euro, yuan, and digital currencies gaining ground.
Long Term: Dollar may no longer be absolute king, but will remain a key pillar in a diversified global reserve system.
9. Case Studies
9.1 Dollar in the 2008 Global Financial Crisis
Investors rushed into dollars and US Treasuries as a safe haven.
Showed trust in the dollar even when the crisis began in the US.
9.2 Dollar in Russia-Ukraine Conflict (2022–2025)
US sanctions cut Russia off from the dollar system.
Russia increased trade in yuan, gold, and rubles.
Demonstrates how geopolitics can influence currency use.
10. Conclusion
The US dollar’s role as the world reserve currency is both a reflection of America’s economic power and a foundation of global stability. It gives the US unmatched advantages but also responsibilities.
It emerged from the ruins of World War II, supported by the Bretton Woods system and the petrodollar.
It dominates trade, finance, and reserves because of trust, liquidity, and network effects.
It provides stability, but also creates risks of overdependence and geopolitical tensions.
Alternatives like the euro, yuan, and digital currencies exist, but none are ready to replace the dollar yet.
In essence, the dollar is more than just money—it is the bloodstream of global commerce. Whether its dominance lasts for decades more or gradually gives way to a multipolar currency system will depend on geopolitics, technology, and the choices nations make.
Tradingforex
Blockchain in Trading1. Introduction to Blockchain & Trading
Trading has always been the lifeblood of financial markets. From the ancient barter system to modern electronic stock exchanges, trading has evolved with technology. The 21st century brought algorithmic trading, online platforms, and digital assets. But now, another revolutionary technology is reshaping trading: Blockchain.
Blockchain is often described as a distributed digital ledger that records transactions securely, transparently, and immutably. Unlike traditional databases, it doesn’t rely on a single central authority. Instead, multiple participants (nodes) maintain a synchronized copy of the ledger.
In trading, whether it’s stocks, bonds, commodities, currencies, or derivatives, the biggest challenges have been trust, transparency, speed, and costs. Blockchain directly addresses these pain points. By combining decentralization, security, and automation, blockchain is transforming how trading is executed, cleared, and settled.
2. Core Features of Blockchain Relevant to Trading
To understand why blockchain is powerful for trading, let’s break down its key features:
Decentralization: Removes dependence on intermediaries like brokers or clearing houses.
Transparency: Every transaction is visible on the ledger, reducing fraud.
Immutability: Once recorded, transactions cannot be altered.
Security: Cryptographic encryption makes hacking extremely difficult.
Programmability: Smart contracts can automate trades, settlements, and compliance.
Speed: Reduces settlement time from days (T+2, T+3) to minutes or seconds.
These features make blockchain a natural fit for trading ecosystems, where billions of dollars move daily and where even micro-delays or small inefficiencies can create huge costs.
3. Blockchain in Stock Markets
Traditional stock markets operate with multiple intermediaries—brokers, exchanges, custodians, clearing houses, and regulators. Each layer adds cost, delay, and counterparty risk.
Blockchain can simplify this by enabling:
Direct peer-to-peer stock trading without intermediaries.
Faster settlements (T+0) instead of T+2 days.
Reduced reconciliation errors, since all parties view the same ledger.
Instant ownership transfer through tokenized shares.
Some exchanges have already started experimenting:
The Australian Securities Exchange (ASX) has explored blockchain for clearing and settlement.
Nasdaq uses blockchain in its private market to manage share issuance and trading.
In the future, we may see fully blockchain-powered exchanges, eliminating inefficiencies of legacy systems.
4. Blockchain in Commodity & Forex Trading
Commodities (gold, oil, agricultural products) and foreign currencies are traded globally, often with complex logistics and verification issues.
Blockchain adds value here by:
Tracking supply chain authenticity (e.g., proving gold is ethically sourced).
Reducing settlement risks in forex trading, where trillions of dollars are exchanged daily.
Tokenization of commodities (digital gold, digital oil futures) for easier trading.
For example, several blockchain platforms already offer gold-backed tokens that represent fractional ownership of real physical gold, making it easier for traders to hedge or invest.
5. Blockchain and Cryptocurrencies
Cryptocurrencies like Bitcoin, Ethereum, and stablecoins are themselves products of blockchain. They represent the first real-world use case of blockchain in trading.
Key points:
24/7 global trading of cryptocurrencies—unlike stock markets, crypto never sleeps.
Volatility and liquidity attract traders worldwide.
Decentralized exchanges allow crypto-to-crypto trades without intermediaries.
Stablecoins (USDT, USDC) enable easy conversion to digital dollars, simplifying settlement.
Crypto trading is proof that blockchain can handle massive trading volumes at a global scale.
6. Smart Contracts in Trading
Smart contracts are self-executing agreements coded on a blockchain. They execute automatically when predefined conditions are met.
In trading, smart contracts can:
Automate buy/sell orders once certain prices are hit.
Ensure automatic dividend payouts to shareholders.
Execute margin calls without broker intervention.
Handle derivative contracts (futures, options, swaps).
This reduces the need for manual verification and minimizes the risk of disputes.
7. Decentralized Exchanges (DEXs)
Traditional exchanges (like NYSE, NSE, or CME) are centralized, meaning a single entity controls order matching and settlements.
DEXs use blockchain to allow direct peer-to-peer trading of assets.
Advantages:
No central authority—reduces censorship risks.
Lower fees—since intermediaries are removed.
Self-custody—traders keep control of their funds until trade execution.
Examples: Uniswap, PancakeSwap, dYdX.
While currently focused on crypto assets, in the future, DEXs could expand to tokenized stocks, bonds, and commodities.
8. Tokenization of Assets & Fractional Ownership
Tokenization means converting real-world assets into digital tokens on a blockchain.
For trading, this unlocks new possibilities:
Fractional ownership: Small investors can buy a fraction of a share, a piece of real estate, or a portion of a commodity.
Liquidity: Illiquid assets (like real estate, art, or private equity) become tradeable on digital platforms.
Global access: A trader in India could own fractions of US real estate through blockchain tokens.
For example, companies are working on tokenized stocks (synthetic Tesla shares, Amazon tokens) and tokenized real estate markets.
9. Blockchain in Clearing & Settlement
In traditional trading, clearing and settlement can take 2–3 days, creating counterparty risks.
Blockchain can reduce this to real-time settlement:
T+0 instead of T+2/T+3.
Removes the need for separate reconciliation across different parties.
Cuts down operational costs significantly.
For instance, the Depository Trust & Clearing Corporation (DTCC) in the US has been experimenting with blockchain to handle trillions of dollars worth of settlements.
10. Benefits of Blockchain in Trading
Speed – Real-time settlement instead of days.
Cost Reduction – Fewer intermediaries.
Transparency – Open ledger for all participants.
Security – Difficult to tamper with records.
Accessibility – Global participation, fractional investing.
Efficiency – Automated processes reduce errors.
Conclusion
Blockchain is not just about Bitcoin—it is a transformational technology for trading. From stocks and commodities to real estate and art, blockchain enables faster, cheaper, safer, and more inclusive trading.
While challenges remain in regulation, scalability, and adoption, the trajectory is clear: Blockchain is set to become the foundation of next-generation trading ecosystems.
Just as the internet transformed communication, blockchain is transforming trust and value exchange. In trading, where trust and speed are everything, blockchain’s impact could be as profound as the invention of electronic exchanges themselves.
World Market1. Introduction: What is the World Market?
When we say world market, we are talking about the big global system where countries, companies, and people buy and sell things with each other. Imagine it like a giant marketplace, but instead of being in one city or country, it covers the whole planet.
In this marketplace, nations trade goods like oil, gold, wheat, cars, and technology. They also trade services like banking, tourism, shipping, and software. On top of that, there are financial markets—where people trade stocks, bonds, currencies, and even digital assets like Bitcoin.
The world market is not one single place. It is more like a network of many smaller markets (stock markets, commodity markets, forex, etc.) that are linked together. Thanks to the internet, globalization, and technology, all of these markets influence each other. If oil prices rise in the Middle East, it affects stock prices in America, inflation in India, and shipping costs in Europe.
So, the world market is basically the heartbeat of global economics.
2. How Did the World Market Start? (A Quick History)
The global market did not appear overnight. It evolved step by step:
Ancient Times:
People used barter systems—exchanging goods for goods.
Then came coins and early trade routes like the Silk Road, connecting China, India, and Europe.
Medieval & Colonial Era (1500s–1800s):
European countries like Spain, Portugal, and Britain started exploring new lands.
They built colonies and traded spices, gold, cotton, and sugar worldwide.
This was when global trade became organized (but often unfair, because colonies supplied raw materials while Europe got rich).
Industrial Revolution (1700s–1900s):
Factories, machines, and mass production increased trade massively.
Banks and stock markets grew in London, Paris, and New York.
20th Century (World Wars & Recovery):
World Wars disrupted trade but also made global cooperation more important.
Institutions like the IMF, World Bank, and WTO were created to stabilize world markets.
Modern Globalization (1980s onwards):
Computers, the internet, and communication technology connected markets.
Companies like Apple, Amazon, Toyota, and Samsung became global giants.
Investment started flowing across borders easily.
Today’s Digital Era:
Trade happens instantly through online platforms.
Cryptocurrencies and digital payments are becoming part of the world market.
In short, the world market grew from small local trade → regional trade → global interconnected trade.
3. The Building Blocks of the World Market
The world market is like a giant puzzle made of many smaller markets. Let’s break it down:
a) Stock Market (Equities)
This is where people buy and sell shares of companies.
Example: Buying a share of Apple means you own a tiny part of Apple.
Big stock exchanges: New York Stock Exchange (NYSE), Nasdaq, London Stock Exchange, Tokyo Stock Exchange.
Stock markets help companies raise money and help investors grow their wealth.
b) Commodity Market
This is where raw materials are traded—things like oil, gold, silver, wheat, coffee, and cotton.
Example: If there’s a drought in Brazil, coffee prices go up worldwide.
Big centers: Chicago Mercantile Exchange (CME), London Metal Exchange (LME).
c) Currency/Forex Market
This is the world’s largest financial market. Every day, more than $7 trillion worth of currencies are exchanged.
Example: If you travel from India to the U.S., you need dollars. Forex makes this possible.
Major currencies: U.S. dollar, Euro, Japanese Yen, British Pound, Chinese Yuan.
d) Bond Market (Debt Market)
Governments and companies borrow money by issuing bonds. Investors lend money and earn interest.
Example: U.S. Treasury Bonds are considered the safest investments in the world.
Global bond market size: Over $130 trillion.
e) Derivatives Market
These are financial contracts linked to other assets (stocks, currencies, commodities).
Example: A futures contract on oil lets you lock in today’s price for oil to be delivered later.
Used for hedging (reducing risk) and speculation.
f) Cryptocurrency Market
A new player in the global financial system. Bitcoin, Ethereum, and thousands of other coins are traded.
Operates on blockchain technology (decentralized, no single authority).
Still volatile but becoming mainstream.
4. The Big Players: Global Financial Centers
Some cities are hubs for world markets:
New York (Wall Street): Largest stock exchange, headquarters of major banks.
London: Strong in forex, banking, and insurance.
Tokyo: Asian powerhouse, tech-heavy companies.
Hong Kong & Singapore: Important for Asia-Pacific trade.
Dubai: Key for oil and Middle East trade.
These cities are like control rooms of the world economy.
5. Who Participates in the World Market?
The world market is made of different participants:
Governments & Central Banks: Control monetary policy, manage reserves.
Big Institutions (Mutual Funds, Hedge Funds): Invest huge amounts of money.
Banks: Provide credit, forex, and global finance.
Corporates (like Apple, Reliance, Toyota): Sell products worldwide.
Retail Investors (ordinary people): Buy shares, trade crypto, invest savings.
Each player has a role, and together they keep the market alive.
6. Why is the World Market Important?
For Countries: It allows nations to trade goods and services they don’t produce themselves. Example: India imports oil, but exports IT services.
For Companies: They can raise funds, expand globally, and access new customers.
For People: Ordinary investors can build wealth, buy international goods, and travel easily.
For Growth: It creates jobs, drives innovation, and improves living standards.
7. Challenges in the World Market
Even though it’s powerful, the world market faces many challenges:
Geopolitical Risks: Wars, sanctions, trade disputes.
Currency Fluctuations & Inflation: Exchange rates affect global trade.
Market Volatility: Global crises like 2008 crash or COVID-19 pandemic shake the market.
Regulatory Differences: Rules vary from country to country.
Cybersecurity Risks: Online trading systems can be hacked.
Inequality: Rich nations and companies often dominate, leaving poorer nations behind.
8. Future of the World Market
The world market is always changing. Some trends shaping its future are:
Green Finance & Carbon Credit Trading (to fight climate change).
Rise of Emerging Markets (India, Brazil, Africa gaining importance).
Digital Transformation (AI trading, blockchain, e-payments).
Global Retail Investors (apps like Robinhood, Zerodha making investing easy).
Cross-border IPOs (companies listing in multiple countries).
The market is becoming faster, smarter, and more digital.
9. Conclusion
The world market is like a giant web that connects everyone—countries, companies, and individuals. It has grown from ancient trade routes to today’s digital exchanges. While it offers opportunities for growth and wealth creation, it also comes with risks and challenges.
In simple words: the world market is the global stage where the drama of economics, trade, and finance plays out every day.
Economic Risks in Global Trading1. Understanding Economic Risks in Global Trade
Definition
Economic risks are uncertainties related to financial losses or reduced profitability due to changes in economic conditions at domestic or international levels. In global trade, these risks can emerge from:
Exchange rate volatility
Inflationary pressures
Interest rate changes
Economic recessions or booms
Global demand and supply shocks
Balance of payments crises
Why They Matter in Global Trade
Businesses deal with multiple currencies. A sudden depreciation can wipe out profits.
International supply chains make companies vulnerable to inflation and disruptions.
Economic downturns in one region spill over into others, shrinking global demand.
Governments adjust monetary and fiscal policies, impacting trade competitiveness.
Thus, understanding economic risks is crucial for firms and policymakers.
2. Types of Economic Risks in Global Trading
2.1 Currency (Exchange Rate) Risk
One of the most common economic risks is exchange rate volatility. Since global trade is often settled in foreign currencies (primarily US dollars, euros, yen, etc.), fluctuations in exchange rates can directly impact profitability.
Exporter’s perspective: If an Indian company exports goods to the US and invoices in dollars, a sudden appreciation of the rupee against the dollar means it will receive less revenue in rupee terms.
Importer’s perspective: An importer who must pay in foreign currency faces higher costs if their domestic currency depreciates.
Real Example: During the 2013 “Taper Tantrum,” the Indian rupee depreciated sharply against the dollar, increasing import costs for oil and electronics.
2.2 Inflation Risk
Inflation erodes purchasing power and increases the cost of goods. In global trade, high inflation in one country can:
Reduce competitiveness of exports (as goods become more expensive).
Increase import demand (as domestic products lose appeal).
Hurt multinational corporations operating in high-inflation economies.
Case Example: Argentina has faced chronic inflation above 50%, making its exports expensive while discouraging foreign investments.
2.3 Interest Rate Risk
Interest rates affect borrowing costs and investment decisions. Central banks worldwide adjust rates to control inflation or stimulate growth. These changes influence global trade through:
Cost of capital for exporters/importers.
Shifts in currency values (as higher interest rates attract foreign investment).
Reduced consumer demand when borrowing costs rise.
Example: The US Federal Reserve’s aggressive interest rate hikes in 2022 strengthened the dollar, hurting emerging markets by making their debt servicing costlier and exports less competitive.
2.4 Economic Recession and Growth Risk
The health of global economies directly impacts trade volumes.
Recession reduces consumer demand, lowers imports, and shrinks export markets.
Booms stimulate cross-border trade and investment.
Example: The 2008 Global Financial Crisis reduced global trade by nearly 12% in 2009, the steepest drop since World War II.
2.5 Credit and Payment Risk
When businesses trade internationally, they face the risk of buyers defaulting or being unable to make payments due to financial crises, insolvency, or capital controls.
Illustration: During the Asian Financial Crisis (1997–98), many firms in Southeast Asia defaulted on foreign trade payments, causing ripple effects across supply chains.
2.6 Supply Chain and Cost Risk
Global supply chains are highly interconnected. Economic risks can emerge from:
Rising raw material prices.
Freight and shipping cost surges.
Energy price volatility.
Example: The COVID-19 pandemic exposed global supply chain vulnerabilities, with container shortages and freight costs skyrocketing.
2.7 Sovereign and Country Risk
Economic instability at the national level—debt crises, currency collapse, or fiscal mismanagement—can affect international traders.
Example: Sri Lanka’s economic crisis in 2022 led to shortages of foreign reserves, making it difficult to pay for imports like fuel and medicines.
2.8 Commodity Price Risk
For economies dependent on commodity exports (oil, gas, metals, agriculture), global price swings are a major risk.
Oil price collapse in 2014 severely affected Venezuela and Nigeria.
Rising energy costs in 2022 hit European industries heavily.
2.9 Balance of Payments Risk
Persistent trade deficits or current account imbalances can weaken a country’s currency and erode investor confidence, impacting trade flows.
3. Causes of Economic Risks in Global Trading
3.1 Globalization and Interconnectedness
While globalization boosts trade, it also spreads risks faster. A crisis in one region (like the US housing bubble in 2008) quickly spreads worldwide.
3.2 Policy and Regulatory Shifts
Changes in monetary policy, tariffs, or trade agreements alter the economic landscape for businesses.
3.3 Geopolitical Tensions
Wars, sanctions, and political instability cause economic disruptions, particularly in energy and commodity markets.
3.4 Market Speculation and Volatility
Speculative trading in currencies, commodities, and financial markets often amplifies price swings, creating instability.
3.5 Structural Economic Weaknesses
Countries with high debt, low reserves, or over-dependence on certain exports face greater economic risks.
4. Impacts of Economic Risks on Global Trade
4.1 On Businesses
Reduced profitability due to currency fluctuations.
Uncertainty in pricing and contracts.
Delays or losses in payments.
Higher operational costs.
4.2 On Governments
Pressure on foreign exchange reserves.
Difficulty in managing inflation and debt.
Social unrest if trade disruptions cause shortages of essential goods.
4.3 On Consumers
Higher prices for imported goods.
Limited availability of products during crises.
Reduced employment opportunities due to business slowdowns.
4.4 On Global Financial Markets
Capital flight from emerging markets during crises.
Sharp fluctuations in stock and bond markets.
Increased demand for safe-haven assets like gold and US treasuries.
5. Real-World Case Studies
Case 1: Global Financial Crisis (2008)
Triggered by the US housing bubble and banking collapse, this crisis spread worldwide, reducing trade volumes drastically. Export-driven economies like China, Germany, and Japan faced sharp slowdowns.
Case 2: COVID-19 Pandemic (2020–21)
Lockdowns disrupted supply chains, consumer demand collapsed, and global trade volumes shrank by 5.3% in 2020. At the same time, inflation surged due to supply shortages.
Case 3: Russia-Ukraine War (2022)
The war caused energy prices to surge, disrupted wheat exports, and increased global inflation, hurting import-dependent nations.
6. Strategies to Manage Economic Risks
6.1 Currency Risk Management
Hedging using futures, options, and swaps.
Invoicing in domestic currency.
Natural hedging (matching revenues and costs in the same currency).
6.2 Inflation and Interest Rate Risk Control
Diversifying sourcing and supply chains.
Adjusting pricing strategies.
Accessing low-cost financing in stable economies.
6.3 Credit Risk Mitigation
Using letters of credit and export credit insurance.
Conducting due diligence on trade partners.
6.4 Supply Chain Risk Management
Building multiple supplier networks.
Holding strategic inventories.
Using digital tools for supply chain monitoring.
6.5 Government and Policy Measures
Creating trade stabilization funds.
Maintaining adequate foreign exchange reserves.
Negotiating bilateral/multilateral trade agreements.
7. The Future of Economic Risks in Global Trade
Looking ahead, the nature of risks will evolve with changing global dynamics:
De-globalization trends (reshoring, regional supply chains).
Digital currencies and blockchain reducing some payment risks but creating new ones.
Climate change influencing commodity prices and trade routes.
AI-driven markets adding volatility but also improving risk prediction.
Conclusion
Economic risks are an unavoidable part of global trading. While they pose significant challenges—currency volatility, inflation, recessions, commodity shocks—they also encourage innovation in risk management and financial instruments. Businesses and governments that anticipate, adapt, and diversify are better equipped to navigate the turbulent waters of international trade.
Global trade thrives on opportunities but survives on resilience. By recognizing economic risks and building robust strategies, the world economy can continue to benefit from interconnectedness while minimizing vulnerabilities.
Market Correlations between US, Europe, and AsiaIntroduction
Global financial markets are more connected today than at any other time in history. Advances in technology, international trade, cross-border investments, and geopolitical events have created a web of interdependence between major financial hubs. Among them, the United States, Europe, and Asia dominate global capital flows. The performance of one region’s stock market often ripples through the others, creating a pattern of correlations that traders, policymakers, and economists study closely.
This interconnection raises critical questions:
How do U.S. markets influence Europe and Asia?
What role do European economies play in shaping Asian and American markets?
How do Asian giants like China, Japan, and India contribute to the global cycle?
In this comprehensive discussion, we will examine the nature of these correlations, their drivers, historical examples, sectoral linkages, and future implications.
1. Understanding Market Correlations
1.1 Definition
Market correlation refers to the degree to which the returns of different financial markets move together. A positive correlation means markets rise and fall in the same direction, while a negative correlation implies one rises when the other falls. Correlation is often measured using the correlation coefficient, which ranges from -1 (perfect negative correlation) to +1 (perfect positive correlation).
1.2 Why Correlations Matter
Risk management: Investors diversify globally to reduce risk, but high correlations during crises reduce diversification benefits.
Policy implications: Central banks and regulators monitor global spillovers to manage domestic stability.
Trading strategies: Hedge funds, arbitrageurs, and institutional investors use correlation patterns for cross-market trading.
2. Historical Evolution of Cross-Market Correlations
2.1 Pre-1980s – Limited Linkages
Before the 1980s, financial markets were more domestically focused. Capital controls, underdeveloped communication systems, and restricted cross-border trading limited correlations.
2.2 1987 Crash – A Global Wake-Up Call
The Black Monday crash of October 1987 showed how U.S. market turmoil could spread worldwide. The Dow Jones fell 22.6% in a single day, and within 48 hours, Europe and Asia experienced severe declines.
2.3 1990s – Globalization of Capital
Deregulation of financial markets (e.g., Big Bang in London, reforms in Japan).
The rise of multinational corporations.
The Asian Financial Crisis of 1997 revealed how regional shocks could spread globally.
2.4 2000s – Technology & Capital Flows
The Dot-com bubble (2000) and its global consequences.
The 2008 Global Financial Crisis (GFC) originated in the U.S. housing market but triggered recessions across Europe and Asia.
Cross-asset contagion became common.
2.5 2010s – Post-Crisis & Policy Coordination
Central bank policies (Fed, ECB, BOJ) became closely watched worldwide.
Eurozone debt crisis (2010-2012) had ripple effects on U.S. and Asian equities.
Emerging markets (India, China, Brazil) became important players.
2.6 2020s – Pandemic & Geopolitics
COVID-19 shock: All three regions saw simultaneous sell-offs in March 2020.
US-China tensions: Trade wars and sanctions have shaped cross-market linkages.
Ukraine War: Europe’s energy crisis affected U.S. inflation and Asia’s commodity prices.
3. Mechanisms of Interconnection
3.1 Trade Linkages
U.S. demand drives Asian exports (China, Japan, South Korea).
European luxury and industrial goods depend on Asian markets.
Supply chain disruptions in Asia directly affect U.S. and European corporations.
3.2 Investment Flows
U.S. pension funds, European sovereign wealth funds, and Asian central banks invest across borders.
Global ETFs and index funds amplify cross-market flows.
3.3 Currency Markets
Dollar (USD), Euro (EUR), and Yen (JPY) dominate FX markets.
Dollar strength impacts Asian export competitiveness and European debt.
3.4 Interest Rate Policies
U.S. Federal Reserve policy often sets the tone for global monetary conditions.
European Central Bank and Bank of Japan policies create relative yield opportunities.
3.5 Technology & Trading Hours
With overlapping time zones, European markets act as a bridge between Asia’s close and U.S. opening.
Algorithmic trading ensures faster transmission of news across markets.
4. U.S.–Europe Correlations
4.1 General Trends
The U.S. and Europe often move together due to shared economic fundamentals (consumer demand, multinational firms).
Correlations intensify during crises (2008, 2020).
4.2 Sectoral Linkages
Banking: U.S. financial shocks transmit quickly to European banks.
Energy: European reliance on U.S. shale exports.
Tech: NASDAQ performance influences European tech firms (SAP, ASML).
4.3 Case Studies
Eurozone Crisis (2010-12): U.S. markets fell on concerns about European sovereign defaults.
Brexit (2016): U.S. markets reacted to uncertainty, though less severely than Europe.
5. U.S.–Asia Correlations
5.1 China Factor
China’s stock market is less directly correlated due to capital controls, but commodity and trade linkages create indirect effects.
U.S.-China trade war (2018–19) caused synchronized declines.
5.2 Japan & South Korea
Highly sensitive to U.S. demand for technology and automobiles.
Nikkei and KOSPI often mirror Wall Street overnight moves.
5.3 India
U.S. monetary policy strongly influences Indian equities and bonds.
Rising role of Indian IT exports (Infosys, TCS) ties it to NASDAQ trends.
6. Europe–Asia Correlations
6.1 Trade Integration
Europe is a major importer of Asian goods (electronics, automobiles).
Asian demand for European luxury and machinery is significant.
6.2 Market Sentiment
European opening hours often digest Asian trading signals.
Example: A sharp sell-off in Shanghai or Tokyo sets the tone for Europe’s morning session.
6.3 Case Studies
2015 Chinese Stock Market Crash: European equities fell sharply as fears of global slowdown spread.
Russia-Ukraine Conflict: Asian markets fell as Europe faced energy shocks.
7. The Role of Global Events in Synchronizing Markets
Oil Shocks (1973, 2008, 2022): Impacted Europe’s energy costs, Asia’s import bills, and U.S. inflation.
Technology booms: U.S. NASDAQ rallies spread optimism globally.
Pandemics & Natural Disasters: COVID-19 proved all three regions can fall together in panic-driven sell-offs.
8. Measuring Market Correlations
8.1 Statistical Methods
Correlation Coefficients
Cointegration analysis
Volatility spillover models (GARCH, VAR)
8.2 Observed Patterns
Correlations are time-varying (stronger in crises, weaker in calm periods).
Equity correlations have risen steadily since 2000.
Bond market correlations are lower but increasing.
9. Benefits and Risks of High Correlation
9.1 Benefits
Efficient capital allocation.
Faster policy response coordination.
Greater investor access to diversification.
9.2 Risks
Reduced diversification benefits during crises.
Faster contagion effects.
Emerging markets more vulnerable to external shocks.
10. Future Outlook
10.1 Decoupling vs. Integration
Some argue U.S., Europe, and Asia may decouple as regional blocs form (e.g., BRICS, EU autonomy).
However, technology and global capital suggest correlations will remain high.
10.2 Role of Geopolitics
U.S.-China tensions may create dual ecosystems.
Europe’s energy shift post-Ukraine war could change linkages.
10.3 Technology & AI
Algorithmic trading and AI-driven strategies may increase synchronicity.
24/7 crypto markets add another layer of correlation.
Conclusion
The financial ties between the U.S., Europe, and Asia are a cornerstone of the global economy. While local conditions and policies shape short-term moves, long-term trends show increasing correlations across these regions. For traders, investors, and policymakers, understanding these interconnections is critical for navigating risks and opportunities in a globalized marketplace.
Whether it is a Fed rate hike, a European energy crisis, or an Asian export slowdown, the ripple effects are felt across continents almost instantly. The 21st century has transformed financial markets into a global village, where distance no longer insulates economies.
Role of USD as the World Reserve CurrencyIntroduction
The United States dollar (USD) is not just America’s currency; it is the backbone of the global financial system. Since the mid-20th century, the USD has become the primary reserve currency of the world, meaning that central banks, governments, corporations, and investors across the globe hold significant amounts of dollars as part of their reserves for trade, stability, and financial security. Today, nearly 60% of global foreign exchange reserves are held in dollars, and the vast majority of international trade transactions—from oil to gold to manufactured goods—are priced and settled in USD.
The status of the dollar as the world’s reserve currency gives the United States enormous advantages, while also shaping the way global markets, international trade, and financial flows operate. But this role also comes with responsibilities and challenges, and it is increasingly being questioned in light of economic shifts, geopolitical rivalries, and the rise of alternative currencies such as the euro, the Chinese yuan, and even digital assets.
This essay will examine the historical background, structural reasons, benefits, challenges, and future prospects of the USD’s role as the world’s reserve currency, in about 3,000 words.
Historical Evolution of the USD as the Reserve Currency
The Gold Standard and Early Role of the Pound Sterling
Before the USD gained dominance, the British pound sterling served as the world’s reserve currency in the 19th and early 20th centuries. Britain’s colonial empire, its global trade networks, and its financial institutions in London made the pound the anchor of international commerce. The gold standard—where currencies were backed by physical gold—strengthened this system.
The Bretton Woods Agreement (1944)
The turning point for the dollar came during World War II. In 1944, the Bretton Woods Conference established the USD as the central currency of the international monetary system. The U.S. held the largest gold reserves in the world, and the USD was pegged to gold at $35 per ounce. Other currencies were pegged to the dollar, effectively making it the reference currency for global trade.
The Nixon Shock and Petrodollar System (1971–1973)
In 1971, President Richard Nixon ended the gold convertibility of the USD due to mounting fiscal deficits and inflation, marking the collapse of the Bretton Woods system. Despite this, the dollar retained its dominance. The U.S. secured agreements with oil-producing nations, particularly Saudi Arabia, to price and sell oil exclusively in dollars. This "petrodollar system" ensured continuous global demand for the USD, as all countries needed dollars to buy oil and other key commodities.
Modern Era of Dollar Dominance
From the 1980s to today, the dollar’s dominance has been reinforced by the size of the U.S. economy, deep financial markets, political stability, and the central role of American institutions like the Federal Reserve. Even during global crises—the 2008 financial crisis, the COVID-19 pandemic, or wars—investors flock to the dollar as a "safe haven" asset.
Why the USD Became the World Reserve Currency
Several structural factors explain why the USD became and has remained the world’s reserve currency:
Economic Size
The United States has been the largest or one of the largest economies in the world since the 20th century. Its vast production capacity, innovation, and consumer demand created a natural foundation for its currency to dominate.
Military and Political Power
U.S. military strength and its geopolitical influence underpin global trust in the dollar. Nations accept and hold dollars partly because of the stability of the U.S. government and its role as a guarantor of global security.
Financial Market Depth and Liquidity
The U.S. Treasury market is the largest, most liquid bond market in the world. Foreign governments and investors can easily buy and sell U.S. government securities, making the dollar a practical choice for reserves.
Network Effects
Once a currency is widely adopted, it becomes self-reinforcing. The more countries and corporations use the dollar, the more others are incentivized to do the same to reduce transaction costs and risks.
Petrodollar and Commodity Pricing
Since key global commodities such as oil, gold, and agricultural products are priced in dollars, nations must hold USD reserves to trade effectively.
Trust in U.S. Institutions
The Federal Reserve, U.S. Treasury, and American legal system are viewed as relatively transparent, stable, and reliable compared to many alternatives.
Functions of the USD in the Global Economy
The dollar plays multiple roles in the global financial architecture:
Reserve Currency for Central Banks
Central banks hold USD reserves to stabilize their own currencies, intervene in foreign exchange markets, and maintain confidence in their financial systems.
Medium of International Trade
More than 80% of trade in goods and services is invoiced in dollars. Even when trade does not involve the U.S., counterparties often prefer dollar settlement.
Anchor Currency for Exchange Rates
Many countries peg their currencies to the dollar, either formally (currency boards) or informally, to ensure stability in trade and investment.
Safe-Haven Asset
In times of global crisis or uncertainty, investors and governments buy U.S. dollars and Treasuries, considering them safer than other assets.
Investment Currency
Global investors prefer dollar-denominated assets, from U.S. bonds to equities, given their liquidity and returns.
Debt and Loan Currency
A significant share of global debt—sovereign, corporate, and private—is denominated in dollars, meaning borrowers worldwide rely on USD liquidity.
Benefits of USD Dominance
For the United States
“Exorbitant Privilege”
Coined by French Finance Minister Valéry Giscard d’Estaing, this phrase highlights America’s ability to borrow cheaply because of high global demand for its currency.
Low Borrowing Costs
The U.S. government can run larger fiscal deficits as the world consistently buys U.S. Treasury bonds.
Influence Over Global Finance
The U.S. can use its currency dominance to impose economic sanctions, monitor capital flows, and shape international institutions.
Resilience During Crises
Global capital flows into the U.S. during crises, strengthening the dollar and reducing the risk of capital flight.
For the Global Economy
Stability in Trade and Finance
Having a dominant currency reduces uncertainty and exchange rate risk in global transactions.
Liquidity and Access
Dollar markets provide unmatched liquidity, making it easier for countries and companies to trade and borrow.
Benchmarking and Pricing
Commodities, financial contracts, and international investments are priced in USD, creating uniform standards.
Challenges and Criticisms of Dollar Dominance
Despite its advantages, the dollar’s dominance has drawbacks:
Global Dependence and Imbalances
The world’s reliance on the dollar forces other nations to accumulate large reserves, often leading to trade imbalances.
Vulnerability to U.S. Policies
When the Federal Reserve changes interest rates, it affects not only the U.S. but also emerging economies, which may face capital flight, currency depreciation, or debt crises.
Weaponization of the Dollar
The U.S. uses the dollar system for sanctions against countries like Iran, Russia, and Venezuela. Critics argue this undermines trust and pushes nations to seek alternatives.
Triffin Dilemma
Belgian economist Robert Triffin pointed out that for the dollar to serve global demand, the U.S. must run persistent deficits, which eventually erode confidence in its currency.
Inflation Export
By printing more dollars to fund its deficits, the U.S. can indirectly export inflation to other countries holding dollar reserves.
Rise of Alternatives
The euro, Chinese yuan, gold, and even cryptocurrencies are increasingly seen as potential challengers to dollar dominance.
Alternatives to the USD
Euro (EUR)
Accounts for about 20% of global reserves. The eurozone is economically strong, but political fragmentation and sovereign debt crises weaken confidence.
Chinese Yuan (CNY / RMB)
China is pushing the yuan for trade settlement, especially under the Belt and Road Initiative. However, capital controls and lack of transparency limit its role.
Gold
Some countries are returning to gold as a hedge against dollar risk. Central banks, especially in emerging markets, are increasing gold reserves.
Cryptocurrencies and Digital Assets
Bitcoin and stablecoins are sometimes used for cross-border payments, but volatility and regulatory uncertainty limit adoption.
Special Drawing Rights (SDRs)
The IMF’s SDR, a basket of currencies, is designed as an alternative reserve asset, but it remains marginal in actual trade.
Future of the USD as Reserve Currency
The USD remains dominant, but challenges to its supremacy are growing. Possible scenarios include:
Continued Dominance
The dollar remains the world’s primary reserve currency due to inertia, trust, and unmatched liquidity.
Multipolar Currency System
A gradual shift where the euro, yuan, and other currencies share reserve roles alongside the dollar.
Fragmented Financial Order
Increased use of regional currencies or digital alternatives, particularly in response to U.S. sanctions.
Digital Dollar Revolution
The introduction of a U.S. central bank digital currency (CBDC) could reinforce the dollar’s global role by modernizing cross-border transactions.
Conclusion
The U.S. dollar’s role as the world reserve currency is a cornerstone of the modern global economy. It provides stability, liquidity, and efficiency in trade and finance, while granting the U.S. significant economic and geopolitical leverage. However, this dominance is not unchallenged. Structural imbalances, overreliance, and the rise of alternatives point toward a future where the dollar may face stronger competition.
Yet, for now, no other currency matches the dollar’s unique combination of trust, liquidity, and institutional support. The world remains deeply invested in the greenback, making it likely that the USD will continue to dominate global reserves and trade in the foreseeable future, albeit in a gradually more multipolar system.

Silver, Platinum & Precious Metals Market1. Introduction
Precious metals such as silver, platinum, gold, and palladium have fascinated humanity for centuries. They hold cultural, monetary, and industrial importance that makes them unique in the global economy. Unlike common metals such as iron, aluminum, or copper, precious metals are rare, valuable, and often used as a store of wealth. They also play a crucial role in industries ranging from jewelry to electronics, automotive, renewable energy, and even healthcare.
Among these, silver and platinum stand out as vital markets in their own right. While gold typically dominates headlines as the “safe-haven asset,” silver and platinum are equally influential because they serve dual roles—as investment assets and essential industrial commodities. Their prices, supply-demand dynamics, and market structures are influenced by both economic conditions and technological advancements.
This essay will explore the global market for silver, platinum, and other precious metals, focusing on their historical evolution, supply-demand factors, industrial applications, investment value, geopolitical dynamics, and future outlook.
2. Historical Significance of Precious Metals
2.1 Silver
Silver has been used for thousands of years as a currency, in jewelry, and for ceremonial purposes. Ancient civilizations, including the Greeks, Romans, and Egyptians, valued silver coins for trade. In medieval Europe, silver played a role in shaping international commerce through the Spanish “pieces of eight” minted from silver mined in South America.
2.2 Platinum
Platinum was discovered later than gold and silver. Indigenous South American tribes used platinum in jewelry as early as 1200 AD, but it wasn’t until the 18th century that it gained recognition in Europe. Due to its high melting point and resistance to tarnish, platinum became associated with luxury, prestige, and industrial innovation.
2.3 Broader Precious Metals
Other precious metals like palladium, rhodium, and iridium have also gained prominence due to their industrial and catalytic uses, especially in the automotive and clean energy sectors.
3. Supply Side of Precious Metals
3.1 Mining & Production
Silver: The majority of silver is produced as a by-product of mining other metals such as copper, gold, lead, and zinc. Major producers include Mexico, Peru, China, Chile, and Russia.
Platinum: Platinum group metals (PGMs) are found mainly in South Africa, which accounts for around 70% of global supply, followed by Russia, Zimbabwe, and North America. Mining is capital-intensive and often subject to political and labor disruptions.
3.2 Recycling
Both silver and platinum are extensively recycled.
Silver recycling comes mainly from photographic films (now declining), electronics, and jewelry.
Platinum recycling is significant in the auto industry, particularly from catalytic converters in vehicles.
3.3 Geopolitical Risks
Supply is concentrated in a few countries, which makes the market sensitive to political instability, strikes, sanctions, and trade restrictions. For example:
South Africa’s mining strikes often disrupt platinum supply.
Russian sanctions have impacted palladium and platinum exports.
4. Demand Side of Precious Metals
4.1 Investment Demand
Investors buy silver and platinum in the form of:
Coins and bars
Exchange-traded funds (ETFs)
Futures and options contracts
During times of inflation, currency devaluation, or geopolitical uncertainty, demand rises as investors seek safe-haven assets.
4.2 Jewelry Demand
Silver: Affordable and widely used in ornaments worldwide, especially in India and China.
Platinum: Associated with luxury and exclusivity, favored in high-end jewelry markets like Japan, the US, and Europe.
4.3 Industrial Demand
This is where silver and platinum truly stand out from gold:
Silver: Essential in electronics, solar panels, batteries, and medical applications due to its conductivity and antibacterial properties.
Platinum: Used in catalytic converters, fuel cells, medical devices, and chemical processing.
4.4 Emerging Technologies
Silver demand is rising due to green energy (solar PV cells, EV batteries).
Platinum demand is expanding due to hydrogen fuel cells and decarbonization trends.
5. Price Dynamics
5.1 Factors Influencing Prices
Macroeconomic conditions: Inflation, interest rates, and currency strength (especially the US Dollar).
Industrial cycles: Tech advancements and auto sector demand strongly influence silver and platinum.
Geopolitical events: Wars, sanctions, and mining strikes cause price spikes.
Investor sentiment: Market perception of economic uncertainty drives safe-haven demand.
5.2 Volatility
Silver is historically more volatile than gold because of its dual role (investment + industrial). Platinum prices are highly cyclical, linked to auto and manufacturing sectors.
6. Silver Market in Detail
6.1 Global Silver Reserves
Estimated global reserves: ~530,000 metric tons.
Major miners: Fresnillo (Mexico), KGHM (Poland), Glencore (Switzerland), Pan American Silver (Canada).
6.2 Industrial Usage
Electronics: Smartphones, 5G equipment, circuit boards.
Solar Energy: Photovoltaic panels account for over 10% of silver demand and rising.
Medicine: Antibacterial coatings, surgical tools, wound dressings.
Batteries & EVs: Silver paste improves conductivity in modern batteries.
6.3 Investment Trends
Silver ETFs like iShares Silver Trust (SLV) attract large capital inflows. Physical silver coins such as the American Silver Eagle and Canadian Maple Leaf are popular among retail investors.
7. Platinum Market in Detail
7.1 Global Platinum Reserves
Concentrated in South Africa’s Bushveld Complex and Russia.
Major companies: Anglo American Platinum, Impala Platinum, Norilsk Nickel.
7.2 Industrial Usage
Catalytic Converters: Critical in reducing vehicle emissions.
Fuel Cells: Platinum is a core catalyst in hydrogen fuel cell vehicles.
Jewelry: Particularly popular in Asia and Western luxury markets.
Medical Applications: Stents, pacemakers, anti-cancer drugs.
7.3 Market Challenges
Dependence on South Africa creates supply risk.
Competition from palladium in catalytic converters.
Transition to electric vehicles (EVs) may reduce demand for platinum in traditional auto markets, though hydrogen fuel cells could offset this.
8. Other Precious Metals Worth Noting
Palladium: Used in catalytic converters, often more expensive than platinum.
Rhodium: Scarce and extremely valuable, also used in emissions control.
Iridium & Ruthenium: Used in electronics, alloys, and chemical catalysts.
9. Role in Global Financial System
9.1 Safe-Haven Asset
During crises (e.g., 2008 financial crash, COVID-19 pandemic, geopolitical conflicts), investors flock to precious metals as protection against inflation and market instability.
9.2 Central Banks
Unlike gold, silver and platinum are not majorly held in central bank reserves. However, their role in private investment portfolios is rising.
10. Future Outlook
10.1 Silver
Growth in green energy (solar, EV batteries) is expected to boost demand.
Increasing use in electronics and medical tech will support prices.
Long-term investment appeal remains strong, though volatility will persist.
10.2 Platinum
Growth in hydrogen economy is the biggest opportunity.
Jewelry demand may grow in Asia, though automotive demand faces structural shifts with EVs.
Supply risks in South Africa could drive periodic price spikes.
10.3 Broader Precious Metals
The transition to a low-carbon economy is expected to keep demand high for platinum group metals (PGMs) and silver. Scarcity and recycling efficiency will shape market stability.
Conclusion
The silver, platinum, and precious metals market is a fascinating mix of luxury, technology, and geopolitics. Unlike gold, which is primarily an investment vehicle, silver and platinum straddle both worlds—acting as a hedge against inflation while also being indispensable for modern industries.
In the decades ahead, climate change policies, green energy adoption, and technological breakthroughs will reshape demand patterns. Silver will thrive with solar and electronics, while platinum’s future will depend heavily on hydrogen fuel cells and sustainable industries.
For investors, traders, and policymakers, understanding these dual roles is crucial. Precious metals are not just shiny relics of the past—they are strategic resources of the future.

Gold as a Global Safe-Haven AssetIntroduction
For thousands of years, gold has been a symbol of wealth, power, and stability. Ancient civilizations revered it not only for its rarity and beauty but also for its enduring value. Even as societies transitioned from barter to currency systems, gold retained its position as a universal medium of exchange. In today’s modern financial world, gold is no longer the backbone of currencies, yet it continues to play a critical role in global markets as a safe-haven asset.
A safe-haven asset is one that investors flock to during times of uncertainty, geopolitical tension, economic instability, or market volatility. Gold’s historical resilience, universal acceptance, and scarcity make it uniquely positioned to serve this function. This article explores the evolution of gold as a global safe-haven, its role in modern markets, factors driving its value, comparisons with other assets, and its future relevance.
1. Historical Perspective: Gold as the Original Money
1.1 Ancient Civilizations and Gold’s Role
Gold has been valued since the dawn of civilization. The Egyptians, Greeks, and Romans all considered gold a symbol of divine connection and material wealth. Egyptian pharaohs were buried with golden treasures, while Roman coins often contained gold to reinforce trust in their value.
1.2 The Gold Standard
In the 19th and early 20th centuries, many nations adopted the gold standard, linking their currencies directly to gold. This system provided a stable monetary framework, ensuring that paper money could be exchanged for physical gold. The gold standard brought trust and predictability to international trade.
1.3 End of the Gold Standard and Fiat Currency
In 1971, U.S. President Richard Nixon ended the dollar’s convertibility to gold, effectively dismantling the Bretton Woods system. This marked the beginning of the fiat currency era, where money’s value depends on government regulation rather than direct ties to precious metals. Despite this shift, gold did not lose its appeal. Instead, it evolved into a hedge against fiat currency volatility.
2. Gold as a Safe-Haven Asset
2.1 Defining a Safe-Haven Asset
A safe-haven asset retains or increases its value during times of financial turmoil. Investors turn to safe havens to protect their wealth from systemic risks such as inflation, currency devaluation, wars, pandemics, or stock market crashes.
2.2 Why Gold Qualifies
Gold has consistently shown resilience during uncertain times. Unlike stocks, it is not tied to corporate earnings. Unlike bonds, it is not dependent on government debt or interest rates. Its limited supply and intrinsic value make it an effective hedge.
2.3 Universality of Gold
Gold is recognized globally, making it universally liquid. Unlike real estate or localized assets, gold can be sold or exchanged almost anywhere in the world. This global recognition makes it uniquely positioned as a safe-haven.
3. Economic Factors Supporting Gold’s Role
3.1 Inflation Hedge
One of the primary reasons investors buy gold is its ability to hedge against inflation. When fiat currencies lose value due to rising prices, gold tends to retain purchasing power. For example, during the 1970s, when inflation soared in the U.S., gold prices skyrocketed.
3.2 Currency Weakness and Devaluation
When major currencies, particularly the U.S. dollar, weaken, gold often benefits. Since gold is priced in dollars globally, a weaker dollar makes gold cheaper for international buyers, boosting demand.
3.3 Central Bank Policies
Central banks hold gold reserves as a safeguard against economic shocks. In recent years, countries like China, India, and Russia have significantly increased their gold holdings, signaling its ongoing importance in financial stability.
3.4 Interest Rates
Gold does not generate interest or dividends. However, in times of low or negative real interest rates, holding gold becomes more attractive. When bond yields fail to outpace inflation, investors prefer gold as a store of value.
4. Geopolitical and Market Uncertainty
4.1 Wars and Conflicts
Historically, gold prices have surged during wars and geopolitical conflicts. For example, during the Gulf War, Iraq War, and Russia-Ukraine tensions, gold demand rose as investors sought security.
4.2 Financial Crises
The 2008 Global Financial Crisis highlighted gold’s safe-haven role. As major banks collapsed and stock markets crashed, gold prices surged, reaching record highs by 2011.
4.3 Pandemics and Natural Disasters
The COVID-19 pandemic further reinforced gold’s safe-haven appeal. During the uncertainty of 2020, gold touched record highs above $2,000 per ounce.
5. Gold vs Other Safe-Haven Assets
5.1 Gold vs U.S. Dollar
The U.S. dollar is often considered a safe-haven currency. However, unlike gold, its value depends on U.S. economic policies and political stability. Gold, in contrast, is independent of any single government.
5.2 Gold vs Bonds
Government bonds are also safe-haven assets. Yet bonds are vulnerable to inflation and monetary policy. Gold, while non-yielding, is immune to default risks.
5.3 Gold vs Cryptocurrencies
In recent years, Bitcoin has been called “digital gold.” While crypto assets are gaining popularity, they remain highly volatile compared to gold. Gold’s centuries-long trust gives it a more established safe-haven status.
5.4 Gold vs Real Estate
Real estate can preserve wealth but lacks liquidity during crises. Gold can be quickly converted into cash, making it more practical as a short-term safe-haven.
6. Modern Investment Vehicles in Gold
6.1 Physical Gold
Traditional investments include coins, bars, and jewelry. While tangible, physical gold involves storage and security costs.
6.2 Gold ETFs and Mutual Funds
Exchange-traded funds (ETFs) allow investors to gain exposure to gold without holding the physical metal. These are liquid, easily tradable, and track gold prices.
6.3 Gold Mining Stocks
Investors may also invest in companies involved in gold production. While these stocks often follow gold prices, they also carry company-specific risks.
6.4 Central Bank Reserves
Governments continue to hold gold as part of their reserves to strengthen financial credibility and currency stability.
7. Case Studies of Gold as a Safe-Haven
7.1 The 1970s Inflationary Period
When U.S. inflation hit double digits, gold prices increased more than tenfold, proving its resilience against currency devaluation.
7.2 2008 Financial Crisis
Gold rose steadily while global equities collapsed, reaffirming its role in wealth preservation.
7.3 COVID-19 Pandemic
With economies locked down and markets panicked, gold surged past $2,000, reinforcing investor trust.
8. Criticisms and Limitations
8.1 No Yield or Dividend
Gold provides no income, unlike stocks or bonds. This makes it less attractive during strong economic growth phases.
8.2 Price Volatility
Though a safe-haven, gold can be volatile in the short term, influenced by speculative trading and ETF flows.
8.3 Storage and Security
Physical gold requires secure storage, which can add costs and risks.
8.4 Not Always a Perfect Hedge
There are periods when gold does not move in line with crises. For example, during the early stages of the COVID-19 sell-off in March 2020, gold initially fell along with stocks as investors sought liquidity.
9. The Future of Gold as a Safe-Haven
9.1 Central Bank Demand
As emerging economies diversify away from the U.S. dollar, gold is likely to see increasing demand from central banks.
9.2 Role Against Digital Assets
While Bitcoin and other digital assets attract younger investors, gold’s tangible nature and historical trust provide stability that cryptos cannot yet match.
9.3 Climate Change and ESG Investing
As environmental, social, and governance (ESG) investing grows, questions about sustainable gold mining practices could affect its demand.
9.4 Long-Term Outlook
Gold is unlikely to lose its safe-haven appeal in the foreseeable future. In fact, with rising global uncertainties—from inflation risks to geopolitical rivalries—gold’s relevance may even increase.
Conclusion
Gold remains the ultimate safe-haven asset, bridging ancient traditions with modern financial systems. Its ability to preserve wealth, hedge against inflation, and provide stability during uncertainty makes it indispensable to investors, central banks, and nations alike.
While gold has limitations—such as lack of yield and short-term volatility—its universal acceptance and enduring value ensure its continued relevance. Whether facing geopolitical turmoil, financial crises, or inflationary pressures, gold shines as a timeless store of value.
In a rapidly changing financial landscape, where cryptocurrencies, digital assets, and shifting monetary policies reshape investor behavior, gold’s role as a safe-haven asset may evolve but is unlikely to diminish. Just as it has for millennia, gold will continue to serve as a trusted anchor of security in uncertain times.
Cross-Border Listings and Dual-Listed CompaniesIntroduction
In today’s interconnected financial world, companies are no longer confined to raising capital solely in their domestic markets. Increasing globalization, advancements in technology, and integration of capital markets have paved the way for businesses to list their shares beyond their home country. Two significant strategies that companies adopt to tap international investors are cross-border listings and dual listings.
A cross-border listing occurs when a company lists its equity shares on a stock exchange outside its home country. For example, Alibaba, a Chinese company, listing its shares on the New York Stock Exchange (NYSE) in 2014 is a classic case of cross-border listing.
On the other hand, a dual listing (sometimes called a "dual-listed company" or DLC structure) is when a company is simultaneously listed on two stock exchanges, usually in different countries, and both sets of shares represent the same ownership rights. For instance, Royal Dutch Shell historically operated under a dual-listed structure between the UK and the Netherlands before unifying in 2022.
This essay explores the concepts of cross-border listings and dual-listed companies in detail, analyzing motivations, processes, challenges, advantages, risks, case studies, and their broader impact on global capital markets.
Part 1: Understanding Cross-Border Listings
What is a Cross-Border Listing?
A cross-border listing refers to the practice where a company headquartered in one country seeks to have its shares traded on an exchange in another country, in addition to or instead of its home market. This is often achieved through mechanisms such as:
Direct Listing – where shares are directly listed on the foreign exchange.
Depositary Receipts (DRs) – such as American Depositary Receipts (ADRs) in the U.S. or Global Depositary Receipts (GDRs) in Europe, which represent shares of foreign companies.
Cross-border listings provide visibility, credibility, and access to broader pools of investors.
Motivations for Cross-Border Listings
Access to Larger Capital Pools
Listing on global exchanges like NYSE, NASDAQ, or London Stock Exchange (LSE) allows firms to attract institutional investors and hedge funds that may not invest in emerging or smaller domestic markets.
Enhanced Liquidity
International listings improve trading volumes and reduce bid-ask spreads, providing shareholders with more liquidity.
Prestige and Visibility
Being listed on prestigious exchanges boosts the company’s brand recognition and signals financial strength. For example, many tech companies aim for a U.S. listing for global visibility.
Diversification of Investor Base
Companies can mitigate reliance on a single country’s investor sentiment by tapping into international investors with different risk profiles.
Strategic Expansion
Firms expanding globally may list abroad to strengthen their presence in target markets. For instance, Tata Motors listed ADRs in the U.S. as it acquired Jaguar Land Rover to align with Western investors.
Improved Valuation
Investors in developed markets often assign higher valuations due to better liquidity, lower perceived risk, and stronger corporate governance requirements.
Mechanisms of Cross-Border Listing
American Depositary Receipts (ADRs)
Non-U.S. companies issue ADRs to trade on U.S. exchanges. ADRs are denominated in USD and simplify investment for U.S. investors. Example: Infosys trades as ADRs on NYSE.
Global Depositary Receipts (GDRs)
Used primarily in European and Asian markets, GDRs allow companies to raise funds in multiple regions.
Direct Listings
Companies directly register their ordinary shares in a foreign market.
Secondary Listings
Some companies maintain a primary listing in their home country while pursuing secondary listings abroad.
Advantages of Cross-Border Listings
Cheaper capital costs – Broader investor demand reduces the cost of equity.
Global credibility – Enhanced corporate reputation and international media coverage.
Investor protection perception – Stricter regulatory environments provide comfort to foreign investors.
Potential currency hedging – Raising funds in multiple currencies may help offset forex risks.
Challenges in Cross-Border Listings
Regulatory Burden
Complying with multiple jurisdictions (e.g., U.S. SEC rules like Sarbanes-Oxley Act) can be costly and complex.
Accounting Standards
Firms may need to reconcile financial statements between different accounting standards (e.g., IFRS vs. U.S. GAAP).
Costs
Listing fees, legal advisory costs, auditing, and compliance expenses are significantly higher.
Risk of Overexposure
Greater scrutiny from international investors, analysts, and media can pressure management.
Delisting Risks
If trading volumes are low, foreign exchanges may consider delisting (e.g., Chinese firms facing U.S. delisting threats in 2020–22).
Part 2: Understanding Dual-Listed Companies (DLCs)
What is a Dual Listing?
A dual-listed company structure involves two corporations incorporated in different countries agreeing to function as a single entity for strategic and economic purposes while maintaining separate legal entities. Shares of both companies trade on their respective stock exchanges, but shareholders share common ownership and voting rights.
For example:
Royal Dutch Shell (Netherlands & UK, until 2022).
BHP Group (Australia & UK).
Why Choose Dual Listings?
Market Accessibility
Dual listings allow companies to raise funds simultaneously in multiple regions.
Regulatory Flexibility
Companies may avoid high costs of cross-border compliance by splitting structures.
National Interests
Governments may push for dual listings to protect local investor participation and maintain corporate identity.
Mergers and Acquisitions
Dual structures often arise from cross-border mergers (e.g., BHP and Billiton).
Advantages of Dual-Listed Structures
Equal Treatment of Shareholders
Shareholders in both countries maintain equal economic and voting rights.
Investor Base Expansion
Encourages domestic investors in both regions to invest without currency or foreign-exchange hurdles.
Synergies Without National Loss
Companies retain national identity while operating as one entity, politically acceptable in sensitive sectors.
Strategic Flexibility
Helps maintain listings in home and host countries simultaneously.
Challenges of Dual Listings
Complex Corporate Governance
Coordinating two boards, shareholder meetings, and legal jurisdictions is administratively heavy.
Arbitrage Opportunities
Share prices in both markets may diverge due to currency fluctuations or investor sentiment, inviting arbitrage.
Taxation Complexities
Differing tax regimes can complicate dividend distribution and profit allocation.
Eventual Simplification Pressure
Many DLCs eventually simplify into a single listing due to inefficiencies (e.g., Unilever ended its dual listing in 2020).
Part 3: Cross-Border Listings vs. Dual Listings
Feature Cross-Border Listing Dual-Listed Company
Structure Single entity listed abroad Two entities operating as one
Investor Base International investors Both domestic and foreign investors
Governance Centralized Complex, two boards
Liquidity Concentrated in one market Split between two markets
Examples Alibaba (NYSE), Infosys (NYSE ADRs) BHP (Australia & UK), Shell (UK & NL)
Regulatory Compliance Multiple jurisdictions for one entity Two legal systems, harmonized by agreements
Part 4: Case Studies
Case Study 1: Alibaba’s U.S. Listing (2014)
Alibaba raised $25 billion in its NYSE IPO, the largest in history at the time. The listing gave Alibaba global visibility, access to U.S. investors, and enhanced credibility. However, political tensions and U.S. scrutiny later forced Alibaba to also pursue a dual primary listing in Hong Kong (2019) to hedge regulatory risks.
Case Study 2: Royal Dutch Shell
Shell operated for decades as a dual-listed company with separate UK and Dutch entities. While this allowed national identity retention, it eventually simplified in 2022 into a single UK-based entity to cut administrative costs and simplify dividend taxation. This demonstrates the long-term inefficiencies of DLC structures.
Case Study 3: Infosys ADRs in the U.S.
Infosys pioneered the ADR model among Indian IT firms. By listing on NYSE in 1999, Infosys attracted U.S. institutional investors, boosted transparency through U.S. GAAP compliance, and improved its global brand recognition.
Case Study 4: BHP Billiton Dual Listing
BHP (Australia) and Billiton (UK) merged in 2001 using a dual-listed company structure to respect national interests. The DLC allowed both companies to share profits and operate as one without full legal merger. In 2022, however, BHP simplified by unifying its structure in Australia, citing complexity costs.
Part 5: Impact on Global Capital Markets
Integration of Capital Markets
Cross-border listings and DLCs bring investors from multiple geographies into closer alignment.
Corporate Governance Improvements
To qualify for international listings, companies often adopt stricter governance standards, benefiting shareholders globally.
Capital Flow Diversification
Emerging market companies gain access to developed market capital, reducing dependency on local investors.
Political and Regulatory Frictions
As seen in U.S.-China tensions, foreign listings can become entangled in geopolitical disputes.
Part 6: Future Trends
Rise of Asian Financial Centers
Hong Kong, Singapore, and Shanghai are emerging as attractive alternatives to New York and London.
Technological Advancements
Blockchain-based securities and digital exchanges may redefine how companies pursue cross-border listings.
Regulatory Harmonization
Efforts like the EU’s capital markets union and IFRS adoption may simplify compliance for multinational companies.
Shift Toward Secondary Home Listings
Many firms may adopt secondary listings in home regions (like Alibaba in Hong Kong) as a hedge against foreign political risks.
Conclusion
Cross-border listings and dual-listed companies are powerful mechanisms enabling firms to expand investor bases, access global capital, and enhance international presence. While cross-border listings emphasize visibility and liquidity in foreign markets, dual listings balance political, cultural, and economic interests across nations.
Both models bring opportunities—such as higher valuations and global credibility—and challenges—like regulatory burdens, governance complexity, and geopolitical risks. Over time, trends show that while cross-border listings remain popular, dual-listed structures often simplify into single listings due to inefficiencies.
Ultimately, as capital markets continue to globalize and technology reduces geographic barriers, the future will likely see innovative models of cross-border capital raising that blend the strengths of these existing approaches while minimizing their limitations.
Sustainable FinanceIntroduction
The 21st century has brought not only unprecedented technological growth and globalization but also serious challenges related to climate change, resource depletion, social inequality, and corporate governance failures. In this new era, finance is no longer just about maximizing profits and shareholder value—it must also integrate environmental, social, and governance (ESG) considerations. This movement has given rise to what is now known as Sustainable Finance.
Sustainable finance refers to the process of taking environmental, social, and governance factors into account in investment and financing decisions, with the goal of achieving sustainable economic growth while addressing global challenges such as climate change, inequality, biodiversity loss, and human rights.
It is not merely a trend but a fundamental shift in global capital markets. Trillions of dollars are being allocated into sustainable assets, green bonds, renewable energy projects, and socially responsible businesses. Governments, central banks, regulators, and institutional investors are increasingly recognizing that long-term financial stability and profitability are impossible without considering the sustainability of our planet and society.
This write-up explores sustainable finance in detail—its origins, principles, instruments, challenges, opportunities, and its role in shaping the future of global markets.
1. Origins and Evolution of Sustainable Finance
1.1 Early Concepts
1970s – Rise of Environmental Concerns: The oil crises and growing awareness of pollution sparked initial debates about the environmental impact of economic growth.
1987 – Brundtland Report: Defined sustainable development as “development that meets the needs of the present without compromising the ability of future generations to meet their own needs.” This idea laid the foundation for linking finance with sustainability.
1990s – Socially Responsible Investing (SRI): Investors began excluding tobacco, arms, and polluting industries from their portfolios.
1.2 Modern Development
2000s – ESG Framework Emerges: Environmental, Social, and Governance (ESG) factors became measurable metrics for companies and investors.
2015 – Paris Agreement: Marked a global commitment to limit global warming to below 2°C, leading to a surge in climate-related finance.
2020 onwards – COVID-19 and ESG Surge: The pandemic highlighted social inequalities and resilience, accelerating investor demand for sustainable investments.
Today, sustainable finance has become mainstream, with global sustainable investment exceeding $35 trillion in assets under management (AUM) in 2022.
2. Core Principles of Sustainable Finance
Sustainable finance is built on three pillars, commonly referred to as ESG:
2.1 Environmental (E)
Focuses on how financial decisions impact the planet. Key areas include:
Climate change mitigation and adaptation.
Carbon footprint reduction.
Renewable energy investments.
Efficient use of resources and waste management.
Biodiversity preservation.
2.2 Social (S)
Examines how businesses affect people and communities. Key factors:
Human rights protection.
Fair labor practices and diversity.
Community development.
Consumer protection and product responsibility.
Employee well-being and training.
2.3 Governance (G)
Concerns the way organizations are managed. Important aspects:
Transparency and accountability.
Ethical corporate behavior.
Shareholder rights.
Anti-corruption practices.
Diversity on boards and executive levels.
Together, ESG ensures that finance supports long-term value creation, not just short-term profit maximization.
3. Instruments of Sustainable Finance
Sustainable finance is not theoretical—it is embedded in practical financial products and mechanisms.
3.1 Green Bonds
Bonds specifically issued to finance environmentally friendly projects (renewable energy, energy efficiency, waste management).
Example: The World Bank was among the first issuers of green bonds in 2008.
3.2 Social Bonds
Bonds designed to finance projects with positive social outcomes (affordable housing, healthcare, education).
3.3 Sustainability-Linked Bonds (SLBs)
Interest rates are tied to the issuer’s achievement of sustainability targets (e.g., reducing carbon emissions).
3.4 Green Loans & Sustainability-Linked Loans
Similar to bonds, but structured as loan facilities for corporations, tied to ESG performance.
3.5 ESG Funds and ETFs
Mutual funds and exchange-traded funds that invest in companies with strong ESG performance.
Example: iShares ESG MSCI ETF.
3.6 Impact Investing
Investments made with the intent to generate measurable social and environmental impact alongside financial returns.
3.7 Carbon Markets
Trading systems where carbon credits are bought and sold, incentivizing companies to reduce emissions.
4. Role of Key Stakeholders
4.1 Governments & Regulators
Provide policy frameworks, tax incentives, and regulations.
Examples: EU Sustainable Finance Action Plan, India’s ESG disclosure norms by SEBI.
4.2 Central Banks
Integrating climate risks into monetary policy and financial stability monitoring.
Network for Greening the Financial System (NGFS) includes over 120 central banks.
4.3 Institutional Investors
Pension funds, sovereign wealth funds, and asset managers are pushing companies to adopt ESG.
Example: BlackRock announced sustainability as its new investment standard.
4.4 Corporates
Increasingly adopting ESG reporting and integrating sustainability into strategy.
4.5 Retail Investors
Growing demand for sustainable investment products, especially among millennials and Gen Z.
5. Benefits of Sustainable Finance
5.1 For Investors
Long-term value creation.
Risk mitigation (climate risk, regulatory risk).
Portfolio diversification.
5.2 For Corporates
Access to cheaper capital.
Enhanced brand reputation.
Stronger stakeholder relationships.
5.3 For Society & Environment
Reduced carbon footprint.
Social inclusion and poverty reduction.
Support for green transition and innovation.
6. Challenges in Sustainable Finance
Despite rapid growth, sustainable finance faces significant challenges:
Greenwashing – Companies exaggerating or misrepresenting their sustainability efforts.
Lack of Standardization – Different ESG rating methodologies create confusion.
Data Gaps – Reliable ESG data remains limited, especially in emerging markets.
Short-Termism – Financial markets often prioritize quarterly profits over long-term sustainability.
Transition Risks – Industries such as oil, coal, and gas face sudden devaluations (“stranded assets”).
Balancing Profitability with Purpose – Difficult for firms to maintain competitiveness while investing heavily in ESG initiatives.
7. Global Developments in Sustainable Finance
7.1 Europe
The EU Taxonomy for Sustainable Activities provides a common classification for green activities.
Europe accounts for nearly half of global sustainable investment assets.
7.2 United States
The SEC is tightening climate disclosure requirements.
ESG funds have seen massive inflows, though political debates around ESG are intensifying.
7.3 Asia-Pacific
China is a leader in green bonds issuance.
India has mandated Business Responsibility and Sustainability Reporting (BRSR) for top companies.
7.4 Africa & Latin America
Focus on financing renewable energy and social development.
Growing use of green bonds in countries like Brazil and South Africa.
8. The Future of Sustainable Finance
The trajectory suggests sustainable finance will become the default standard of global finance. Some trends shaping the future include:
Mandatory ESG Disclosures – Regulators worldwide are pushing for standardized ESG reporting.
Technology Integration – Use of AI, blockchain, and big data for ESG tracking and green finance.
Climate Stress Tests – Banks and financial institutions will increasingly assess climate risks.
Rise of Transition Finance – Helping carbon-intensive industries gradually shift to greener models.
Sustainable FinTech – Digital platforms offering sustainable investment products to retail investors.
Global South Integration – Mobilizing sustainable capital to developing nations, where the impact is most needed.
9. Case Studies
Case 1: Tesla and Sustainable Investment
Tesla became one of the most popular ESG stocks due to its role in accelerating the transition to electric vehicles, despite controversies around governance. It highlights how investors prioritize innovation in climate-friendly technologies.
Case 2: World Bank Green Bonds
Since 2008, the World Bank has issued over $18 billion in green bonds, funding projects in renewable energy, waste management, and sustainable agriculture.
Case 3: India’s Green Finance Push
India launched its first sovereign green bonds in 2023 to finance clean energy and transport infrastructure, a milestone in emerging market sustainable finance.
10. Conclusion
Sustainable finance is not a passing trend but a structural transformation of global financial systems. It recognizes that long-term profitability cannot exist in isolation from environmental stability and social well-being.
While challenges like greenwashing, inconsistent standards, and short-termism remain, the momentum is strong. Governments, corporates, and investors increasingly understand that aligning finance with sustainability is essential for future resilience.
In the coming decade, sustainable finance will shape capital flows, redefine corporate strategies, and empower individuals to invest not just for profit, but for people and planet.
Sustainable finance represents a new social contract for global capital—one where economic growth is pursued alongside ecological balance and social justice.

Technology & AI-driven DisruptionIntroduction
Technology has always been at the heart of human progress. From the discovery of fire and the invention of the wheel to the printing press, electricity, and the internet, every leap in technology has disrupted the way societies live, work, and interact. Today, however, we stand at the edge of an even more powerful revolution: Artificial Intelligence (AI) and technology-driven disruption.
AI is no longer a futuristic concept confined to science fiction. It has moved into the real world, powering search engines, social media feeds, self-driving cars, voice assistants, financial markets, healthcare innovations, and much more. Alongside AI, other technologies—such as cloud computing, blockchain, robotics, biotechnology, and quantum computing—are accelerating disruption at a pace never seen before.
This disruption is reshaping industries, redefining work, changing economic structures, raising ethical questions, and transforming the global balance of power. In this detailed discussion, we will explore what technology-driven disruption is, how AI amplifies it, the sectors most affected, opportunities and risks, and what the future might look like in a world where machines learn, adapt, and act alongside humans.
1. Understanding Disruption
1.1 What is Disruption?
Disruption means a fundamental shift that changes how businesses, economies, and societies function. Unlike gradual improvement (known as incremental innovation), disruption often replaces old ways with entirely new systems. For example:
The rise of Netflix disrupted DVD rentals and television broadcasting.
Uber disrupted traditional taxi industries.
E-commerce disrupted brick-and-mortar retail.
Disruption doesn’t just make things more efficient; it redefines industries, eliminates outdated models, and creates entirely new ecosystems.
1.2 The Role of Technology in Disruption
Technology is the engine behind most disruptions. Some key enablers include:
Automation: Machines replacing manual labor.
Connectivity: The internet linking people, devices, and businesses.
Data: The new "oil" powering insights and decisions.
AI & Machine Learning: Systems that can analyze, learn, and act.
Together, these forces create waves of change that affect every aspect of life.
2. Artificial Intelligence as a Catalyst
AI is the single most powerful driver of disruption today. Let’s break down why:
2.1 What is AI?
AI refers to systems that simulate human intelligence. Key capabilities include:
Machine Learning (ML): Systems that learn from data.
Natural Language Processing (NLP): Understanding and generating human language (e.g., ChatGPT).
Computer Vision: Recognizing and interpreting visual information (e.g., facial recognition).
Robotics & Autonomous Systems: Machines capable of independent actions.
2.2 Why is AI Disruptive?
AI is disruptive because it:
Scales knowledge work: Unlike traditional machines that replaced physical labor, AI disrupts intellectual and decision-making work.
Accelerates speed: AI can analyze millions of data points in seconds, far beyond human capability.
Continuously learns: Unlike fixed machines, AI evolves with data, making it adaptable.
Reduces cost: Once trained, AI systems can perform tasks at a fraction of human cost.
This means AI is not just another tool—it’s a force multiplier that reshapes industries.
3. Key Areas of Technology & AI-driven Disruption
3.1 Business & Industry Transformation
Retail & E-commerce: AI-driven personalization, chatbots, and recommendation systems are redefining how we shop.
Banking & Finance: Robo-advisors, algorithmic trading, fraud detection, and blockchain-based transactions are automating financial ecosystems.
Healthcare: AI diagnostics, drug discovery, robotic surgery, and telemedicine improve speed and accuracy in treatment.
Manufacturing: Smart factories powered by AI, robotics, and IoT create Industry 4.0.
Agriculture: AI-based sensors, drones, and predictive analytics optimize crop yields.
3.2 The Future of Work
One of the most visible disruptions is in employment. AI and automation are replacing repetitive, routine jobs—from data entry to factory work—while creating new roles in AI engineering, data science, and digital strategy.
Jobs at risk: clerical, call centers, logistics, and even some aspects of law and accounting.
Jobs created: AI trainers, robotic engineers, AI ethicists, prompt engineers, and more.
Skills required: digital literacy, critical thinking, adaptability, creativity, and collaboration.
3.3 Education & Learning
AI-powered learning platforms (like adaptive e-learning apps) tailor education to individual needs. Traditional "one-size-fits-all" teaching is being replaced by personalized pathways. Virtual classrooms and AI tutors make global, affordable learning possible.
3.4 Transportation & Mobility
Autonomous vehicles, drones, and AI-powered logistics are disrupting transportation. For example:
Tesla and Waymo with self-driving cars.
Amazon and Zipline with drone deliveries.
Smart traffic systems reducing congestion and emissions.
3.5 Media & Entertainment
AI-generated content, personalized recommendations (like YouTube/Netflix), and deepfake technology are redefining how content is created and consumed. Music, film production, and gaming industries are heavily influenced by AI creativity tools.
3.6 Government & Public Policy
Governments are using AI for surveillance, smart city planning, disaster management, and public service delivery. However, this raises ethical debates about privacy and authoritarian control.
4. Opportunities Created by Technology & AI Disruption
Despite fears of job losses, disruption opens enormous opportunities:
Productivity Boost: AI automates routine tasks, allowing humans to focus on creativity and strategy.
Economic Growth: New industries (AI development, space tech, renewable energy) generate trillions in value.
Healthcare Advancements: Early disease detection and personalized medicine save lives.
Environmental Benefits: AI-driven energy optimization and smart agriculture reduce carbon footprints.
Financial Inclusion: Fintech powered by AI enables access to banking in remote areas.
5. Challenges and Risks
With great power comes great responsibility. AI-driven disruption also brings risks:
5.1 Job Displacement
Millions of traditional jobs may vanish. While new roles will be created, not all displaced workers can easily transition.
5.2 Bias & Inequality
AI is only as fair as the data it learns from. If biased data is used, AI can reinforce discrimination (e.g., in hiring or lending).
5.3 Privacy Concerns
AI relies on vast amounts of personal data, raising concerns about surveillance, misuse, and cybercrime.
5.4 Ethical Dilemmas
Should AI be allowed in weapons? Should machines make life-or-death decisions (e.g., in healthcare or self-driving cars)?
5.5 Concentration of Power
AI and big tech are concentrated in a few companies (Google, Microsoft, Amazon, Baidu, etc.), creating risks of monopoly and geopolitical tensions.
6. The Future of AI-driven Disruption
The next decade will see disruption accelerate. Some key trends:
Generative AI: Creating text, images, videos, and even software (already transforming creativity and coding).
Quantum Computing: Super-fast calculations that could revolutionize AI and cryptography.
Brain-Computer Interfaces: Direct communication between humans and machines.
Decentralization via Blockchain: AI + blockchain creating transparent, autonomous systems.
Sustainability Tech: AI applied to climate change, renewable energy, and environmental protection.
7. How to Adapt and Thrive
For individuals, businesses, and governments, adapting is key.
For Individuals: Learn continuously, focus on creativity, adaptability, and tech literacy.
For Businesses: Embrace AI, but also prioritize ethics, transparency, and human-centered design.
For Governments: Create policies that balance innovation with safety, reskilling programs, and fair regulation of big tech.
8. Conclusion
Technology and AI-driven disruption is not a passing trend—it is the defining transformation of our era. Just as electricity and the internet reshaped the 20th century, AI will reshape the 21st. It is both an opportunity and a challenge: a tool that can empower humanity or deepen inequalities, depending on how we use it.
The world must navigate this disruption with wisdom. We must ask not only what AI can do, but also what it should do. The goal should not be man versus machine but man with machine, where technology amplifies human potential while respecting human values.
The story of disruption is still being written, and the choices we make today will define the future of work, economies, and societies. The challenge is enormous, but so is the opportunity.

USD Weakness Fuels EUR/USD Recovery – Key Levels to WatchThe US Dollar is showing renewed weakness, and major pairs are gaining momentum in response. EUR/USD, in particular, is setting up for a potential bullish continuation after retesting a key liquidity zone.
📊 Technical Outlook (H2 Chart):
Price has retested the 1.1619 liquidity zone, holding above the sell-side liquidity at 1.1602.
This creates a foundation for a possible upside push.
If bullish momentum continues, watch for:
1.1701 → first resistance.
1.1722 → stronger supply zone.
1.1743 → key buy-side liquidity target.
👉 Scenarios to keep in mind:
1️⃣ If 1.1619 holds as support, buyers could drive price toward 1.1722 – 1.1743.
2️⃣ A break back below 1.1602 would invalidate the bullish setup and expose deeper downside.
⚡ Key Takeaway:
USD weakness is providing tailwinds for majors – EUR/USD is aligning with this broader trend. Traders should focus on liquidity zones and wait for confirmation before committing to entries.
🔥 Will EUR/USD build momentum toward 1.1743, or will sellers defend resistance?
👇 Share your thoughts in the comments!

BTCUSD SCALP Bitcoin scalp,I will be following the trend and keeping it simple with no indicators used for all these trades, will keep taking profits
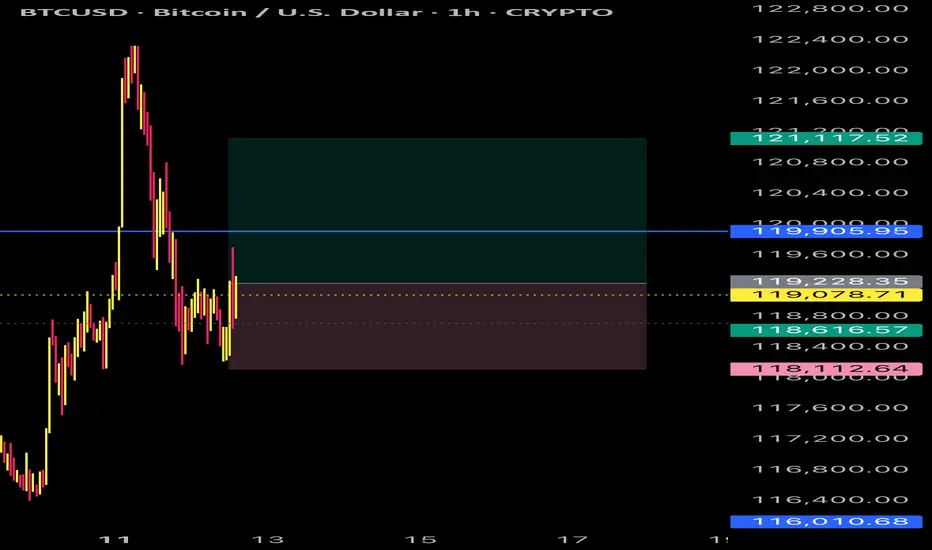
XAUUSD GOLD BUYS Gold hit all take profits and now will be taking more trades into the correct direction for the rest of the trend , keep the trading simple and straightforward

EURJPY BUYS BLUEThis pair has responded positively to the analysis of the recent post and it has now hit take profit perfectly with minimum drawdown

EUR/USD Lots of bull flags formed on the recent chart. Buy/Long Lots of bull flags on this chart which confirmed a move to the upside.
Waiting for a little pullback to the 20MA before considering a buy long order
Waiting to see if this small bear flag forms.
A very interesting instrument to watch at the moment. Full of various signals.

EUR/USD Forecast – Bears in Control Ahead of US Jobless DataEUR/USD Forecast – Bears in Control Ahead of US Jobless Data
🌐 Macro View: Dollar Regains Strength Amid Uncertainty
EUR/USD remains under selling pressure as the greenback finds renewed strength following midweek weakness. The market is bracing for fresh U.S. jobless claims data, expected to show a slight rise to 235K. A print below 220K could reignite USD demand, while a surprise above 240K may offer a temporary lifeline for the euro.
Amid geopolitical and economic turbulence, the euro continues to underperform as investors shift to the dollar for safety and yield advantage.
📉 Technical Outlook – MMF & Smart Money Perspective
The recent breakdown below 1.1600 confirms the bearish momentum. Based on the MMF (Market Momentum Flow) methodology, price action is currently moving within a controlled distribution structure, suggesting further downside potential.
Key zones identified from H1 structure:
OBS + FVG High Zone (1.1662 – 1.1687): Strong supply zone + volume imbalance.
1.1637: Mid-key level and possible liquidity magnet.
1.1616 – 1.1573: Ideal area for sweeping sell-side liquidity before any sustainable bounce.
If price reclaims 1.1662, intraday bullish correction may be in play. However, as long as 1.1687 holds, bears remain in control.
🧭 Trade Plan for Today
🔴 SELL ZONE: 1.1662 – 1.1687 (FVG + OBS Volume Zone)
SL: 1.1710
TP: 1.1637 → 1.1616 → 1.1590 → 1.1573
✅ Preferred entry zone aligned with high-volume imbalance & MMF rejection pattern.
🟢 BUY ZONE (Scalp Only): 1.1575 – 1.1580 (Sell-side Liquidity Zone)
SL: 1.1550
TP: 1.1612 → 1.1630 → 1.1645
⚠️ Use with caution — only upon clear price reaction at lower liquidity sweep area.
🔍 Strategy Insight
This is a classic scenario of a controlled pullback within a larger bearish structure. Patience is key — let price tap into imbalanced zones before executing. Given today's U.S. data, volatility may spike during the New York session, so risk management is crucial.
💬 What’s Your Take?
Do you expect EUR/USD to retest the 1.1550s zone, or could a surprise from U.S. job data flip the narrative?
👇 Drop your analysis below & follow for more MMF-based setups.
EURUSD. The plan for the next few days.The nearest resistance zones are where it's interesting to look for purchases. We are waiting for a reaction and looking for an entry point.
The post will be adjusted if there are any changes.
Don't forget to click on the Rocket! =)

GBP/CAD (Two Trade Recaps) EUR/NZD Long and GBP/JPY LongEUR/NZD Long
Minimum entry requirements:
- If tight non-structured 15 min continuation forms, 5 min risk entry within it if the continuation is structured on the 5 min chart or reduced risk entry on the break of it.
- If tight structured 15 min continuation forms, reduced risk entry on the break of it or 15 min risk entry within it.
- If tight non-structured 1H continuation forms, 15 min risk entry within it if the continuation is structured on the 15 min chart or reduced risk entry on the break of it.
- If tight structured 1H continuation forms, 1H risk entry within it or reduced risk entry on the break of it.
GBP/JPY Long
Minimum entry requirements:
- Tap into area of value.
- 1H impulse up above area of value.
- If tight non-structured 15 min continuation follows, 5 min risk entry within it if the continuation is structured on the 5 min chart or reduced risk entry on the break of it.
- If tight structured 15 min continuation follows, reduced risk entry on the break of it or 15 min risk entry within it.

EUR/AUD Short, EUR/NZD Short, NZD/USD Long and AUD/NZD ShortEUR/AUD Short
Minimum entry requirements:
- If tight non-structured 1H continuation forms, 15 min risk entry within it if the continuation is structured on the 15 min chart or reduced risk entry on the break of it.
- If tight structured 1H continuation forms, 1H risk entry within it or reduced risk entry on the break of it.
EUR/NZD Short
Minimum entry requirements:
- If tight non-structured 1H continuation forms, 15 min risk entry within it if the continuation is structured on the 15 min chart or reduced risk entry on the break of it.
- If tight structured 1H continuation forms, 1H risk entry within it or reduced risk entry on the break of it.
NZD/USD Long
Minimum entry requirements:
- If tight non-structured 1H continuation forms, 15 min risk entry within it if the continuation is structured on the 15 min chart.
- If tight structured 1H continuation forms, 1H risk entry within it.
AUD/NZD Short
Minimum entry requirements:
- If tight non-structured 1H continuation forms, 15 min risk entry within it if the continuation is structured on the 15 min chart.
- If tight structured 1H continuation forms, 1H risk entry within it.

EUR/AUD ShortEUR/AUD Short
Minimum entry requirements:
- 1H impulse down below area of interest.
- If tight non-structured 5 min continuation follows, reduced risk entry on the break of it.
- If tight structured 5 min continuation follows, reduced risk entry on the break of it or 5 min risk entry within it.
- If tight non-structured 15 min continuation follows, 5 min risk entry within it if the continuation is structured on the 5 min chart or reduced risk entry on the break of it.
- If tight structured 15 min continuation follows, reduced risk entry on the break of it or 15 min risk entry within it.

Trading at the Market OpenTrading at the Market Open
The market open marks a critical juncture in the financial world, presenting a unique blend of opportunities and challenges for traders. This article explores the essence of trading at the open across stocks, forex, and commodities. It delves into the heightened volatility and liquidity characteristic of this period, offering insights and strategies to navigate these early market hours effectively, setting the stage for trading opportunities.
What Does the Open Mean in Stocks, Forex, and Commodities?
The open signifies the start of the trading day for various financial markets. It's a time when trading activity surges, marked by a rush of orders that have accumulated since the previous close. In stock markets, this includes shares, indices, and Exchange-Traded Funds (ETFs). The influx of orders often leads to significant price movements as the market absorbs overnight news and global economic developments.
For forex and commodity markets, the open can vary by region, reflecting their 24-hour nature. This period is crucial for setting the tone of the trading day, offering insights into sentiment and potential trends. Traders closely watch the market open to gauge the strength of these movements, which can indicate broader market trends or sector-specific shifts.
Volatility and Liquidity at Market Open
Trading at the open is often marked by enhanced volatility and liquidity. Heightened volatility is primarily due to the influx of orders accumulated overnight, reacting to various global events and news. As traders and investors assimilate this information, rapid price movements are common, especially in the first few minutes of the session. These price fluctuations can present both opportunities and risks for traders.
Increased liquidity, which refers to the ease with which assets can be bought or sold without causing significant price movements, is also a characteristic of the open. A higher number of market participants during this period may result in better order execution and tighter bid-ask spreads, particularly in highly liquid markets like forex and major stock indices.
What to Know Before the Market Opens
In terms of things to know before the stock market opens, it's essential to review the overnight and early morning news that can affect stocks. This includes company earnings reports, economic data releases, and geopolitical events. Traders also check pre-market trading activity to gauge sentiment and potential opening price movements.
For forex and commodities, understanding global events is crucial. Developments in different time zones, like policy changes by central banks or shifts in political scenarios, can significantly impact these markets. Additionally, reviewing the performance of international markets can provide insights, as they often influence the US open.
It's also vital to analyse futures markets, as they can indicate how stock indices might open. Lastly, around the forex, commodity, and stock market openings, indicators and other technical analysis tools applied to the previous day can also offer valuable context for the day ahead.
Market Open in Different Time Zones
Market open times vary globally due to different time zones, significantly impacting trading strategies. For instance, the New York Stock Exchange (NYSE) opens at 9:30 AM Eastern Time, which corresponds to different times in other parts of the world. For traders in London, this translates to an afternoon session, while for those in Asian markets like Tokyo, it's late evening.
Forex, operating 24 hours a day during weekdays, see overlapping sessions across different regions. For example, when the Asian trading session is concluding, the European session begins and later overlaps with the North American session. Such global interconnectivity ensures that forex markets are active round the clock, offering continuous trading opportunities but also requiring traders to be mindful of time zone differences and their impact on liquidity and volatility.
Strategies for Trading at Market Open
Trading at market open requires strategies that can handle rapid price movements across all markets. Here are some effective approaches:
- Pay Attention to Pre-Market Trends: This helps traders assess how a stock might behave at the market open. If a stock is fading from post-market highs, it might be wise to wait for a trend change before entering.
- Gap and Go Strategy: This involves focusing on stocks that gap up on positive news at market open, an indicator of potential further bullishness. Traders look for high relative volume in pre-market and enter trades on a break of pre-market highs. This strategy is fast-paced and requires quick decision-making.
- Opening Range Breakout (ORB): The ORB strategy uses the early trading range (high and low) to set entry points for breakout trades across all types of assets. The breakout from this range, typically the first 30 to 60 minutes of the session, often indicates the price direction for the rest of the session. Time frames like 5-minute, 15-minute, and 30-minute are commonly used for ORB.
- Gap Reversal: The gap reversal method is used when the price creates a gap, but then the range breaks in the opposite direction. If the gap is bullish and the price breaks the lower level of the opening range, it signals a gap reversal. The same concept applies to bearish gaps but in reverse.
The Bottom Line
In essence, understanding unique features of market open trading is vital for those participating in stock, forex, and commodity markets. The opening moments are characterised by heightened volatility and liquidity, driven by global events and sentiment. However, savvy traders may capitalise on these early market dynamics with effective strategies.
This article represents the opinion of the Companies operating under the FXOpen brand only. It is not to be construed as an offer, solicitation, or recommendation with respect to products and services provided by the Companies operating under the FXOpen brand, nor is it to be considered financial advice.
