Cybersecurity Risks in Global Trading Systems1. The Technological Backbone of Global Trading Systems
Modern trading systems are built upon a complex ecosystem of hardware, software, and networks. Key components include:
Trading Platforms: Electronic systems enabling order placement, execution, and settlement.
Market Data Feeds: Real-time price and volume data from exchanges, which are essential for algorithmic and high-frequency trading.
Cloud Infrastructure: Many trading firms now use cloud-based services for scalability, storage, and computational power.
APIs and Interconnections: Systems connect via APIs to brokers, exchanges, and other financial institutions, creating interdependencies.
Decentralized Finance (DeFi) Protocols: Emerging blockchain-based trading platforms that operate without traditional intermediaries.
While these technologies increase efficiency, speed, and accessibility, they also create vulnerabilities that cybercriminals can exploit.
2. Key Cybersecurity Risks in Trading Systems
Cyber threats to global trading systems can be categorized into several types, each with distinct characteristics and potential impacts.
2.1 Data Breaches and Theft
Sensitive financial data—trading algorithms, client information, and transaction histories—are prime targets for cybercriminals. Breaches can occur via:
Phishing attacks: Fraudulent emails or messages trick employees or traders into revealing credentials.
Credential stuffing: Automated attacks using stolen login credentials to access accounts.
Insider threats: Employees or contractors intentionally or unintentionally leak sensitive data.
Impact: Data breaches can lead to financial loss, reputational damage, and regulatory penalties. For instance, a breach exposing high-frequency trading algorithms can allow competitors or criminals to exploit market positions.
2.2 Distributed Denial-of-Service (DDoS) Attacks
DDoS attacks flood trading platforms or exchanges with overwhelming traffic, causing outages or slowdowns.
Motivation: Hackers may aim to manipulate market conditions by disrupting trading during volatile periods.
Historical example: In 2012, the NASDAQ faced DDoS attacks that briefly disrupted trading, highlighting vulnerabilities in market infrastructure.
Impact: DDoS attacks can halt trading, erode investor confidence, and create opportunities for price manipulation.
2.3 Market Manipulation through Cyberattacks
Cyberattacks can be used to distort market prices artificially.
Spoofing attacks: Fake orders are placed to create false demand or supply.
Algorithmic exploitation: Hackers exploit vulnerabilities in automated trading systems to trigger erroneous trades.
Impact: Such attacks can lead to significant financial losses and undermine trust in market integrity. Regulators have become increasingly vigilant about algorithmic manipulation.
2.4 Malware and Ransomware
Malware targeting trading systems can cause disruptions, exfiltrate sensitive data, or lock critical systems.
Ransomware: Attackers encrypt trading data and demand payment for access restoration.
Advanced persistent threats (APTs): Long-term, stealthy attacks targeting high-value trading operations, often state-sponsored.
Impact: Malware and ransomware can cripple trading firms, delay settlements, and trigger cascading financial consequences in interconnected markets.
2.5 Cloud and Third-Party Risks
The adoption of cloud infrastructure and third-party services has introduced new vulnerabilities:
Misconfigured cloud servers can expose sensitive trading data.
Third-party vendors may have weaker security standards, providing an entry point for attacks.
Supply chain attacks: Hackers compromise trusted software providers to infiltrate multiple trading firms simultaneously.
Impact: Cloud and third-party vulnerabilities can compromise multiple market participants, amplifying the systemic risk.
2.6 Blockchain and DeFi Vulnerabilities
Decentralized trading platforms and cryptocurrency exchanges are susceptible to unique cyber risks:
Smart contract exploits: Flaws in code can allow hackers to drain funds from DeFi protocols.
51% attacks: In smaller blockchain networks, attackers controlling a majority of network power can manipulate transactions.
Wallet phishing: Users’ private keys or wallets can be stolen through phishing or malware.
Impact: These vulnerabilities can lead to massive financial losses and shake confidence in emerging digital financial markets.
3. Systemic Risks in Global Trading
The interconnectivity of global trading systems means cyberattacks on a single node can ripple across markets.
3.1 Cross-Border Implications
Trading firms operate in multiple jurisdictions. A cyberattack in one country can affect:
Market liquidity in another country.
Foreign exchange settlements.
Multinational clearinghouses.
3.2 Contagion Risk
Failures in one platform can trigger panic selling, algorithmic misfires, or delayed settlements, magnifying market volatility.
3.3 Operational Disruption
Even temporary outages in critical trading infrastructure can disrupt order flows, create gaps in market transparency, and affect investor trust.
4. Regulatory Landscape and Compliance
Regulatory authorities globally recognize the critical importance of cybersecurity in financial markets:
U.S. Securities and Exchange Commission (SEC): Enforces cybersecurity standards for broker-dealers and exchanges.
European Securities and Markets Authority (ESMA): Requires risk assessments and incident reporting for trading firms.
Financial Stability Board (FSB): Provides guidelines on operational resilience for global financial infrastructure.
India’s SEBI: Mandates cybersecurity audits and reporting for trading platforms and brokers.
Challenges: Regulatory frameworks struggle to keep pace with rapidly evolving technology. Moreover, global coordination is challenging, as cyberattacks do not respect borders.
5. Case Studies of Cybersecurity Incidents in Trading
5.1 The 2010 Flash Crash
Although primarily caused by algorithmic trading, the Flash Crash highlighted the vulnerability of automated trading systems to manipulation, accidental errors, or system failures.
5.2 Nasdaq and DDoS Attacks (2012–2013)
Repeated DDoS attacks caused temporary outages, raising awareness of the importance of infrastructure resilience.
5.3 Mt. Gox Bitcoin Exchange Hack (2014)
The Mt. Gox hack resulted in the loss of 850,000 bitcoins, illustrating risks in cryptocurrency trading platforms and the consequences of inadequate cybersecurity.
5.4 Colonial Pipeline Ransomware Attack (2021)
Though not a trading platform, the Colonial Pipeline incident showed how ransomware can disrupt supply chains and trading-related commodities, affecting market pricing globally.
6. Emerging Threats and Future Risks
6.1 AI-Powered Cyberattacks
Artificial intelligence can be weaponized to:
Craft highly convincing phishing attacks.
Automatically exploit vulnerabilities in trading algorithms.
Conduct market manipulation at unprecedented speeds.
6.2 Quantum Computing Threats
Quantum computing could potentially break current encryption standards, threatening the confidentiality and integrity of trading systems.
6.3 Deepfake and Social Engineering Attacks
Advanced deepfakes could impersonate executives or regulatory authorities to authorize fraudulent transactions.
6.4 Increased Targeting of SMEs in Trading
Smaller trading firms and emerging market platforms often have weaker security, making them attractive targets that can be gateways to larger markets.
7. Mitigation Strategies
Addressing cybersecurity risks requires a multi-layered approach:
7.1 Technical Measures
Encryption: Securing sensitive data at rest and in transit.
Multi-factor authentication: Reducing the risk of credential theft.
Regular penetration testing: Identifying and fixing vulnerabilities.
AI-driven threat detection: Monitoring for unusual trading patterns and potential attacks.
7.2 Operational Measures
Incident response planning: Ensuring rapid recovery from attacks.
Employee training: Reducing phishing and insider threats.
Vendor risk management: Auditing third-party security practices.
7.3 Regulatory and Collaborative Measures
Global standards harmonization: Coordinating cybersecurity frameworks across markets.
Information sharing: Exchanges and regulators sharing threat intelligence to prevent attacks.
Stress testing and simulation: Evaluating system resilience under cyberattack scenarios.
8. The Human Factor in Cybersecurity
Even the most advanced technology is vulnerable without proper human oversight. Common human errors include:
Using weak passwords or reusing credentials.
Falling for phishing attacks.
Misconfiguring cloud services.
Failing to follow incident response protocols.
Training, awareness, and a culture of cybersecurity are essential components of risk management in global trading systems.
9. Conclusion
Cybersecurity risks in global trading systems represent one of the most pressing challenges in modern finance. The combination of complex technology, interconnectivity, and rapid innovation creates a landscape where threats are constantly evolving. Breaches, attacks, or system failures can have cascading effects, impacting not only individual firms but entire markets and economies.
Mitigating these risks requires a holistic approach:
Investing in robust technical infrastructure and advanced threat detection.
Developing strong operational protocols, including employee training and incident response plans.
Coordinating globally through regulators, exchanges, and industry consortia to share intelligence and best practices.
Emphasizing ongoing research into emerging threats such as AI-powered attacks, quantum computing risks, and blockchain vulnerabilities.
In the high-speed, high-stakes world of global trading, cybersecurity is not just a technical issue—it is a fundamental pillar of market stability, investor trust, and economic resilience. Firms that proactively manage cybersecurity risks are better positioned to thrive in an increasingly interconnected, technology-driven
Tradingforex
Global IPO trends & SME listings1. Brief history — how we got here
IPOs historically follow cycles tied to macro liquidity, investor sentiment, and policy. The mid-2010s saw steady IPO activity, disrupted dramatically in 2020 by COVID-19; markets recovered in 2021 with a surge in tech and growth listings. 2022–2023 brought market corrections: higher interest rates, equity de-rating for growth assets, and legislative/regulatory shocks in key jurisdictions (China, EU regulatory changes). By late-2023 and into 2024, a combination of easing lulls in some markets, fresh corporate readiness, and improved public market reception produced a recovery in 2024 and a stronger H1 2025, with proceeds and listing counts rising year-over-year in many datasets. Global consultancies and market trackers reported this lift in IPO volume and proceeds in H1 2025 compared with H1 2024.
2. The numbers — volume, proceeds and notable metrics (2023–H1 2025)
Key empirical takeaways from market trackers and advisory firms:
Overall rebound: Several major reports recorded a meaningful rebound in H1 2025 versus H1 2024, both in number of listings and aggregate proceeds — an increase in global proceeds in the order of mid-teens percent for the first half of 2025.
Listings count: Different trackers report slightly different counts (methodologies vary — inclusion/exclusion of SPACs, smaller exchanges), but the trend is broadly consistent: 2024 saw more IPOs than 2023, and 2025 continued that momentum. Renaissance Capital and other IPO trackers show dozens to a few hundreds of IPOs in 2025 depending on inclusion rules.
SPACs and alternatives: SPAC activity — after a lull in 2021–2022 — resurfaced in 2024 and into 2025, contributing materially to total IPO counts and providing a revived route for some issuers. Reports indicate SPACs accounted for a significant share of IPO activity in early-to-mid 2025.
3. Structural shifts reshaping global IPO markets
3.1 Cross-border listings and jurisdictional choice
A striking trend in 2024–2025 is increasing cross-border activity: more issuers are choosing to list outside their home jurisdiction. The U.S. regained strong pull for many high-growth companies (including non-U.S. issuers), driven by deep liquidity pools, active institutional appetites, and better aftermarket performance in certain sectors. Advisory reports in 2025 document record cross-border listings with a large proportion choosing the U.S. as destination.
Drivers:
Liquidity and valuation premia: U.S. and certain developed exchanges still offer higher valuations and deeper institutional demand for large growth names.
Regulatory clarity or flexibility: Some markets provide disclosure frameworks attractive to growth companies (or conversely, some home markets face regulatory headwinds that push issuers abroad).
Strategic investor access: Listings in a target market can bring strategic investors, research coverage, and credibility within that investor base.
3.2 Return of alternative listing routes: SPACs, direct listings, and IPO hybrids
After the SPAC boom and subsequent regulatory scrutiny, SPAC issuance cooled but revived with a “new generation” that is more selective and better structured. Direct listings remain an option for certain capital-rich companies seeking liquidity without a traditional roadshow. Both alternatives change timing, cost and governance dynamics of going public and have become a permanent part of the capital-raising toolkit.
3.3 Bifurcation: mega-deals vs. SME venues
Large, high-value deals (megafirms, big privatizations, resource spin-outs) dominate headline proceeds, while separate ecosystems of SME or “growth market” exchanges (AIM, TSX Venture, BSE SME, Nasdaq First North, ChiNext, STAR Market derivatives) provide tailored listing regimes for smaller issuers. The result is a two-tiered market: a handful of large capital raisings plus a broad base of smaller listings, often on specialized SME platforms. The OECD and exchanges’ research stress the importance of SME markets in sustaining job creation and innovation.
4. Regional dynamics — how different markets are behaving
United States
The U.S. equity market remains magnetically attractive for large growth and tech names: deep pools of institutional capital, active aftermarket trading, and robust underwriting capacity. Q2 2025 saw a rise in the number of U.S. IPOs compared with the previous year, though proceeds per deal varied; aftermarket performance in several 2025 IPOs added confidence for issuers. At the same time, regulatory scrutiny (e.g., around disclosures and SPAC post-dealmaking) continues to influence structures.
Hong Kong & Mainland China
Hong Kong regained momentum as a listing hub—particularly for resource and state-linked listings—benefiting from several large issuances in 2025. Mainland China’s reforms and new issuance windows for certain domestic sectors (STAR/ChiNext) continue to create localized IPO activity. The Zijin Gold HK IPO in September 2025 exemplifies Hong Kong’s ability to host very large resource and strategic listings.
Europe & UK
European IPO activity improved, helped by AIM-style venues for growth firms and regional regulatory efforts to encourage listings. Europe also sees a concerted policy push (OECD, exchanges) to strengthen SME access to public markets. Fragmentation across multiple national exchanges, however, remains a challenge for pooled liquidity.
India and other emerging markets
India’s primary market has been notably active at the SME and mainboard level, spurred by domestic savings, retail participation, and state support for IPO pipelines. Local SME segments (BSE SME, NSE Emerge) offer lower cost and scaled compliance to help smaller issuers list. Emerging markets frequently oscillate between domestic demand surges and capital flight during global risk episodes. Recent Indian weeks showed dozens of new SME and mainboard offers crowding the pipeline, indicating robust local issuance appetite.
5. SME listings: design, purpose and global models
SME listing segments are not smaller copies of main markets — they’re intentionally designed to lower entry costs, provide simpler compliance, and sequence growth. Key features include:
Lower minimum capital/float thresholds and reduced free-float requirements.
Streamlined disclosure and ongoing reporting, often calibrated to firm size and investor sophistication.
Investor protection tradeoffs: more disclosure leniency can increase risk-return variability; many SME venues require more active retail education or specialist market makers to maintain liquidity.
Support services: mentorship programs, fast-track delisting safeguards, and post-listing support such as investor outreach and sustainability guidance.
Major SME market examples: AIM (London), Nasdaq First North (Nordics), BSE SME (India), TSX Venture/CSE (Canada), ChiNext (China). OECD and UN SSE (Sustainable Stock Exchanges) initiatives increasingly recommend exchanges offer sustainability guidance to SMEs to future-proof growth and attract ESG-minded capital.
6. Why SME listings matter (economic and financial rationales)
Capital access for growth: SMEs often lack scale for institutional private rounds or high-cost bank financing — a public listing can supply growth capital and an acquisition currency (listed shares).
Price discovery & signaling: Public markets provide transparent valuation benchmarks that can aid subsequent capital raises or exits.
Market discipline & governance: Listing brings governance upgrades that can improve managers’ incentives and access to professional networks.
Local economic development: SME listings can anchor local ecosystems, create jobs, and increase tax bases — a reason regulators promote SME markets. OECD analysis emphasizes this public-good aspect.
7. Demand side: who is buying IPOs today?
Institutional investors: Long-only funds, hedge funds and sovereign wealth funds participate in larger deals; they increasingly demand strong governance credentials, clear path to profitability, and defensible competitive positions.
Retail investors: Remain a crucial source of demand for SMEs and many mainboard deals, especially where allocation rules favor retail participation (notably in India). Retail interest can create short-term pricing momentum but also volatility.
Cornerstone & long-term investors: For very large listings (e.g., resource or infrastructure spin-outs), cornerstone investors anchor deals and signal confidence — examples in 2025 include large cornerstone allocations to major institutional investors.
8. Sector dynamics — who’s going public?
Technology & AI-enabled firms: Renewed interest in tech, especially AI infrastructure and enterprise AI plays, as investors seek exposure to transformative productivity gains.
Energy and resources: With commodity price cycles and strategic national interests, energy/resource listings (including miners and renewables) have been prominent, especially where projects require capital for expansion. The Zijin Gold listing is an example of a resource IPO that tapped strong appetite.
Financial services and fintech: Continued listings as fintechs mature and pursue scale.
Healthcare & biotech: Ongoing pipeline as research hits commercial inflection points and capital needs become public market-sized.
Sector mix varies by region: e.g., Asia has substantial resource and industrial deals in some periods, while the U.S. attracts high-growth tech and healthcare companies.
Conclusion
The global IPO market in 2024–H1 2025 is not merely recovering — it is evolving. Cross-border flows, alternative listing structures (SPACs/direct listings), renewed investor appetite for certain sectors, and a robust ecosystem of SME listing venues combine to make the public markets a more versatile but also more complex place. For issuers, investors and policymakers, the main task is to match strategies to market structure: pick the right venue, be operationally ready, and design investor engagement that reflects the realities of modern capital markets. Exchanges that successfully scaffold SME access — by combining reduced barriers, investor protection, and active post-listing support — will unlock substantial long-term economic value.
Derivatives Trading in Emerging Markets1. Understanding Derivatives in Simple Terms
A derivative is essentially a financial contract whose value is derived from an underlying asset. That asset could be anything — stocks, bonds, currencies, commodities, or even interest rates.
Think of it like this:
If you and your friend bet on whether the price of gold will go up or down next month, you’ve entered into a type of derivative contract.
The bet itself has no standalone value; it derives its worth from the movement of gold prices.
The most common types of derivatives include:
Futures Contracts – Agreements to buy or sell an asset at a fixed price on a future date.
Options Contracts – Rights (but not obligations) to buy or sell an asset at a specific price before a given date.
Forwards Contracts – Custom, over-the-counter (OTC) agreements similar to futures, but privately negotiated.
Swaps – Agreements to exchange cash flows, such as fixed interest for floating interest.
In developed economies, derivatives trading is massive. The notional value of global derivatives markets runs into hundreds of trillions of dollars. But in emerging markets, the journey is still evolving.
2. Why Derivatives Matter in Emerging Markets
Emerging markets — like India, Brazil, China, South Africa, Mexico, and Turkey — are characterized by fast economic growth, higher volatility, and developing financial institutions.
Here’s why derivatives play such a crucial role in these economies:
Risk Management (Hedging)
Commodity producers (like farmers in India or oil exporters in Brazil) face price volatility. Derivatives allow them to lock in prices and reduce uncertainty.
For example, an Indian farmer can use a futures contract on wheat to protect against falling prices during harvest.
Price Discovery
Derivatives markets help determine fair prices of commodities and financial assets. Futures on stock indices or currencies often reflect real-time demand-supply expectations.
Liquidity & Market Depth
They increase participation in markets. A liquid derivatives market often boosts liquidity in the cash (spot) market as well.
Investment Opportunities
For global investors, derivatives provide exposure to emerging market growth stories without needing to directly own local stocks or bonds.
Integration with Global Finance
Derivatives connect emerging markets with global capital flows, making them part of the broader financial ecosystem.
3. Historical Development of Derivatives in Emerging Markets
The journey of derivatives in emerging economies is relatively recent compared to the U.S. or Europe. Let’s take a quick tour:
India
India banned derivatives trading in 1952 due to speculation risks.
In 2000, it reintroduced derivatives on stock indices and later expanded into single-stock futures, options, and commodity derivatives.
Today, India has one of the largest derivatives markets in the world by volume.
Brazil
BM&F Bovespa (now part of B3 exchange) has been a pioneer in Latin America.
It introduced futures contracts on commodities like coffee and later expanded into financial derivatives.
China
Initially cautious due to speculation risks, China opened derivatives trading in the 1990s.
Today, the Shanghai Futures Exchange and China Financial Futures Exchange trade a wide range of contracts.
South Africa
The Johannesburg Stock Exchange (JSE) has a robust derivatives segment, including agricultural futures.
Turkey & Mexico
Both countries have developed active currency and interest rate derivative markets, driven by macroeconomic volatility.
The common thread? Derivatives in emerging markets often start with commodities (agriculture, metals, or energy) and later expand into financial products.
4. Key Types of Derivatives in Emerging Markets
a. Commodity Derivatives
Farmers, miners, and exporters rely heavily on futures and options.
Example: Brazil’s coffee futures, India’s gold futures, and South Africa’s maize futures.
b. Equity Derivatives
Stock index futures and options are increasingly popular.
India’s Nifty50 futures are among the most traded globally.
c. Currency Derivatives
Emerging markets often face currency volatility due to capital flows.
Currency futures (like USD/INR in India) help businesses hedge exchange rate risks.
d. Interest Rate Derivatives
Less developed compared to developed nations, but growing fast.
For example, Mexico and Turkey have active interest rate swap markets due to inflation risks.
5. Opportunities in Derivatives Trading in Emerging Markets
Emerging markets present unique opportunities for traders, investors, and institutions:
High Growth Potential
As economies grow, demand for derivatives rises.
Market Inefficiencies
Emerging markets often display mispricing due to less competition, creating arbitrage opportunities.
Commodity Exposure
Emerging economies are major commodity producers. Derivatives give exposure to commodities like oil, metals, and agriculture.
Retail Participation
In markets like India, retail investors are driving growth in equity derivatives.
Global Diversification
International investors can diversify by accessing emerging market derivatives.
6. Risks and Challenges
While the opportunities are strong, derivatives in emerging markets come with risks:
Volatility
Emerging markets often face sharp price swings due to political or economic shocks.
Regulatory Uncertainty
Policies can change overnight, restricting or liberalizing derivative trading.
Liquidity Issues
Some contracts lack depth, making it hard to exit positions.
Counterparty Risk
In over-the-counter markets, the risk of default is higher.
Speculation vs. Hedging
Regulators often worry about excessive speculation destabilizing markets.
Lack of Awareness
Many small businesses or retail traders in emerging markets don’t fully understand derivatives, leading to misuse.
7. Regulatory Landscape
Regulation plays a defining role in shaping derivative markets.
India: The Securities and Exchange Board of India (SEBI) oversees derivatives trading. It has gradually opened the market but remains cautious about speculation.
Brazil: B3 Exchange operates under the Brazilian Securities and Exchange Commission (CVM).
China: The China Securities Regulatory Commission (CSRC) keeps a tight grip, limiting speculative contracts.
South Africa: The Financial Sector Conduct Authority regulates derivatives under the JSE.
A common theme is balancing market development with financial stability. Too much speculation could cause systemic risks; too much control could stifle growth.
8. Case Studies
Case 1: India’s Nifty Derivatives Boom
Nifty index futures and options dominate global trading volumes.
Low margin requirements and high retail participation fueled this growth.
Case 2: Brazil’s Coffee Futures
Brazil is the world’s largest coffee producer. Coffee futures contracts in São Paulo provide global benchmarks for pricing.
Case 3: China’s Cautious Path
China introduced stock index futures in 2010 but imposed heavy restrictions after the 2015 market crash. This shows the delicate balance regulators maintain.
9. The Future of Derivatives in Emerging Markets
The next decade could see explosive growth in emerging market derivatives:
Digital Platforms & Fintech
Online trading apps will democratize access.
ESG & Green Derivatives
New contracts may emerge around carbon credits and renewable energy.
Cross-Border Trading
Greater integration with global exchanges.
Blockchain & Smart Contracts
Could reduce counterparty risks and improve transparency.
Retail Power
Just like in India, retail traders will drive volume growth in many countries.
10. Conclusion
Derivatives trading in emerging markets is both a story of promise and caution. On one hand, these instruments help farmers, exporters, and investors hedge against volatility, improve price discovery, and connect to global finance. On the other, misuse and over-speculation can destabilize fragile economies.
For investors, derivatives in emerging markets are not just about chasing profits — they are about understanding the heartbeat of fast-growing economies. As regulations mature, technology spreads, and education improves, these markets could very well become the engines of global derivatives growth.
Oil Wars and OPEC+ Price InfluencePart 1: Oil as a Geopolitical Weapon
Oil and Global Power
Ever since oil replaced coal as the primary energy source in the early 20th century, it has been intertwined with national security, industrial growth, and military power. The British Navy’s decision in 1912 to shift from coal to oil was a strategic move that highlighted the importance of securing reliable petroleum supplies. From World War I to the Iraq wars, oil has dictated alliances, interventions, and even regime changes.
Countries with abundant oil—like Saudi Arabia, Russia, Iraq, and Venezuela—have leveraged their reserves for geopolitical clout. Conversely, nations dependent on oil imports, like the United States, China, Japan, and India, have structured much of their foreign policy around securing energy supplies.
Oil Wars: A Historical Overview
“Oil wars” are not always literal wars fought exclusively for oil, but rather conflicts where oil plays a central role in the motives, strategies, or outcomes. Some major examples include:
World War II (1939–1945): Control of oil fields was critical to the Axis and Allied powers. Germany’s failed push into the Caucasus (Operation Blue) was motivated by access to Soviet oil. Japan’s attack on Pearl Harbor was partly triggered by U.S. sanctions restricting Japanese access to oil.
The Arab-Israeli Conflicts & Oil Embargo (1973): In response to Western support for Israel during the Yom Kippur War, OPEC Arab members imposed an oil embargo. Prices quadrupled, exposing the world to the geopolitical leverage of oil producers.
The Iran-Iraq War (1980–1988): Both nations targeted each other’s oil infrastructure. Tanker wars in the Persian Gulf disrupted global supplies.
The Gulf War (1990–1991): Iraq’s invasion of Kuwait was directly linked to control of oil wealth. The U.S.-led coalition intervened not only for sovereignty but also to secure global oil markets.
The Iraq War (2003): While debated, many analysts argue that oil interests influenced the U.S. decision to invade Iraq, reshaping Middle Eastern energy politics.
Syrian Civil War (2011–present): Control of oil fields and pipelines became central for different factions, with global powers eyeing energy routes as well.
Russia-Ukraine Conflict (2014–present, escalated 2022): While largely territorial and political, oil and gas pipelines have been weapons in Russia’s economic standoff with Europe. Sanctions on Russian crude reshaped global trade flows.
These conflicts illustrate that oil wars are not simply about owning oil fields—they are about controlling global supply routes, ensuring market access, and weaponizing energy for diplomatic or military leverage.
Part 2: Birth and Evolution of OPEC
Why OPEC Was Formed
By the mid-20th century, the oil industry was dominated by Western multinational corporations—the so-called “Seven Sisters” (Exxon, Shell, BP, Chevron, Gulf, Texaco, Mobil). They controlled exploration, production, and pricing, while oil-producing nations received minimal returns.
In response, five countries—Saudi Arabia, Iran, Iraq, Kuwait, and Venezuela—founded the Organization of Petroleum Exporting Countries (OPEC) in 1960 in Baghdad. Their goal was simple: to coordinate policies and secure fairer revenues.
OPEC’s Early Years
Initially underestimated, OPEC gained prominence after the 1973 oil crisis when Arab members used production cuts and embargoes as political tools. This event showcased OPEC’s ability to shock the global economy. Oil prices skyrocketed, inflation surged worldwide, and industrial nations realized their vulnerability.
In the 1980s, however, OPEC’s unity was challenged. Internal rivalries, cheating on quotas, and external pressures (like North Sea oil discoveries) weakened its control. Yet, OPEC retained the role of a “swing producer,” particularly through Saudi Arabia, which used its massive spare capacity to balance markets.
Part 3: OPEC+ and the Modern Oil Market
The Birth of OPEC+
By the 2000s, OPEC alone could not fully control prices due to the rise of non-OPEC producers, especially Russia, the U.S. (shale oil), and Canada. In 2016, in the aftermath of the oil price crash triggered by shale oil oversupply, OPEC allied with non-OPEC producers, most notably Russia, Kazakhstan, and Mexico, forming OPEC+.
This alliance was critical in rebalancing markets through coordinated production cuts. Russia brought immense weight to the group as the world’s second-largest crude exporter, while Saudi Arabia retained its role as leader.
How OPEC+ Influences Prices
OPEC+ does not directly set prices; instead, it influences them through production targets. By cutting supply, they push prices up; by raising production, they cool markets. Key mechanisms include:
Production Quotas: Members agree on collective output ceilings.
Spare Capacity: Saudi Arabia and UAE often adjust supply to stabilize markets.
Market Communication: Even announcements and forward guidance move prices, as traders react to perceived scarcity or abundance.
Emergency Meetings: OPEC+ convenes when crises—such as the COVID-19 pandemic or Russia-Ukraine war—disrupt markets.
Major OPEC+ Interventions
2016 Production Cuts: After oil crashed below $30 per barrel, OPEC+ cut 1.8 million barrels per day (mbpd), reviving prices.
COVID-19 Crash (2020): Oil demand collapsed, and at one point, U.S. crude futures went negative. OPEC+ enacted historic cuts of nearly 10 mbpd to stabilize markets.
Russia-Ukraine War (2022): With sanctions on Russia, OPEC+ resisted Western pressure to raise output, choosing instead to support Russia and maintain stability for producers. Prices surged above $120 before stabilizing.
2023–2025 Cuts: OPEC+ has continued voluntary cuts, particularly by Saudi Arabia and Russia, to defend price levels against slowing global demand and rising U.S. shale output.
Part 4: Oil Wars Meet OPEC+—A Symbiotic Relationship
Oil wars and OPEC+ decisions often overlap. For instance:
During the Iran-Iraq War, OPEC struggled to maintain unity as members fought each other.
The Gulf War pushed OPEC to stabilize supply after Kuwait’s oil fields were set ablaze.
The U.S.-Russia standoff over Ukraine has forced OPEC+ to navigate geopolitical divisions while maintaining production discipline.
Thus, OPEC+ not only manages economics but also absorbs the shocks of oil wars, sometimes exploiting them to strengthen its influence.
Part 5: The Economics of Price Influence
Why Prices Matter
Oil is not just a commodity; it’s a macroeconomic driver. Prices affect:
Producer Nations: High prices boost revenues for OPEC+ states, funding budgets and political stability. Low prices create deficits and unrest.
Consumer Nations: Importers like India, China, and Europe face inflation, trade deficits, and currency pressures when oil rises.
Global Trade: Since oil is priced in dollars, higher prices strengthen the U.S. dollar and worsen debt burdens for emerging markets.
The Price Band Strategy
OPEC+ has often targeted a “comfortable” price band, usually between $70 and $100 per barrel. Too low hurts their revenues; too high accelerates renewable adoption and incentivizes rival production. The art of OPEC+ strategy lies in maintaining this balance.
Part 6: Challenges Facing OPEC+
Despite its success, OPEC+ faces growing challenges:
U.S. Shale Oil: Flexible and responsive, U.S. shale producers ramp up output when prices rise, capping OPEC+’s influence.
Energy Transition: With the world shifting to renewables, long-term demand for oil may peak within decades, pressuring producers to maximize current revenues.
Internal Unity: Not all OPEC+ members comply with quotas. Political rivalries (Saudi-Iran, Russia-Saudi tensions) threaten cohesion.
Geopolitical Pressures: Western nations often accuse OPEC+ of manipulating markets, sometimes threatening antitrust actions.
Global Economic Slowdowns: Recessions and crises, like COVID-19, reduce demand, testing OPEC+’s ability to respond.
Part 7: The Future of Oil Wars and OPEC+
Looking ahead, oil will remain strategically vital even as renewables grow. Three possible scenarios unfold:
Continued Relevance: OPEC+ maintains its dominance through discipline and coordination, ensuring prices stay profitable.
Fragmentation: Internal rivalries and external competition weaken OPEC+, reducing its control.
Transition Era Wars: As global demand slows, competition for shrinking market share could trigger new oil wars, especially in regions like the Middle East and Africa.
At the same time, OPEC+ is exploring cooperation in renewable energy investments, hedging against a post-oil future. Yet for now, the cartel remains the single most important force in shaping global energy markets.
Conclusion
The history of oil is the history of power, conflict, and economic influence. From wars fought over fields and pipelines to the coordinated strategies of OPEC+, the price of oil has never been left to free markets alone. Instead, it has been molded by both bloodshed and diplomacy.
Oil wars remind us of the destructive potential when energy becomes a weapon of conflict. OPEC+ illustrates the stabilizing—or destabilizing—impact of collective price management. Together, they show that oil is far more than fuel; it is leverage, influence, and survival.
As the world transitions toward cleaner energy, the influence of oil may eventually decline. But in the foreseeable future, oil wars and OPEC+ price influence will remain at the core of global economics and geopolitics—deciding the fates of nations and the rhythm of the world economy.

Currency Wars Between Major Economies1. What is a Currency War?
A currency war (sometimes called “competitive devaluation”) occurs when countries deliberately try to devalue their own currencies in order to:
Make exports cheaper and more attractive in global markets.
Reduce the relative cost of domestic production compared to foreign competitors.
Improve trade balances by discouraging imports.
Stimulate domestic economic growth in times of slowdown.
The central idea is: a weaker currency helps exporters and supports jobs at home, but it often comes at the expense of trading partners.
However, currency wars are not always explicit. Sometimes they result from domestic monetary policies (like cutting interest rates or expanding money supply through quantitative easing) that incidentally weaken a currency. In other cases, governments openly intervene in foreign exchange markets, buying or selling large amounts of currency to influence exchange rates.
2. The Historical Roots of Currency Wars
a) The 1930s: The Great Depression and the “Beggar-Thy-Neighbor” Policies
The first widely recognized currency war took place during the Great Depression. In the 1930s, demand collapsed worldwide, unemployment skyrocketed, and countries scrambled to protect their industries.
Britain left the Gold Standard in 1931, devaluing the pound to boost exports.
The U.S. followed in 1933 under President Franklin D. Roosevelt, devaluing the dollar against gold.
Other nations like France, Germany, and Japan also adjusted their exchange rates.
This competitive devaluation became known as a “beggar-thy-neighbor” policy, where one country’s gain came at the expense of others. Instead of solving the crisis, it deepened global tensions and reduced cooperation — contributing indirectly to the geopolitical instability that led to World War II.
b) Bretton Woods and the Post-War Era
After World War II, leaders sought to prevent a repeat of destructive currency conflicts. In 1944, the Bretton Woods Agreement created a system of fixed exchange rates anchored to the U.S. dollar, which itself was pegged to gold.
This system promoted stability, but it had cracks:
Countries with trade surpluses (like Germany and Japan) accumulated reserves, while deficit nations (like the U.S.) faced growing pressure.
By 1971, the U.S. under President Richard Nixon ended dollar convertibility to gold — known as the Nixon Shock.
This collapse of Bretton Woods unleashed a new era of floating exchange rates, opening the door again for currency maneuvering.
c) The Plaza Accord (1985)
One of the most famous episodes of currency coordination (and conflict) came in the 1980s. The U.S. dollar had become excessively strong, hurting American exporters and creating huge trade deficits.
In 1985, the Plaza Accord was signed by the U.S., Japan, West Germany, France, and the U.K. The agreement coordinated efforts to weaken the U.S. dollar and strengthen other currencies like the Japanese yen and German Deutsche mark.
This marked a rare moment of cooperation in a currency conflict. However, the yen’s sharp appreciation later contributed to Japan’s asset bubble and “lost decades” of economic stagnation.
3. Tools Used in Currency Wars
Major economies deploy several instruments when waging currency wars:
a) Monetary Policy
Interest Rate Cuts: Lower rates reduce returns on investments in a currency, weakening its value.
Quantitative Easing (QE): Central banks create money to buy government bonds, expanding liquidity and pushing the currency downward.
b) Direct Market Intervention
Central banks buy or sell currencies in massive volumes. For example, China has historically purchased U.S. dollars to keep the yuan weaker and boost exports.
c) Trade Policies
Tariffs, subsidies, and capital controls can indirectly pressure currency values.
d) Capital Controls
Restricting or encouraging flows of foreign capital influences currency demand.
e) Rhetorical Pressure
Leaders often use verbal intervention — statements signaling that they prefer weaker or stronger currencies — to sway markets.
4. Major Episodes of Currency Wars in the Modern Era
a) The 2008 Global Financial Crisis and “Currency War II”
After the 2008 financial meltdown, the U.S. Federal Reserve launched unprecedented quantitative easing. The massive expansion of money supply weakened the dollar, making U.S. exports more competitive.
Emerging economies, particularly Brazil, India, and China, complained that the U.S. was effectively waging a currency war. Brazil’s Finance Minister Guido Mantega famously declared in 2010 that the world was in the midst of a “currency war” triggered by U.S. policies.
Other countries responded:
Japan intervened to prevent yen appreciation.
Switzerland capped the Swiss franc’s value against the euro to protect exporters.
China maintained tight control over the yuan’s value.
b) U.S.–China Currency Tensions
The U.S. has long accused China of deliberately undervaluing its currency to gain trade advantages. By pegging the yuan to the dollar and intervening heavily in markets, China kept its exports competitive.
In 2019, during the U.S.–China trade war, the U.S. Treasury officially labeled China a “currency manipulator”.
Though the label was later removed, the tension highlighted how currency policies are deeply tied to geopolitical rivalries.
c) Eurozone and Japan in the 2010s
The European Central Bank (ECB) and the Bank of Japan (BOJ) also engaged in aggressive monetary easing. Both sought to stimulate sluggish economies and raise inflation. The result was a weaker euro and yen — moves criticized by trading partners who saw them as currency manipulation.
5. Winners and Losers in Currency Wars
Currency wars create complex outcomes:
Winners:
Exporters: A weaker currency boosts competitiveness abroad.
Industries with excess capacity: Can offload products internationally.
Countries with high unemployment: Export growth creates jobs.
Losers:
Import-dependent economies: Weaker currencies make imported goods (like oil, technology, or raw materials) more expensive.
Consumers: Face higher prices for foreign goods.
Global stability: Currency wars often fuel retaliatory trade wars.
6. The Geopolitical Dimension of Currency Wars
Currency values are not just about economics — they are tools of power.
The U.S. Dollar: As the world’s reserve currency, the dollar’s strength or weakness has global ripple effects. Dollar dominance gives the U.S. a unique ability to run deficits and still attract capital.
China’s Yuan: Beijing aims to internationalize the yuan, challenging dollar supremacy. Currency management is part of its broader geopolitical ambition.
Euro and Yen: Represent regional stability and serve as counterweights in financial markets.
Emerging Markets: Often caught in the crossfire, suffering from volatile capital flows and inflation risks when major economies manipulate currencies.
7. Are We in a Currency War Today?
As of the 2020s, elements of currency competition are visible:
Post-COVID Stimulus: Massive monetary easing in the U.S., Europe, and Japan initially weakened currencies, though inflation later forced tightening.
Dollar Strength (2022–2024): The U.S. dollar surged due to aggressive Federal Reserve rate hikes, putting pressure on emerging markets with dollar-denominated debt.
China’s Slowdown: China has allowed the yuan to weaken at times to support exports amid slowing domestic demand.
De-Dollarization Trends: BRICS nations and others are exploring alternatives to the dollar, signaling future battles over currency influence.
8. The Risks of Currency Wars
Currency wars may provide temporary relief for domestic economies, but they carry significant risks:
Trade Wars: Competitive devaluation often spills into tariffs and protectionism.
Inflation: Weaker currencies make imports costlier, fueling inflation.
Financial Instability: Rapid capital flight from weaker currencies can destabilize economies.
Loss of Credibility: Persistent manipulation undermines trust in a nation’s financial system.
Global Tensions: Currency disputes exacerbate geopolitical rivalries.
9. Pathways to Cooperation
While conflict is common, cooperation remains possible:
IMF Surveillance: The International Monetary Fund monitors exchange rate policies to discourage manipulation.
Currency Swap Agreements: Central banks often collaborate to provide liquidity in crises.
Multilateral Dialogues: Platforms like the G20 discuss currency issues to prevent escalation.
Global Reserve Diversification: Gradual movement toward a multipolar currency system (dollar, euro, yuan) may reduce tensions.
10. The Future of Currency Wars
Looking ahead, several themes will shape the currency battles of the future:
U.S.–China Rivalry: The yuan’s internationalization vs. dollar dominance will remain central.
Digital Currencies: Central Bank Digital Currencies (CBDCs) could reshape currency competition. China is already ahead with its digital yuan.
Geopolitical Fragmentation: As regional blocs (BRICS, ASEAN, EU) strengthen, multiple currency spheres of influence may emerge.
Energy and Commodities: Countries like Russia are pushing for non-dollar trade in oil and gas, tying currencies directly to resource power.
Technology and Finance: Cryptocurrencies and fintech innovations may add another dimension to currency wars.
Conclusion
Currency wars are a recurring feature of the global economy, blending economics, politics, and power. From the Great Depression’s competitive devaluations to the modern U.S.–China rivalry, these wars reveal how deeply currencies influence trade, growth, and geopolitics.
While a weaker currency may provide short-term relief to struggling economies, the long-term costs often outweigh the gains. Inflation, financial instability, and rising tensions are frequent outcomes. True stability requires cooperation, transparency, and reforms in the global monetary system.
In the 21st century, the battlefield of currency wars is shifting. It is no longer just about exchange rates, but about digital currencies, technological control, and global influence. Whether the future brings cooperation or deeper conflict depends on how major economies balance national interests with global stability.

XAUUSD – Strong Resistance at 3760–3770 Await ConfirmationHello trader,
Gold continues to oscillate within an accumulation zone following its recent recovery. While the overall trend leans towards an increase, a stronger breakout requires clear confirmation at key resistance-support levels.
Strong Resistance: 3760 – 3770, confluence with the Fibonacci extension zone. This is a pivotal level if the price aims to set a new ATH in the mid-term.
Key Level Sell: 3685 – 3695, currently a short-term resistance zone. If the price fails to break through, gold may face downward pressure.
Important Support:
3564 – 3574: mid-term support.
3534 – 3540: deep support zone, aligning with previous liquidity.
MACD H4: Histogram remains weak, momentum is unclear → the market needs further confirmation to clarify the trend direction.
Trading Scenarios
Bullish Scenario
Condition: Price breaks above 3695 and holds.
Entry: Retest 3665 – 3668.
Target: 3680-3698-3715-3730 – 3760 – 3770.
Extension: If successfully surpassing 3770 → expect a move towards 3800+.
Bearish Scenario
Condition: Price fails at 3695 and reverses.
Entry: Sell at 3685 – 3695 when a rejection signal appears.
Target: 3672-3655-3635 – 3600 – 3574.
Extension: If 3574 breaks, the decline may target 3540, or even lower.
Mid-term Scenario
Price may retest 3534 – 3550 to gather liquidity, then rebound according to the larger trend. This will be an attractive long-term Buy zone.
The gold market is at a crucial stage: buyers need to break 3695 to confirm an uptrend, while sellers still have opportunities at the short-term resistance zone. Deep support areas will continue to serve as the foundation for mid-term Buy strategies.
Keep a close eye on the 3695 and 3760 – 3770 zones to determine the next direction.
Stay tuned for the latest scenarios as the price structure evolves.

High-Risk, High-Reward: In Emerging Market1. Understanding Emerging Markets
Emerging markets are countries whose economies are transitioning from being primarily agricultural or resource-based to more industrialized, urbanized, and globally integrated. Unlike developed economies, these markets are still building infrastructure, regulatory frameworks, and financial institutions, which means they have enormous growth potential—but also higher uncertainty.
Key characteristics of emerging markets include:
Rapid Economic Growth: These economies can grow at double the pace of developed markets due to industrialization, urban migration, and modernization.
Young and Expanding Population: Many emerging markets have a demographic advantage—a large, youthful labor force that can drive productivity and consumption.
Growing Middle Class: As incomes rise, more people enter the middle class, increasing demand for consumer goods, financial services, real estate, healthcare, and technology.
Global Integration: These countries are increasingly participating in global trade, foreign direct investment (FDI), and capital markets. This integration can accelerate growth but also exposes them to global shocks.
Examples of major emerging markets include China, India, Brazil, Russia, and South Africa, but there are many others like Vietnam, Indonesia, Nigeria, and Mexico. Each has its own economic structure, political system, and investment landscape.
2. Why Investors Are Attracted to Emerging Markets
The attraction of emerging markets lies in their potential for outsized returns. Historically, investors who correctly timed their entry into emerging economies enjoyed growth rates far above what was possible in developed markets. Some reasons include:
High GDP Growth Rates: While developed countries often grow at 2–3% annually, emerging markets can achieve 5–8% or more, compounding wealth faster.
Undervalued Assets: Stock markets, real estate, and bonds in these regions are often undervalued relative to their growth potential.
Demographic Dividend: Young populations are more adaptable, tech-savvy, and entrepreneurial, fueling innovation and consumption.
Infrastructure Development: Rapid urbanization and government-led projects create investment opportunities in construction, energy, transport, and telecommunications.
Innovation and Entrepreneurship: Startups in tech, fintech, e-commerce, and healthcare are growing exponentially, often with low competition initially.
The combination of high growth, untapped potential, and early-stage investment opportunities explains why high-risk investors are drawn to these markets.
3. Investment Opportunities in Emerging Markets
Emerging markets offer multiple avenues for investment, each with its own risk-return profile.
3.1 Equity Markets
Investing in local companies or exchange-traded funds (ETFs) that focus on emerging markets is one of the most common strategies. Equities offer:
High Potential Returns: Fast-growing companies can multiply in value as markets expand.
Sectoral Diversity: Investors can choose from consumer goods, technology, healthcare, energy, and financial sectors.
Stock Market Reforms: Many emerging markets are improving transparency, governance, and market infrastructure, making equity investment more attractive.
Example: Investing in India’s technology companies in the early 2000s or Brazil’s consumer sector in the 2010s generated massive returns.
3.2 Fixed Income Securities
Bonds in emerging markets, issued by governments or corporations, offer higher yields than those in developed economies. Benefits include:
Attractive Interest Rates: Emerging market bonds often pay higher coupons to compensate for risk.
Diversification: Adding emerging market debt can reduce overall portfolio risk if correlated carefully with developed market assets.
Local Currency Opportunities: For investors willing to take currency risk, local-denominated bonds can boost returns.
Risks: Political instability, inflation, and currency depreciation can erode returns.
3.3 Real Estate
Rapid urbanization, industrialization, and growing middle classes create strong demand for residential, commercial, and industrial properties.
Residential Real Estate: Cities expanding quickly often experience housing shortages, creating investment potential in apartments and housing projects.
Commercial Real Estate: Offices, retail spaces, and industrial parks grow with urban economies and FDI inflows.
REITs and Funds: Real estate investment trusts focused on emerging markets allow investors to participate with lower capital requirements.
3.4 Private Equity and Venture Capital
Startups in emerging markets can offer enormous upside. Sectors like fintech, healthtech, e-commerce, and renewable energy are booming.
Early-Stage Investment: Entering early allows for potentially exponential growth.
Innovation and Market Gaps: Many sectors remain underdeveloped, leaving room for disruptive business models.
Partnerships with Local Entrepreneurs: Working with local founders provides market knowledge and increases the likelihood of success.
Challenges: High failure rates, regulatory hurdles, and exit risks if local capital markets are underdeveloped.
3.5 Commodities
Many emerging markets are resource-rich. Investing in commodities such as oil, metals, agricultural products, and energy infrastructure can be profitable.
Natural Resources: Countries like Brazil (soybeans), Russia (oil and gas), and South Africa (minerals) have global export potential.
Rising Global Demand: Growing populations in emerging markets themselves increase internal demand for commodities.
Risks: Commodity prices are volatile and dependent on global supply-demand dynamics.
4. Risks of Investing in Emerging Markets
While the opportunities are substantial, risks are equally significant. Emerging markets are high-risk by nature due to several factors:
4.1 Political Instability
Sudden policy changes, coups, corruption, or civil unrest can wipe out investments. Governments may alter regulations affecting foreign investors, taxation, or property rights.
4.2 Currency Volatility
Exchange rate fluctuations can erode returns for foreign investors. A strong dollar, inflation, or balance-of-payments crisis can lead to sudden depreciation of local currency.
4.3 Economic Vulnerabilities
Emerging markets may be heavily dependent on commodities, exports, or foreign capital. Global economic shocks, trade wars, or declining commodity prices can significantly impact growth.
4.4 Market Liquidity
Financial markets may be less liquid, with fewer buyers and sellers, leading to price swings. Large transactions can move markets, and exiting investments quickly may be difficult.
4.5 Regulatory Risks
Legal systems may be underdeveloped or inconsistent. Intellectual property rights, contract enforcement, and investor protections may not be strong, increasing business risks.
5. Strategies for Mitigating Risk
Investing successfully in emerging markets requires careful planning, research, and risk management.
5.1 Diversification
Spread investments across countries, sectors, and asset classes.
Avoid concentrating exposure in one country or industry.
5.2 Thorough Research
Understand local economics, politics, culture, and regulations.
Analyze companies, market trends, and financial statements carefully.
5.3 Local Partnerships
Collaborate with local firms, advisors, or entrepreneurs.
They can provide insights into market dynamics, consumer behavior, and regulatory compliance.
5.4 Hedging
Use derivatives, currency hedges, or funds to protect against volatility.
Hedging can mitigate currency, interest rate, and commodity risks.
5.5 Long-Term Perspective
Be prepared for short-term volatility.
Focus on long-term growth potential, riding out market cycles.
Conclusion
Investing in emerging markets is a balancing act between enormous opportunity and significant risk. These markets can create wealth faster than developed economies, but volatility, political uncertainty, and regulatory weaknesses make caution essential.
For investors with the knowledge, patience, and discipline to navigate these markets, the rewards can be extraordinary. By diversifying investments, conducting thorough research, partnering with local experts, and maintaining a long-term perspective, investors can capture the growth potential while mitigating the inherent risks.
Emerging markets are not for everyone—but for those willing to embrace uncertainty intelligently, they offer a chance to be part of the next wave of global economic transformation.

BRICS and Beyond: Regional Alliances Driving GrowthIntroduction: A Changing Global Landscape
Over the past two decades, the global economic and geopolitical landscape has been shifting dramatically. Traditional power centers in the West, long dominant in trade, finance, and politics, are now facing challenges from emerging economies. In the heart of this transformation lies BRICS—a coalition of Brazil, Russia, India, China, and South Africa. What started as a loose grouping of fast-growing economies has evolved into a robust platform that reflects the aspirations of the Global South and promotes a multipolar world order.
The influence of BRICS is no longer confined to the five original countries. The bloc’s expansion to include nations like Egypt, Ethiopia, Iran, Saudi Arabia, and the UAE signals a strategic pivot towards broader regional cooperation and global influence. These emerging alliances are more than diplomatic gestures—they are engines driving economic growth, fostering innovation, and redefining global trade networks. Understanding BRICS and the broader network of regional alliances is crucial to grasping how the future of global growth may unfold.
The Birth and Evolution of BRICS
The term “BRICS” was first coined in 2001 by economist Jim O’Neill to highlight the potential of Brazil, Russia, India, and China as emerging economic powerhouses. These countries, while geographically and culturally diverse, shared certain traits: large populations, vast natural resources, rapidly expanding economies, and an ambition to shape global institutions in a more equitable direction. South Africa joined the bloc in 2010, adding an African voice and extending BRICS’ influence beyond Asia and Latin America.
Initially, BRICS was primarily an economic dialogue platform. The member states sought to coordinate positions on international finance, trade, and development policy. Over time, the bloc’s focus broadened. Today, BRICS engages in political coordination, security dialogues, cultural exchange, and sustainable development initiatives. Key institutions such as the New Development Bank (NDB) and the Contingent Reserve Arrangement (CRA) have been created to finance infrastructure, provide emergency liquidity support, and reduce dependency on Western financial systems dominated by the US dollar and IMF policies.
Why BRICS is Expanding
The recent enlargement of BRICS reflects both opportunity and strategy. Countries such as Iran, Saudi Arabia, and Egypt bring new dimensions of economic, political, and energy-related clout. This expansion is not merely symbolic; it serves concrete purposes:
Economic Diversification: Including new members opens access to untapped markets, resources, and investment opportunities. Countries with different economic structures complement each other, reducing risk and fostering resilience.
Geopolitical Realignment: Expansion reflects a conscious effort to balance global power dynamics. Including Middle Eastern and African states allows BRICS to exert influence in regions traditionally dominated by Western interests.
Strengthening Institutions: More members allow for larger pooled resources, broader policy coordination, and enhanced institutional mechanisms. Platforms like cross-border payment systems reduce reliance on Western-dominated networks and increase financial sovereignty.
South-South Cooperation: Expansion strengthens ties between developing nations, promoting trade, investment, and development cooperation outside the traditional North-South paradigm.
Beyond BRICS: Other Regional Alliances Driving Growth
While BRICS captures global attention, it is part of a broader ecosystem of regional alliances that foster economic integration, peace, and development. These alliances, often overlapping in membership or objectives, demonstrate that growth is increasingly collaborative and regionalized.
1. The Shanghai Cooperation Organization (SCO)
The SCO includes China, Russia, and several Central Asian countries, with India and Pakistan joining as full members. Its primary focus is on security cooperation, counterterrorism, and regional stability. However, economic integration is increasingly central to the SCO’s agenda. Infrastructure development, energy cooperation, and trade facilitation projects are driving growth across Central Asia and strengthening connectivity with South Asia.
2. The African Union (AU)
The AU seeks to unify the African continent politically and economically. The African Continental Free Trade Area (AfCFTA) is a landmark initiative under the AU’s banner, aiming to boost intra-African trade, harmonize tariffs, and attract investment. By fostering regional trade networks, the AU is creating a foundation for industrialization, job creation, and sustainable development across Africa.
3. The Association of Southeast Asian Nations (ASEAN)
ASEAN promotes regional stability and economic integration among Southeast Asian nations. Its emphasis on trade liberalization, coordinated industrial policies, and political dialogue has facilitated rapid economic growth and reduced regional conflicts. Initiatives like the ASEAN Economic Community (AEC) aim to create a single market with free flow of goods, services, and capital, enhancing the competitiveness of the region.
Economic Impacts of Regional Alliances
Regional alliances like BRICS, SCO, AU, and ASEAN have significant economic impacts that go far beyond bilateral trade deals:
Trade Facilitation: These alliances often reduce tariffs, streamline customs, and harmonize standards, making trade easier and more profitable. This results in stronger economic linkages and increased regional commerce.
Investment Promotion: Joint infrastructure projects, stable regulatory environments, and cooperative economic policies attract foreign direct investment (FDI) to member countries.
Infrastructure and Connectivity: Alliances fund cross-border infrastructure, such as roads, railways, energy grids, and ports, reducing logistical bottlenecks and enhancing productivity.
Technology and Innovation: Cooperative programs in research and development foster innovation, skills transfer, and capacity building across regions, boosting long-term growth potential.
Energy Security: Alliances help coordinate energy supply, investment in renewable energy, and resource management, ensuring stable energy for industrial and societal development.
For example, BRICS has been advancing renewable energy projects, digital payment systems, and cross-border investment funds, creating a more resilient and sustainable economic ecosystem.
Political and Strategic Significance
Economic growth is only one facet of regional alliances. Politically, these alliances provide platforms for smaller and emerging nations to assert their interests:
Global Governance Influence: By coordinating positions in institutions like the UN, IMF, and World Bank, these alliances challenge Western-dominated decision-making.
Conflict Mitigation: Regional platforms allow dialogue that can prevent conflicts or resolve disputes peacefully.
Geopolitical Leverage: By pooling resources and influence, alliances like BRICS can negotiate better trade deals, military agreements, and development funding.
In short, these alliances are shaping a world where power is increasingly shared, and decisions are not monopolized by a handful of Western countries.
Challenges Facing Regional Alliances
While promising, regional alliances are not without obstacles:
Divergent Interests: Member countries often have competing agendas, which can make collective decisions slow or fragile.
Geopolitical Rivalries: Regional tensions, historical disputes, or external interference can undermine cooperation.
Institutional Capacity: Building robust governance structures capable of managing complex initiatives requires significant effort and coordination.
However, these challenges are not insurmountable. They also provide opportunities to innovate governance structures, enhance dialogue, and build inclusive policies that drive sustainable growth.
Opportunities Ahead
The global economic and political landscape is in flux, and regional alliances are uniquely positioned to capitalize on emerging opportunities:
Digital Economy Integration: Blockchain, fintech, and digital trade platforms can facilitate faster, more secure, and transparent economic exchange.
Green Development: Alliances can drive large-scale investment in renewable energy, climate-resilient infrastructure, and sustainable agriculture.
Global Partnerships: While focused on regional integration, alliances can also engage in global partnerships to address transnational challenges like pandemics, climate change, and cyber security.
BRICS, for instance, is actively exploring digital currency collaborations, alternative global payment systems, and green financing initiatives, positioning its members for future economic resilience.
Conclusion: Towards a Multipolar, Collaborative Future
BRICS and regional alliances are more than diplomatic constructs—they are growth engines, innovation hubs, and vehicles for global influence. Through trade, investment, infrastructure development, and strategic coordination, these alliances are shaping the trajectory of global growth in the 21st century.
By embracing inclusivity, sustainability, and collaboration, BRICS and other regional alliances demonstrate a new model of development: one where countries work together across regions, balancing economic ambitions with political influence. As the world continues to evolve, these alliances will not just follow the trends—they will actively shape the economic, political, and technological architecture of tomorrow.
The journey of BRICS, from a small group of emerging economies to a broad coalition of global players, exemplifies the potential of collective action. And as other regional alliances expand and deepen, the vision of a multipolar, collaborative, and resilient world economy is becoming increasingly tangible.

Trading Strategies and Index Investing1. Introduction to Trading and Investing
At its core, trading is the act of buying and selling financial instruments—stocks, derivatives, currencies, or commodities—over short periods to profit from market fluctuations. Traders thrive on volatility and market movements, exploiting them with precise timing and strategy.
Investing, on the other hand, involves committing capital to financial assets with the expectation of long-term growth. Investors focus on fundamental analysis, value creation, and compounding returns over years or decades.
A sub-category of investing, index investing, is the practice of buying index funds or exchange-traded funds (ETFs) that track a market index, such as the S&P 500, Nifty 50, or Dow Jones Industrial Average. This approach simplifies portfolio management, reduces risk through diversification, and aligns with long-term wealth-building strategies.
While trading and investing may appear divergent, they are interconnected. Understanding both allows market participants to develop flexible strategies that balance risk and reward.
2. Understanding Trading Strategies
Trading strategies are structured approaches to buying and selling assets. Traders use them to capitalize on short-term price movements. These strategies vary widely in duration, complexity, and risk tolerance.
2.1 Types of Trading Strategies
Day Trading
Day traders buy and sell securities within the same trading day. They aim to profit from intraday price movements.
Techniques Used: Technical analysis, chart patterns, momentum indicators, and high-volume stocks.
Example: Buying a stock in the morning after observing a breakout pattern and selling before market close.
Swing Trading
Swing traders hold positions for several days or weeks to capitalize on short-term trends.
Techniques Used: Moving averages, RSI (Relative Strength Index), MACD (Moving Average Convergence Divergence), and Fibonacci retracement.
Example: Buying a stock when it dips to a support level and selling when it reaches resistance.
Scalping
Scalping is a high-frequency, ultra-short-term strategy aiming for small profits multiple times a day.
Techniques Used: Order book analysis, bid-ask spread, and micro-trends.
Example: Entering a trade to capture a 0.5% price movement repeatedly.
Position Trading
Position traders hold positions for months or even years. This is more aligned with investing but with a trading mindset.
Techniques Used: Technical trends, economic indicators, and long-term chart patterns.
Example: Investing in a technology stock for 12 months based on growth projections.
Algorithmic Trading
Uses computer algorithms to execute trades automatically based on predefined criteria.
Techniques Used: Quantitative models, machine learning, backtesting, and high-frequency trading.
Example: A bot programmed to buy stocks when the 50-day moving average crosses above the 200-day moving average.
2.2 Key Principles of Trading
Risk Management: Traders must define stop-loss and target levels to protect capital.
Discipline: Following strategies without emotional interference is critical.
Market Analysis: Combining technical and fundamental analysis improves decision-making.
Liquidity Awareness: Trading assets with high liquidity ensures smoother entry and exit points.
2.3 Tools Used in Trading
Technical Indicators: RSI, MACD, Bollinger Bands, and moving averages help spot trends.
Chart Patterns: Head & shoulders, double tops, and triangles indicate potential reversals or breakouts.
News and Events: Earnings reports, economic data, and geopolitical developments impact market sentiment.
Trading Platforms: Real-time data, analytics tools, and order execution software are essential.
3. Understanding Index Investing
Index investing is a long-term strategy aimed at replicating the performance of a market index rather than picking individual stocks. This method offers diversification, cost-efficiency, and lower risk.
3.1 What is an Index?
A market index is a statistical measure that reflects the performance of a specific group of securities. Examples include:
S&P 500 (USA): Represents 500 large-cap U.S. companies.
Nifty 50 (India): Tracks 50 major Indian companies.
Dow Jones Industrial Average: Monitors 30 prominent U.S. companies.
Investors can buy index funds or ETFs to replicate these indices without having to purchase individual stocks.
3.2 Advantages of Index Investing
Diversification: Exposure to multiple stocks reduces risk compared to investing in a single company.
Lower Costs: Passive management reduces transaction and management fees.
Consistent Returns: Historically, broad-market indices tend to grow steadily over time.
Simplicity: Investors don’t need to analyze individual stocks continuously.
3.3 Types of Index Funds
Mutual Fund Index Funds: Professionally managed funds tracking specific indices.
Exchange-Traded Funds (ETFs): Trade like stocks and mimic index performance.
Sector-Specific Index Funds: Track specific sectors like technology or energy.
3.4 Index Investing Strategies
Buy-and-Hold: Purchase an index fund and hold it for decades, allowing compounding to work.
Dollar-Cost Averaging (DCA): Invest fixed amounts regularly to smooth out market volatility.
Rebalancing: Adjust portfolio weights periodically to maintain desired risk levels.
Dividend Reinvestment: Reinvest dividends from index funds to accelerate growth.
4. Combining Trading and Index Investing
While trading seeks short-term gains and index investing targets long-term growth, combining both can enhance portfolio performance.
4.1 Tactical Asset Allocation
Investors can allocate a portion of their portfolio to active trading while keeping the majority in index funds for stability. This balances growth potential with risk management.
4.2 Hedging Strategies
Traders can hedge index investments using derivatives like options and futures to protect against market downturns. For example:
Buying put options on an index fund to limit potential losses.
Using futures contracts to hedge exposure during periods of high volatility.
4.3 Sector Rotation
Traders can actively switch exposure among sectors while keeping the core of their portfolio in broad-market indices. This exploits cyclical trends while maintaining long-term market alignment.
5. Risk Management in Trading and Index Investing
Effective risk management is vital to prevent catastrophic losses.
5.1 Trading Risk Management
Stop-Loss Orders: Automatically sell an asset when it reaches a predefined price.
Position Sizing: Allocate capital proportionally to the risk level of each trade.
Diversification: Avoid over-concentration in a single asset or sector.
5.2 Index Investing Risk Management
Diversification Across Indices: Spread investments across multiple indices to reduce systemic risk.
Global Exposure: Include international index funds to hedge against domestic market volatility.
Rebalancing: Maintain the portfolio’s risk profile by adjusting asset allocation periodically.
6. Behavioral Factors in Trading and Investing
Human psychology plays a significant role in both trading and investing:
Greed and Fear: Traders often make impulsive decisions during market extremes.
Loss Aversion: Investors may hold losing positions too long due to emotional attachment.
Overconfidence: Excessive trading can reduce long-term returns.
Discipline and Patience: Successful investors and traders follow strategies systematically.
Understanding these biases helps individuals maintain rational decision-making.
Conclusion
Both trading strategies and index investing play essential roles in modern financial markets. While trading offers opportunities for short-term gains, index investing provides long-term wealth accumulation with lower risk. Understanding their principles, risk factors, and tools enables market participants to build a balanced portfolio that combines growth, stability, and flexibility.
By integrating the tactical precision of trading with the steady compounding of index investing, investors can navigate the complexities of financial markets with confidence, resilience, and strategic foresight.
From Barter to Blockchain: The Evolution of the World EconomyPart I: The Age of Barter – Foundations of Exchange
1. The Nature of Barter
Barter was the earliest form of trade. In primitive societies, people exchanged what they had in surplus for what they lacked. A farmer with extra grain might trade with a potter who could provide cooking vessels. A shepherd could exchange wool for salt from a coastal trader.
Barter was built on trust and immediate need. But while it served as the foundation of early economies, it had major limitations:
Double Coincidence of Wants: Both parties had to want what the other had at the same time.
Indivisibility: Some goods couldn’t be easily divided (you couldn’t trade half a cow).
Lack of Standard Value: No universal way to measure how many pots equaled one sheep.
Perishability: Many goods (grain, fish, fruit) couldn’t be stored long enough to retain value.
Despite its inefficiencies, barter laid the groundwork for trade and specialization. It fostered relationships, built early markets, and prepared the way for more sophisticated systems.
2. Social and Cultural Dimensions of Barter
Barter wasn’t just economic; it was cultural. Exchanges often happened within rituals, festivals, and ceremonies. In some tribes, barter carried symbolic meaning—gifts exchanged not only for material benefit but also to strengthen alliances. In this sense, the first economy was as much about community and survival as about profit.
Part II: The Rise of Money – Coinage and Currency
1. Commodity Money
To overcome barter’s limitations, societies began using commodity money—items with intrinsic value that could serve as a medium of exchange. Examples include:
Salt (ancient Rome)
Cowrie shells (Africa and Asia)
Cocoa beans (Aztecs)
Metal ingots (Mesopotamia, China)
These items were widely desired, portable, and relatively durable, making them more efficient than barter.
2. The Birth of Coinage
Around 600 BCE, the kingdom of Lydia (modern-day Turkey) minted the first standardized coins from electrum, a naturally occurring alloy of gold and silver. Coins revolutionized trade:
They were durable and easy to carry.
Their stamped markings guaranteed authenticity and value.
They standardized trade across regions.
As empires expanded—Greek, Roman, Persian, Chinese—coins became symbols of state power. The ruler’s face on currency projected authority and control over economic life.
3. Paper Money and Banking Innovations
China pioneered paper money during the Tang and Song dynasties (7th–11th centuries). Marco Polo later marveled at its use when he visited China in the 13th century. Paper money was lighter, more portable, and easier to produce than coins.
Meanwhile, medieval Europe saw the rise of banks and financial instruments like bills of exchange, which facilitated long-distance trade without carrying physical money. The Italian city-states—Florence, Venice, Genoa—became financial hubs. Banking families like the Medicis laid the foundation for modern finance.
Part III: The Age of Exploration and Mercantilism
1. Trade Routes and Global Connections
The 15th–17th centuries witnessed the opening of sea routes that connected continents. Europe’s search for spices, silk, and precious metals led to the Age of Exploration. Portuguese, Spanish, Dutch, and British empires established colonies, exploiting resources and building global trade networks.
The Silk Road connected East and West long before, but maritime routes expanded trade volumes exponentially.
The Columbian Exchange introduced new crops and goods across continents—potatoes and maize to Europe, horses and wheat to the Americas.
2. Mercantilism – Wealth as Power
Mercantilism dominated economic thought from the 16th to 18th centuries. Nations believed wealth equaled power, and wealth was measured in precious metals like gold and silver. Governments tightly controlled trade, imposed tariffs, and established monopolies through chartered companies like the British East India Company.
While mercantilism encouraged exploration and colonial expansion, it also fueled wars, exploitation, and inequality between colonizers and colonies.
Part IV: The Industrial Revolution and Capitalism
1. Industrialization Changes Everything
The late 18th and 19th centuries brought the Industrial Revolution—an economic turning point. Innovations like the steam engine, spinning jenny, and mechanized looms transformed production. Factories replaced workshops, and mass production replaced handicrafts.
This shift had profound consequences:
Urbanization as people moved to cities for factory work.
Rise of wage labor and the working class.
Massive increases in productivity and wealth creation.
Expansion of railways and steamships accelerated global trade.
2. The Growth of Capitalism
Capitalism thrived during industrialization. Private ownership, competition, and the pursuit of profit drove innovation. Stock markets expanded, providing capital for new industries. Banks and joint-stock companies became central players in financing economic growth.
However, capitalism also generated inequality, labor exploitation, and periodic financial crises. These tensions gave rise to labor movements, socialist critiques, and eventually regulatory reforms.
Part V: Globalization and the 20th-Century Economy
1. World Wars and Reconstruction
The two World Wars disrupted global trade and devastated economies. But they also led to the establishment of international institutions to rebuild and stabilize the global economy.
Bretton Woods Conference (1944) created the International Monetary Fund (IMF) and World Bank.
The U.S. dollar became the anchor of the new international monetary system.
2. Rise of Multinational Corporations
Post-war reconstruction and technological advances gave rise to multinational corporations. Companies like Coca-Cola, IBM, Toyota, and later Apple and Microsoft expanded worldwide, linking economies more closely than ever before.
3. The Digital and Information Economy
The late 20th century introduced a new era: computers, the internet, and information technology. Economies shifted from manufacturing-based to knowledge-based. Information became as valuable as physical goods. Global trade accelerated with container shipping, jet travel, and digital communication.
Part VI: The Blockchain Era – A New Frontier
1. The Origins of Blockchain
In 2008, during the global financial crisis, a mysterious figure (or group) named Satoshi Nakamoto introduced Bitcoin, a decentralized digital currency powered by blockchain technology. Blockchain is a distributed ledger system that records transactions securely, transparently, and without the need for central intermediaries like banks.
2. Features of Blockchain
Decentralization: No single authority controls the network.
Transparency: Every transaction is recorded and visible.
Security: Cryptography ensures data integrity.
Programmability: Smart contracts allow self-executing agreements.
3. Cryptocurrencies and Beyond
Bitcoin paved the way for thousands of cryptocurrencies (Ethereum, Ripple, Solana, etc.). Beyond currencies, blockchain is transforming industries:
Finance: Decentralized finance (DeFi) challenges traditional banking.
Supply Chains: Transparent tracking of goods.
Healthcare: Secure sharing of patient records.
Voting Systems: Tamper-proof elections.
4. Challenges and Criticisms
Blockchain isn’t without problems:
Scalability issues (slow transaction speeds compared to Visa/Mastercard).
Energy consumption (especially Bitcoin mining).
Regulatory uncertainty and risks of misuse (fraud, money laundering).
Still, blockchain represents the latest stage in humanity’s effort to make economic exchange more efficient, secure, and global.
Conclusion – The Next Chapter
The journey from barter to blockchain is not just about economics; it’s about human progress. Every step was driven by the desire to trade more easily, store value more securely, and build systems that could sustain larger and more complex societies.
The question now is: what comes after blockchain? Will artificial intelligence merge with finance to create self-governing economic systems? Will central banks launch their own digital currencies to replace cash entirely? Or will humanity rediscover the value of local, community-based exchange in an age of global complexity?
What is certain is that the evolution of the world economy will continue. Just as the people who bartered sheep for grain could never have imagined Bitcoin wallets, we too cannot fully predict the next leap. But history teaches us one lesson: the world economy is a living system, constantly evolving—and each new phase brings both opportunities and challenges for humanity to navigate.
CPI Data: The Silent Navigator of Currencies, CommoditiesChapter 1: Understanding CPI – The Pulse of Inflation
What is CPI?
The Consumer Price Index is a statistical measure that tracks changes in the price of a basket of goods and services consumed by households. This basket includes categories like:
Food and beverages
Housing and utilities
Transportation
Healthcare
Education
Recreation
Every month, agencies such as the U.S. Bureau of Labor Statistics (BLS), Eurostat, or India’s Ministry of Statistics and Programme Implementation (MoSPI) publish CPI data. Economists parse it to gauge how much everyday living costs have risen or fallen compared to a base year.
Why is CPI Important?
Central Banks: CPI determines whether interest rates should rise (to cool inflation) or fall (to stimulate growth).
Investors: CPI expectations guide bond yields, equity valuations, and commodity demand forecasts.
Governments: CPI affects wage negotiations, pensions, and social security adjustments.
Traders: Currency and commodity traders watch CPI closely for clues about future price movements.
Simply put, CPI is not just a statistical tool—it is the heartbeat of economic policy.
Chapter 2: CPI and Currencies – The Exchange Rate Compass
The Inflation-Interest Rate-Currency Triangle
Currency markets thrive on interest rate differentials between countries. And interest rates, in turn, are deeply tied to CPI. Here’s how the triangle works:
High CPI (Inflation Rising) → Central bank likely raises rates → Higher yields attract capital inflows → Currency strengthens.
Low CPI (Weak Inflation/Deflation) → Central bank cuts rates → Yields fall → Capital outflows → Currency weakens.
For example:
When U.S. CPI surges above expectations, markets anticipate the Federal Reserve will tighten monetary policy. This strengthens the U.S. dollar, often at the expense of emerging market currencies.
Conversely, when Japan’s CPI lingers near zero, it signals low inflation. The yen often weakens, especially if other countries raise rates.
CPI Surprises and Market Reactions
Currency traders pay close attention not just to CPI levels, but to surprises—the gap between expected and actual data.
A higher-than-expected CPI often sparks immediate dollar rallies.
A weaker-than-expected CPI can trigger sell-offs.
In short, CPI is the silent hand guiding daily forex volatility.
Chapter 3: CPI and Commodities – Pricing the Essentials
Inflation’s Direct Impact on Commodities
Commodities like oil, gold, copper, and wheat are real assets whose prices react strongly to inflationary signals.
Oil and Energy: Rising CPI often reflects higher energy costs. But paradoxically, higher inflation expectations can boost crude oil demand as traders hedge against future price surges.
Gold: Known as the “inflation hedge,” gold tends to rally when CPI rises sharply, as investors seek protection against currency depreciation.
Agricultural Commodities: Food inflation reflected in CPI often mirrors supply shocks in wheat, rice, or corn. Countries may adjust imports or exports based on these signals.
Feedback Loops
The relationship between CPI and commodities is not one-way. Commodities themselves often drive CPI readings. For instance:
A global spike in crude oil raises transportation and manufacturing costs, showing up as higher CPI.
Droughts that raise food prices also push CPI upward.
Thus, CPI is both a mirror (reflecting commodity movements) and a magnet (attracting speculative flows into commodities).
Chapter 4: CPI and Trade Routes – The Invisible Mapmaker
Inflation and Trade Balances
Inflation levels affect a country’s trade competitiveness:
High CPI → Domestic goods become expensive → Exports lose competitiveness → Imports rise → Trade deficits widen.
Low CPI → Domestic goods remain affordable → Exports rise → Trade surpluses build.
For example:
Persistent high inflation in Argentina has eroded its export competitiveness, forcing adjustments in trade partnerships.
Germany, historically with low inflation, often maintains strong export surpluses.
CPI as a Navigator of Trade Routes
Trade routes are not just about geography; they are shaped by economic viability. Inflation indirectly alters routes by shifting trade demand.
If Europe faces high inflation while Asia’s CPI remains controlled, Asian goods look cheaper. Shipping companies redirect routes toward Asian suppliers.
If U.S. inflation surges, import demand may weaken, leading to adjustments in trans-Pacific shipping volumes.
Case Study: Inflation and Shipping Costs
In 2021–2022, global CPI spikes—driven by energy and food—coincided with record-high shipping costs. As inflation rose, freight companies restructured routes to prioritize high-demand sectors, such as food imports over luxury goods. CPI data, therefore, indirectly reshaped trade flows.
Chapter 5: CPI, Central Banks, and Global Policy Coordination
CPI does not exist in isolation; it anchors monetary diplomacy across nations.
The U.S. Federal Reserve: Because the U.S. dollar underpins global trade, U.S. CPI announcements ripple worldwide. A high U.S. CPI forces the Fed to hike rates, strengthening the dollar and raising borrowing costs globally.
European Central Bank (ECB): CPI-driven policy changes affect the euro, which impacts intra-European trade flows.
Emerging Economies: Countries like India or Brazil often adjust subsidies, tariffs, or interest rates in response to CPI to safeguard trade competitiveness.
When multiple nations face similar CPI-driven pressures, we see global coordination (or conflict). For example, in the 1970s oil crisis, surging CPI forced many central banks to raise rates simultaneously, tightening global liquidity.
Chapter 6: CPI in Geopolitics and Economic Strategy
CPI as a Political Tool
Governments know voters feel inflation viscerally. CPI spikes often translate into political instability. Leaders facing high CPI tend to:
Subsidize imports of food or fuel.
Strengthen ties with low-cost trading partners.
Impose export bans to protect domestic consumers.
Thus, CPI can even redirect geopolitical alliances.
Inflation and Trade Wars
Persistent CPI pressures often trigger protectionist policies. For example:
High U.S. CPI has historically fueled tariff debates on Chinese imports.
Emerging nations with food inflation often restrict exports, reshaping global supply chains.
In this sense, CPI silently redraws maps of economic power.
Conclusion
The Consumer Price Index may look like a dry statistical release, but it is one of the most powerful silent forces shaping global finance and trade. From guiding central bank decisions to shifting the tides of forex markets, from influencing commodity hedging to redrawing shipping routes, CPI is everywhere.
It doesn’t shout like wars or pandemics, but whispers through spreadsheets and trading desks—subtly yet decisively navigating the economic world.
In an interconnected age, understanding CPI is not just for economists. Traders, policymakers, and businesses alike must treat it as the silent navigator that determines the currents of currencies, commodities, and trade routes.
Sea Routes & Supply Chains1. The Historical Foundation of Sea Routes
1.1 Ancient Maritime Trade
Maritime trade is as old as civilization itself.
The Phoenicians of the Mediterranean (around 1500 BCE) mastered navigation and spread commerce across North Africa, the Middle East, and Southern Europe.
The Silk Road by sea connected China, India, Arabia, and Africa, long before modern globalization. Spices, silk, and precious stones moved across oceans, shaping cultures and economies.
In South Asia, the Indian Ocean trade system linked ports from East Africa to Southeast Asia. Seasonal monsoon winds powered dhows and junks carrying pepper, gold, and textiles.
1.2 Age of Exploration and Colonization
The 15th and 16th centuries marked a turning point. European powers—Portugal, Spain, the Netherlands, and later Britain—sought new sea routes to bypass land-based trade monopolies.
Vasco da Gama’s voyage to India (1498) opened Europe to Asian spices.
Columbus’s Atlantic crossing linked Europe with the Americas.
Britain’s mastery of naval power allowed it to dominate maritime routes, turning sea trade into imperial control.
Sea routes became instruments of wealth and power, laying the groundwork for today’s globalized supply chains.
2. Sea Routes: The Arteries of Modern Trade
2.1 Major Maritime Routes
Modern maritime trade relies on established routes shaped by geography and economics.
The Suez Canal Route: Connecting Europe and Asia via the Mediterranean and Red Sea. It shortens the Europe-Asia journey by nearly 7,000 km compared to circumnavigating Africa.
The Strait of Hormuz: A narrow chokepoint through which one-fifth of the world’s oil supply passes.
The Strait of Malacca: Linking the Indian and Pacific Oceans, this is one of the busiest shipping lanes in the world.
The Panama Canal: Vital for connecting the Atlantic and Pacific, especially for trade between the Americas and Asia.
The Trans-Pacific Route: Connecting East Asian manufacturing hubs (China, Japan, South Korea) with North American markets.
The Trans-Atlantic Route: Linking Europe and North America, critical for goods, energy, and raw materials.
2.2 Strategic Chokepoints
These routes rely on chokepoints, narrow maritime passages that, if disrupted, can cripple trade. The Strait of Hormuz, Malacca, and Bab el-Mandeb are classic examples. Piracy, blockades, or accidents in these areas can trigger global economic shockwaves—as seen when the Ever Given blocked the Suez Canal in 2021.
2.3 Cargo Diversity
Sea routes transport a staggering variety of goods:
Bulk commodities: oil, coal, iron ore, grains.
Containerized goods: electronics, apparel, machinery.
Liquefied gases: LNG and LPG.
Specialized cargo: cars, chemicals, refrigerated food (reefer containers).
The efficiency of sea routes lies in their ability to handle massive volumes cheaply compared to air or land transport.
3. Supply Chains: The Skeleton Behind Sea Routes
3.1 What Is a Supply Chain?
A supply chain is the entire process of sourcing, manufacturing, and delivering goods. It includes suppliers, factories, warehouses, transport hubs, shipping lines, and retailers. Sea routes act as international connectors within this chain.
3.2 Globalization and the Rise of Complex Supply Chains
From the late 20th century, businesses adopted “just-in-time” production to minimize inventory and reduce costs. Manufacturers sourced parts globally, relying on efficient shipping. For example:
A smartphone may have components from South Korea, semiconductors from Taiwan, assembly in China, and final sales in the U.S.
Automakers source steel from Brazil, engines from Germany, and wiring harnesses from Mexico.
Sea routes enable this complex web, making supply chains international in scope.
3.3 Containerization Revolution
The introduction of the shipping container in the 1950s revolutionized logistics. Standardized containers allowed goods to move seamlessly between ships, trains, and trucks. This reduced theft, increased efficiency, and lowered shipping costs dramatically. Today, mega-container ships can carry over 20,000 TEUs (Twenty-foot Equivalent Units), making sea transport the backbone of global supply chains.
4. Geopolitics of Sea Routes and Supply Chains
4.1 Naval Power and Trade Control
Sea routes are not just commercial pathways but also strategic assets. Countries with strong navies—like the U.S., China, and historically Britain—use maritime dominance to secure trade. Control over chokepoints gives nations leverage in global politics.
4.2 Belt and Road Initiative (BRI)
China’s Maritime Silk Road, part of the BRI, seeks to expand its influence by investing in ports and shipping infrastructure worldwide. From Gwadar in Pakistan to Piraeus in Greece, China is reshaping maritime geopolitics.
4.3 Trade Wars and Supply Chain Shifts
U.S.–China tensions have exposed vulnerabilities in supply chains. Companies are “China+1” strategies, diversifying manufacturing to Vietnam, India, or Mexico. Yet, all these shifts still depend on sea routes for global distribution.
4.4 Vulnerability to Conflict
Conflicts in Ukraine, the South China Sea, or the Middle East can disrupt supply chains. Sanctions and blockades weaponize trade routes, showing how economic security is intertwined with geopolitics.
5. Challenges Facing Sea Routes and Supply Chains
5.1 Disruptions
Pandemics: COVID-19 exposed supply chain fragility when ports shut down, containers piled up, and shipping costs soared.
Piracy: Particularly in the Gulf of Aden and parts of Southeast Asia.
Climate Change: Rising sea levels, stronger storms, and melting Arctic ice are reshaping routes.
5.2 Environmental Concerns
Shipping contributes about 3% of global CO₂ emissions. Heavy fuel oil pollutes air and oceans, prompting stricter environmental regulations. The push for green shipping—using LNG, hydrogen, or wind-assisted propulsion—is gaining momentum.
5.3 Infrastructure Strain
Mega-ships require deeper ports and better logistics hubs. Not all regions can afford the infrastructure, creating bottlenecks in global trade.
6. The Future of Sea Routes and Supply Chains
6.1 Technological Transformation
Digitalization: Blockchain and AI are streamlining documentation and tracking shipments.
Autonomous Ships: Trials are underway for crewless vessels that reduce costs and risks.
Smart Ports: Automated cranes and AI-driven logistics increase efficiency.
6.2 Arctic Sea Routes
As ice melts, the Northern Sea Route along Russia and the Northwest Passage through Canada are becoming viable. These routes cut travel time between Asia and Europe but raise environmental and sovereignty concerns.
6.3 Regionalization vs. Globalization
Some argue the world is moving towards regional supply chains due to geopolitical tensions and resilience concerns. For instance, the EU encourages near-shoring manufacturing, while the U.S. promotes domestic chip production. However, sea routes will remain indispensable for intercontinental trade.
6.4 Resilient Supply Chains
Companies are rethinking strategies:
Building redundancy (multiple suppliers).
Increasing stockpiles of critical goods (semiconductors, medicines).
Investing in predictive analytics for disruptions.
Conclusion
Sea routes and supply chains truly are the hidden arteries of the global economy. From the spice traders of antiquity to the container ships of today, oceans have been the lifeblood of commerce and civilization. They connect continents, fuel industries, and ensure the smooth functioning of daily life. Yet, they remain vulnerable to geopolitical rivalries, environmental pressures, and technological disruptions.
As the world faces climate change, rising protectionism, and shifting power balances, the future of sea routes and supply chains will demand innovation, resilience, and cooperation. They may be invisible to the average consumer, but every time someone picks up a smartphone, drinks coffee, or fills their car with fuel, they are directly benefiting from the silent yet powerful arteries that keep the global economy alive.
Financial Market CoverageUnderstanding the Backbone of Modern Finance
Introduction
Financial markets are the lifeblood of the global economy. They provide the infrastructure for the allocation of capital, risk management, and wealth creation. However, the true power of financial markets lies not just in their existence, but in how they are observed, analyzed, and reported. This is where financial market coverage comes in—an essential mechanism that informs investors, regulators, policymakers, and the public about the constantly evolving financial ecosystem.
Financial market coverage is more than reporting stock prices or bond yields. It encompasses the analysis of macroeconomic trends, corporate performance, policy changes, market sentiment, and geopolitical events. Effective coverage ensures transparency, fosters confidence, and enables participants to make informed decisions. In this discussion, we will explore the scope, methods, challenges, and future of financial market coverage.
The Scope of Financial Market Coverage
Financial market coverage extends across multiple segments, each with its unique nuances and stakeholders. Key areas include:
1. Equity Markets
Equity markets, or stock markets, are arguably the most visible segment. Coverage here involves:
Stock Price Movements: Tracking real-time prices, indices, and market trends.
Company Analysis: Evaluating earnings, management strategies, mergers, acquisitions, and other corporate actions.
Sectoral Analysis: Comparing performance across sectors such as technology, healthcare, or energy.
Market Sentiment: Understanding investor psychology through trading volume, options activity, and news flow.
2. Fixed Income and Bond Markets
Bond markets are critical for funding governments and corporations. Coverage involves:
Yield Movements: Monitoring interest rate trends, yield curves, and bond spreads.
Credit Analysis: Assessing corporate and sovereign creditworthiness.
Policy Implications: Evaluating central bank actions and their effects on debt markets.
3. Derivatives and Commodities
Derivatives such as futures and options provide hedging and speculative opportunities. Coverage includes:
Price Volatility: Tracking commodity prices (oil, gold, agricultural products) and derivative contracts.
Market Structure: Observing open interest, options chains, and leverage trends.
Risk Indicators: Monitoring implied volatility indices like VIX.
4. Foreign Exchange and Currency Markets
The forex market is the largest and most liquid. Coverage includes:
Currency Pairs: Tracking movements in major and emerging market currencies.
Global Trade Impacts: Understanding how exchange rate fluctuations affect trade and investment.
Central Bank Interventions: Monitoring interest rate decisions and monetary policy adjustments.
5. Alternative Investments
Alternative assets such as private equity, hedge funds, and cryptocurrencies are increasingly covered due to their growing influence. Coverage examines:
Market Trends: Adoption rates, liquidity, and performance metrics.
Regulatory Risks: Monitoring government policies and enforcement actions.
Investor Interest: Tracking institutional and retail participation.
Methods and Channels of Financial Market Coverage
Financial market coverage employs multiple methods, tools, and media channels:
1. Traditional Media
Newspapers and Magazines: Financial dailies like The Wall Street Journal and Economic Times provide daily market summaries.
Television Channels: CNBC, Bloomberg TV, and local financial channels offer live analysis and expert interviews.
Radio and Podcasts: Financial talk shows provide commentary and insights for casual investors.
2. Digital Platforms
Financial Websites and Portals: Platforms like Bloomberg, Reuters, and Moneycontrol deliver real-time updates.
Mobile Apps: Trading apps and news apps provide push notifications and analytical tools.
Social Media: Twitter, LinkedIn, and specialized forums allow rapid dissemination and crowd-sourced sentiment.
3. Analytical Tools
Charting Software: Technical analysis relies on historical price charts and pattern recognition.
Financial Models: Fundamental analysis uses valuation models, discounted cash flows, and ratios.
AI and Big Data: Machine learning models analyze vast datasets to predict market trends and detect anomalies.
4. Institutional Reports
Brokerage Reports: Analysts provide in-depth research reports with buy/sell recommendations.
Investment Bank Publications: Macro and sectoral insights influence market perception and trading strategies.
Regulatory Disclosures: Filings such as 10-Ks, 10-Qs, and prospectuses provide authoritative information.
The Role of Financial Journalists and Analysts
Coverage is not just about raw data; interpretation is critical. Financial journalists and analysts bridge this gap:
Journalists: Provide context, highlight market-moving news, and summarize complex events in understandable language.
Analysts: Offer technical insights, forecasts, and actionable recommendations.
Influencers and Educators: Thought leaders shape sentiment and influence retail participation.
A balanced coverage ecosystem combines speed with accuracy, commentary with data, and local insights with global perspective.
Importance of Financial Market Coverage
1. Promotes Transparency
Timely coverage ensures that market participants have access to relevant information, reducing information asymmetry.
2. Enhances Market Efficiency
Markets respond more accurately when participants are informed, contributing to better price discovery.
3. Guides Investment Decisions
Coverage helps investors identify opportunities, manage risk, and adjust strategies in volatile conditions.
4. Supports Policymaking
Regulators and central banks monitor market coverage to gauge sentiment, liquidity conditions, and systemic risks.
5. Educates the Public
Effective reporting demystifies markets for retail investors, empowering financial literacy and participation.
Challenges in Financial Market Coverage
Despite its critical role, coverage faces several challenges:
1. Information Overload
The sheer volume of financial news can overwhelm investors, making it difficult to distinguish signal from noise.
2. Speed vs. Accuracy
In the digital age, the pressure to report first can compromise accuracy.
3. Bias and Conflicts of Interest
Analyst recommendations and media reporting may be influenced by corporate sponsorships or personal interests.
4. Complexity of Modern Markets
Derivatives, algorithmic trading, and decentralized finance (DeFi) make coverage increasingly technical and challenging.
5. Global Interconnectedness
Events in one country can trigger cascading effects worldwide, demanding comprehensive, real-time coverage.
Conclusion
Financial market coverage is far more than a reporting mechanism; it is a critical pillar of modern financial systems. It informs, guides, and protects the interests of investors, institutions, and regulators. In an era of rapid information flow, complex instruments, and interconnected economies, high-quality coverage ensures that markets remain transparent, efficient, and fair.
As technology evolves and markets become more sophisticated, the role of coverage will expand further, blending real-time data, advanced analytics, and global insights. For any market participant, understanding financial market coverage is no longer optional—it is an essential part of navigating the intricate world of finance.

XAUUSD – End of Week U.S. Session | Trading SetupHello traders,
Today's gold trading range is quite narrow. As of now, the gold price remains steady around the 366x region.
The overall price structure hasn't changed from the previous scenario: we continue to wait to sell at the higher 367x level to secure a better position for the Sell signal. This approach helps optimize profit potential and aims for greater returns.
Market sentiment today seems cautious. Following the release of interest rate news, most investors are staying on the sidelines, resulting in no significant changes in trading volume.
Today's U.S. session trading scenario
Sell Setup (priority)
Sell Liquidity Zone: 3677 – 3680
SL: 3685
TP: 3650 – 3635 – 3627 – 3615 – 3600
Buy Scalping
Buy Zone 1: 3613 – 3615 | SL: 3608 | TP: 3625 – 3638 – 3645
Buy Zone 2: 3595 – 3598 | SL: 3590 | TP: 3610 – 3625 – 3638 – 3645 – 3670
Conclusion
In the end-of-week U.S. session, the priority strategy remains to Sell at higher price levels to ensure a safe position and good profit expectations. Short-term Buy orders should only be considered when the price hits the strong support zones mentioned.
Wishing everyone a disciplined and successful end-of-week trading session! Stay tuned for the quickest updates when the price structure changes.
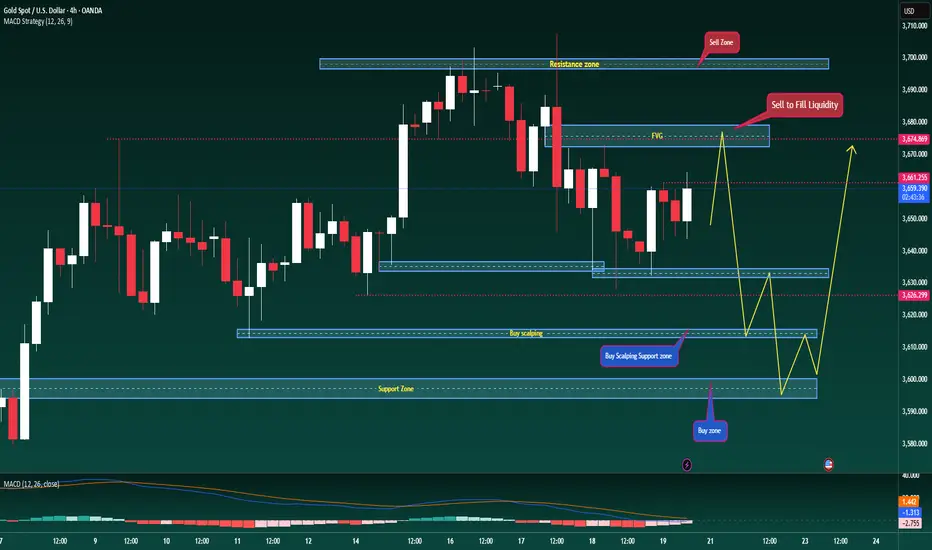
XAUUSD – Correction Target on H4
Technical Analysis
After reacting at the Sell Zone – FVG around 3,670, Gold was unable to sustain its upward move and is now showing signs of weakness. The H4 structure suggests that the correction is extending, with price likely to retest key support zones below.
On the chart, the areas at 3,633–3,632 and 3,626 are acting as interim supports. If these levels fail to hold, bearish pressure could drive price deeper towards 3,614–3,612, before testing the main support confluence with Fibonacci extension and the potential Buy Zone around 3,579–3,560.
RSI is currently moving around 45–50, indicating that momentum is leaning towards a corrective phase rather than a strong bullish trend.
Trading Scenarios
SELL Setup (preferred):
Entry: on a retest of the 3,665–3,670 Sell Zone
Stop Loss: above 3,675
Target: 3,633–3,632, 3,626, 3,614–3,612, 3,579–3,560
BUY Setup (short-term / scalping):
Entry: consider longs around 3,626–3,625 support
Stop Loss: below 3,618
Target: 3,633, 3,645, 3,650
Key Levels to Watch
3,670: Sell Zone – confluence with FVG after FOMC.
3,633–3,626: Short-term support; a clear break would confirm extended downside pressure.
3,612: Critical level for near-term trend direction.
3,579–3,560: Potential Buy Zone and main corrective target on H4.
Keep these levels on watch and adjust trading plans accordingly. Follow for quicker access to future updates.

World Market Scalping: Turning Small Moves into Big Opportunitie1. What is Scalping?
At its core, scalping is a trading style where traders aim to profit from tiny price changes in financial instruments. Instead of chasing large trends or waiting for news-driven swings, scalpers focus on small, predictable moves that happen frequently.
A scalper might enter and exit a trade within seconds or minutes.
Profits per trade are usually small—sometimes just a few cents, ticks, or pips.
Success depends on volume of trades and high win rates.
Example:
If a scalper trades EUR/USD in forex, they might aim to capture 3–5 pips per trade. If they make 100 trades a day, those small profits add up significantly.
This philosophy is what makes scalping so appealing: small edges, multiplied over time, equal big opportunities.
2. Why World Markets are Ideal for Scalping
Scalping thrives where there is:
High Liquidity – Global markets like forex, S&P 500 futures, or gold have massive trading volumes. Liquidity ensures tight spreads and quick order execution.
Constant Volatility – Even when major markets are calm, smaller fluctuations happen continuously.
24/5 Trading Access – The forex market and global indices run almost around the clock, giving scalpers endless opportunities.
Global Interconnections – Events in one country (like a Fed decision in the US) ripple across global markets, creating intraday opportunities.
For these reasons, scalping in world markets is a natural fit for traders seeking consistent activity and endless setups.
3. The Psychology of a Scalper
Scalping isn’t for everyone—it demands a particular mindset:
Patience with small gains – Scalpers accept that $20 here and $30 there will compound over time.
Quick decision-making – Hesitation kills scalpers; opportunities vanish in seconds.
Emotional discipline – Frequent trades can test patience; overtrading or revenge trading must be avoided.
Laser focus – Scalpers may spend hours glued to the screen, monitoring every tick.
In world markets, where volatility can spike suddenly, this discipline becomes even more critical.
4. Tools of the Scalping Trade
Scalpers rely heavily on advanced tools. Some essentials include:
High-speed trading platforms (like MetaTrader, NinjaTrader, or Thinkorswim).
Direct market access (DMA) brokers for fast execution.
Charts with one-minute or tick data to capture micro-movements.
Volume and order flow indicators to see real-time buying and selling pressure.
Algorithmic support (EAs or bots) for ultra-fast setups.
Without speed, scalping in world markets is like bringing a knife to a gunfight.
5. Scalping Techniques in World Markets
Scalpers use various methods depending on the asset:
a) Forex Scalping
Targets small pip movements.
Strategies include spread scalping, news scalping, and EMA crossovers.
b) Stock Scalping
Focuses on highly liquid stocks (e.g., Apple, Tesla, Microsoft).
Uses Level 2 data and time & sales for precision.
c) Index Scalping
Popular in instruments like S&P 500 futures (ES), Dow Jones, or Nikkei 225.
Scalpers often follow global sessions (Asian, European, US) for volatility bursts.
d) Commodity Scalping
Crude oil and gold are favorites due to global demand.
News-driven micro-volatility provides scalpers with rapid opportunities.
e) Bond Market Scalping
Though slower, bond futures and yields react instantly to economic data.
Scalpers exploit these quick yield/price adjustments.
Each market has its nuances, but the common theme is speed + volume = success.
6. The Power of Compounding Small Wins
Let’s look at how tiny wins add up:
Suppose a scalper makes $20 per trade.
They execute 50 trades a day, winning 70% of them.
Net daily profit = around $600–700.
Over 20 trading days a month, that’s $12,000–14,000.
This compounding effect demonstrates why scalpers don’t chase “home runs”—they rely on base hits that add up to a win streak.
7. Risks of Scalping in Global Markets
Scalping is not without risks:
Execution Risk – Delayed fills can turn profits into losses.
High Costs – Commissions and spreads eat into small gains.
Overtrading – Scalpers can burn out mentally or financially.
Market Noise – Small moves may be random, creating false signals.
Global Shocks – Sudden news (like central bank surprises) can wipe out hours of gains.
Risk management (tight stop-losses, trade size control) is the lifeline of world market scalping.
8. How Global Events Shape Scalping Opportunities
Scalpers thrive on volatility. World markets provide plenty of it:
Central Bank Decisions – Fed, ECB, BOJ, etc., move currencies, indices, and bonds.
Geopolitical Events – Wars, sanctions, or elections create sudden bursts.
Economic Data Releases – Jobs reports, inflation data, GDP, etc.
Commodity Supply Shocks – OPEC announcements, natural disasters, etc.
For scalpers, these are golden windows to catch lightning-fast trades.
Conclusion
Scalping is not just a trading method—it’s a mindset, discipline, and lifestyle. In the world’s largest markets, where trillions of dollars flow daily, scalpers carve out their share by seizing micro-opportunities others overlook.
It’s not about predicting the future. It’s about reacting faster, managing risk smarter, and compounding small profits into life-changing results.
For traders who crave action, thrive under pressure, and believe in the power of “small edges repeated often,” world market scalping offers a gateway to consistent success.
The opportunities are endless—the question is whether you have the speed, discipline, and mindset to capture them.
Risk in International Market1. Understanding Risk in International Markets
Risk in international markets refers to the uncertainty of outcomes when engaging in cross-border transactions, investments, or trade. These risks can impact profitability, growth, and sustainability.
For example:
A company exporting goods to another country may face currency exchange fluctuations that erode profit margins.
A multinational corporation (MNC) investing in a politically unstable country may face expropriation or asset seizure.
A sudden tariff imposition or trade sanction could disrupt supply chains.
International risks are interconnected. An economic crisis in one country can trigger contagion effects worldwide. Thus, risk management in global markets requires a broad, multi-dimensional approach.
2. Categories of Risks in International Markets
International risks can be broadly classified into the following categories:
2.1 Political Risk
Political risk arises when government policies, political instability, or conflicts impact international trade and investment.
Examples: Nationalization of assets, sudden changes in trade regulations, wars, or regime changes.
Case Study: In 2014, many Western firms in Russia faced difficulties after sanctions and retaliatory measures disrupted business operations.
Subtypes:
Expropriation risk (government seizing foreign assets).
Political violence (civil war, terrorism, coups).
Regulatory changes (new trade barriers, taxes, or restrictions).
2.2 Economic and Financial Risk
Economic risk involves the uncertainty of operating in economies with unstable macroeconomic conditions.
Examples: Inflation, recession, unemployment, or sovereign debt crises.
Currency risk (Exchange Rate Volatility): A major component where fluctuating exchange rates can reduce profits.
Case Study: The Asian Financial Crisis (1997) saw many businesses collapse due to currency devaluation.
Subtypes:
Inflation risk
Interest rate risk
Liquidity risk
Balance of payments crisis
2.3 Currency and Exchange Rate Risk
Exchange rate fluctuations are one of the most common risks in global trade.
When a company exports goods, a sudden fall in the buyer’s currency reduces earnings when converted to the seller’s currency.
Importers face higher costs when their domestic currency depreciates.
Case Study: Indian IT companies billing in US dollars benefit from a stronger dollar, but importers of oil in India face higher costs when the rupee depreciates.
2.4 Legal and Regulatory Risk
International markets operate under diverse legal systems. A company must comply with multiple laws, including labor, taxation, intellectual property rights (IPR), and environmental regulations.
Examples:
A pharmaceutical company selling in Europe must comply with strict EU health and safety standards.
Data protection laws like GDPR affect global tech firms.
Failure to comply can lead to penalties, lawsuits, or bans.
2.5 Cultural and Social Risk
Culture impacts consumer behavior, workplace practices, and negotiations. Misunderstanding cultural norms can damage a company’s brand image.
Examples:
Marketing blunders due to mistranslation of slogans.
Fast-food chains adapting menus to local tastes (e.g., McDonald’s in India does not serve beef).
Cultural risks also affect labor relations, communication styles, and management practices.
2.6 Supply Chain and Operational Risk
In global trade, companies rely on complex supply chains. Disruptions at any point can impact operations worldwide.
Examples:
Natural disasters halting production.
Port strikes delaying shipments.
Shortages of raw materials.
Case Study: The COVID-19 pandemic disrupted global supply chains, causing shortages in semiconductors, medicines, and shipping delays.
2.7 Geopolitical and Security Risk
Tensions between countries can lead to sanctions, embargoes, or outright bans. Security risks such as terrorism, piracy, and cyber-attacks further complicate global trade.
Examples:
The US-China trade war caused tariffs and uncertainty in global supply chains.
Cyber-attacks on financial institutions threaten international capital flows.
2.8 Environmental and Sustainability Risk
Global businesses must consider environmental regulations, climate risks, and sustainability demands.
Examples:
Stricter carbon emission rules affecting manufacturing firms.
Climate change threatening agriculture and insurance industries.
Case Study: European Union’s Carbon Border Adjustment Mechanism (CBAM) impacts exporters from developing nations by imposing carbon tariffs.
2.9 Technological Risk
Technology drives global trade but also creates risks:
Cybersecurity threats.
Dependence on foreign technology providers.
Rapid technological obsolescence.
Example: Semiconductor shortages exposed the vulnerability of global industries dependent on a handful of suppliers.
2.10 Reputational Risk
A company’s reputation is global. A scandal in one country can affect its worldwide image.
Case Study: Volkswagen’s “Dieselgate” emissions scandal damaged its global reputation, leading to billions in losses.
3. Real-World Examples of International Market Risks
Brexit (2016–2020): Created uncertainty for businesses trading between the UK and EU, leading to tariffs, regulatory complications, and currency volatility.
COVID-19 Pandemic (2020–2022): A global supply chain crisis, demand shocks, and international border restrictions.
Russia-Ukraine War (2022 onwards): Caused oil price volatility, sanctions, and food supply disruptions.
US-China Trade War: Tariff escalations disrupted supply chains, affecting electronics, steel, and agriculture.
4. Impact of Risks on International Business
Profitability: Exchange rate swings and tariffs can reduce profit margins.
Market Entry Barriers: Political instability or protectionist policies deter investments.
Supply Chain Vulnerabilities: Disruptions increase operational costs.
Investor Confidence: Economic instability reduces foreign direct investment (FDI).
Strategic Shifts: Companies diversify operations to reduce overdependence on one country.
5. Strategies to Manage International Market Risks
5.1 Hedging and Financial Instruments
Use of derivatives like futures, options, and swaps to manage currency and interest rate risks.
Example: Exporters hedge against exchange rate volatility by locking in forward contracts.
5.2 Diversification
Geographic diversification reduces dependence on one market.
Supply chain diversification reduces risk from disruptions in one region.
5.3 Insurance
Political risk insurance protects companies against expropriation, terrorism, or war.
Trade credit insurance covers non-payment by foreign buyers.
5.4 Strong Legal Compliance
Understanding and complying with local laws reduces regulatory risk.
Companies often hire local legal experts.
5.5 Cultural Adaptation
Training employees in cross-cultural management.
Localizing products and marketing strategies.
5.6 Scenario Planning and Risk Assessment
Conducting “what-if” analyses to prepare for potential disruptions.
Example: Airlines hedge fuel costs against oil price fluctuations.
5.7 Building Resilient Supply Chains
Developing multiple suppliers.
Using digital technologies (AI, blockchain) for supply chain transparency.
5.8 Sustainability and ESG Practices
Adopting environmentally responsible strategies reduces reputational and regulatory risks.
Attracts socially conscious investors.
6. The Future of Risk in International Markets
Global risks are evolving rapidly:
Climate change will intensify natural disasters and regulatory pressures.
Technological risks will grow with AI, automation, and cybersecurity challenges.
Geopolitical rivalries (US-China, Russia-West) will increase uncertainty.
Global financial risks like debt crises and inflationary pressures may spread faster due to interconnected economies.
Companies of the future must adopt resilient, adaptive, and technology-driven risk management frameworks.
Conclusion
International markets present unparalleled opportunities, but they are inherently riskier than domestic markets. Risks in the international market stem from politics, economics, culture, law, technology, environment, and global interconnectedness.
Businesses that succeed in global markets are not those that avoid risks entirely but those that anticipate, assess, and strategically manage risks. From hedging financial exposures to diversifying supply chains, from complying with local laws to embracing sustainability, risk management is the backbone of international business success.
As the global economy grows more complex, the key will be resilience: the ability to withstand shocks, adapt to new realities, and continue to thrive despite uncertainty.

Sanctioned EconomiesIntroduction
Sanctions have become one of the most powerful tools in modern international relations. Instead of deploying armies or engaging in direct conflict, powerful nations and global institutions often turn to economic sanctions as a means of exerting pressure on adversaries. Sanctions can range from targeted restrictions on individuals and corporations to wide-ranging embargoes that limit a country’s ability to trade goods, access finance, or integrate with global systems.
The consequences of sanctions extend far beyond the borders of the targeted nation. They reshape trade flows, alter supply chains, influence investment decisions, and sometimes trigger broader geopolitical realignments. In today’s interconnected global economy, sanctioning one nation often creates ripple effects across multiple regions, industries, and markets.
This essay explores how sanctioned economies function, the types of sanctions imposed, their impacts on domestic and global markets, and the ways in which countries and corporations adapt to these restrictions. We will also examine real-world case studies of nations such as Iran, Russia, Venezuela, and North Korea to better understand the dynamics at play. Finally, we will consider the long-term implications of sanctions for global trade, energy security, and the shifting balance of economic power.
Understanding Sanctions
What Are Economic Sanctions?
Economic sanctions are restrictions imposed by one or more countries to limit the economic activities of another country, group, or individual. They are often justified as tools to punish aggressive behavior, prevent human rights abuses, or deter actions that threaten international security.
Sanctions can take many forms:
Trade Restrictions – bans on the import or export of specific goods (e.g., oil, weapons, technology).
Financial Sanctions – freezing assets, blocking access to global financial systems, restricting loans or investment.
Targeted Sanctions – restrictions aimed at specific individuals, corporations, or political leaders.
Comprehensive Sanctions – wide-ranging measures that isolate an entire economy from global trade (e.g., North Korea).
Why Do Countries Impose Sanctions?
Political Leverage: To pressure governments into changing policies (e.g., Iran’s nuclear program).
Deterrence: To prevent actions such as territorial expansion or human rights violations.
Punishment: To penalize states for actions deemed unacceptable by the international community.
Signaling: To show unity among nations or institutions against a perceived threat.
The Domestic Impact of Sanctions
Sanctions are meant to squeeze the target country’s economy. Their effects can be harsh, often hitting ordinary citizens harder than political elites.
Economic Slowdown
Sanctions reduce access to international markets and capital, causing GDP contractions. For example, Iran’s economy shrank by over 6% in 2019 when U.S. sanctions tightened its oil exports.
Inflation and Currency Collapse
Restricted trade reduces supply, driving up prices. Combined with currency devaluation, inflation becomes rampant. Venezuela, for instance, has faced hyperinflation due in part to sanctions that limited its oil exports and foreign reserves.
Unemployment and Poverty
When industries lose access to export markets or imported raw materials, production declines. This leads to job losses, declining wages, and growing poverty levels.
Technological Backwardness
Bans on advanced technology exports prevent sanctioned countries from modernizing their industries. Russia, for example, faces difficulties in upgrading energy exploration due to restrictions on Western drilling technologies.
Social Strains
Sanctions can create shortages of medicines, food, and essential goods. While exemptions for humanitarian trade exist, logistical challenges often prevent adequate supply.
How Sanctions Reshape Global Markets
Sanctions don’t just affect the targeted country—they disrupt global trade patterns. The more interconnected the sanctioned economy is with the world, the larger the impact.
1. Energy Markets
Energy is one of the most affected sectors. Countries like Iran, Russia, and Venezuela—major oil and gas exporters—have faced sanctions that limit their ability to sell hydrocarbons.
Iran: Sanctions drastically reduced Iranian oil exports from 2.5 million barrels per day in 2011 to below 500,000 at times. This forced countries like India and China to diversify supply sources.
Russia (2022 onwards): Restrictions on Russian oil exports shifted global flows. Europe turned to the Middle East, U.S., and Africa for crude, while Russia pivoted towards Asia, especially India and China, at discounted prices.
2. Supply Chain Disruptions
Sanctions on raw materials like metals, fertilizers, and agricultural goods affect industries worldwide. For example, restrictions on Russian nickel exports disrupted global electric vehicle supply chains.
3. Financial System Fragmentation
Banning banks from SWIFT, freezing assets, and blocking reserves push sanctioned nations to create alternative financial systems. Russia and China are now developing independent payment systems to reduce reliance on the U.S.-dominated dollar system.
4. Rise of Shadow Economies
Sanctions give rise to parallel networks: smuggling, barter trade, and gray markets. For instance, Iran exports oil via secretive shipping routes and barter deals with allies.
5. Geopolitical Realignments
Sanctions push targeted nations to build alliances with sympathetic powers. Russia has deepened ties with China, Iran, and other non-Western economies since 2022.
Winners and Losers in Global Markets
Winners
Alternative Suppliers: Countries not under sanctions often benefit by replacing banned exporters. U.S. LNG exporters gained when Europe shifted away from Russian gas.
Emerging Market Importers: Nations like India profited by buying discounted Russian oil.
Technology Providers Outside the West: Chinese firms gained market share in sanctioned countries.
Losers
Sanctioned Nations: Severe economic damage, isolation, and reduced growth.
Global Consumers: Higher prices for oil, food, and commodities.
Multinational Corporations: Western firms lost profitable markets due to compliance with sanctions.
Conclusion
Sanctions have become a defining feature of modern geopolitics and global economics. While they are intended to discipline nations and change state behavior, their effects are far-reaching and often unpredictable. They reshape supply chains, realign global alliances, alter energy markets, and push the world towards multipolar trade structures.
For sanctioned nations, survival often depends on adaptation, resilience, and finding alternative partners. For the global economy, sanctions create both winners and losers—emerging opportunities for some and severe disruptions for others.
Ultimately, the rise of sanctioned economies illustrates how deeply interconnected the world has become. Restricting one nation sends ripples across the globe, challenging businesses, governments, and consumers alike. As sanctions continue to evolve as tools of statecraft, the world may witness not only new divides but also creative new forms of cooperation and resistance in the international economic order.

LiamTrading – XAUUSD: A New Trend Taking ShapeGold has entered a new phase, beginning a sharp correction following Chairman Powell’s announcement of a Fed rate cut. On the H1 chart, a bearish Dow structure is clearly forming, suggesting the potential for sustained downside in the medium term.
Most buy-side liquidity has now been cleared, leaving limited scope for a strong recovery – aside from a brief FVG that appeared immediately after the news. Market sentiment indicates that activity during that phase carried little weight. The appearance of a gap highlights growing confidence among sellers in seizing control after the Fed’s statement.
This decline could drive gold towards the 363x area, and potentially extend to the 361x region. A critical level to watch remains 3651, a strong support where price previously rebounded by more than 20 dollars immediately after the announcement.
Trading plan for today:
Sell 3656 – 3659, SL 3666, TP 3651 – 3646 – 3638 – 3634 – 3626 – 3615
Buy 3634 – 3632, SL 3628, TP 3640 – 3652 – 3660
Buy zone 3607 – 3604, SL 3600, TP 3616 – 3625 – 3638 – 3647 – 3660
This is my personal view on XAUUSD for today. Please use it as a reference for your own trading. If you find it useful, follow me for further updates and gold market scenarios.

The Domino EffectHow a Crisis in One Country Shakes Global Markets
Part 1: The Nature of Interconnected Global Markets
1.1 Globalization and Economic Interdependence
In earlier centuries, economies were relatively insulated. A banking collapse in one country might not ripple across the world. Today, however, globalization has created a tightly linked system. Goods made in China are consumed in Europe; oil produced in the Middle East powers factories in India; financial instruments traded in New York impact investors in Africa.
Trade linkages: A slowdown in one economy reduces demand for imports, hurting its trading partners.
Financial integration: Global banks and investors allocate capital worldwide. A collapse in one asset class often leads to capital flight elsewhere.
Supply chains: Modern production is fragmented globally. A crisis in one key hub can paralyze industries across continents.
1.2 Channels of Transmission
Economic shocks can travel across borders in several ways:
Financial contagion: Stock market crashes, banking failures, and currency collapses spread panic.
Trade disruptions: Falling demand in one country hurts exporters elsewhere.
Currency spillovers: Devaluation in one country pressures others to follow, creating competitive depreciation.
Investor psychology: Fear spreads faster than facts. When confidence erodes, investors often withdraw from risky markets en masse.
Part 2: Historical Case Studies of the Domino Effect
2.1 The Great Depression (1929–1930s)
The Wall Street Crash of 1929 began in the United States but soon plunged the entire world into depression. As U.S. banks collapsed and demand fell, countries that relied on exports to America suffered. International trade contracted by two-thirds, leading to widespread unemployment and social unrest worldwide.
2.2 The Asian Financial Crisis (1997–1998)
What began as a currency crisis in Thailand quickly spread across East Asia. Investors lost confidence, pulling money from Indonesia, South Korea, and Malaysia. Stock markets collapsed, currencies depreciated, and IMF bailouts followed. The crisis revealed how tightly emerging economies were linked through speculative capital flows.
2.3 The Global Financial Crisis (2008)
The U.S. subprime mortgage meltdown triggered the worst financial crisis since the Great Depression. Lehman Brothers’ collapse led to a global credit freeze. Banks in Europe, Asia, and elsewhere faced severe liquidity shortages. International trade shrank by nearly 12% in 2009, and stock markets around the world lost trillions in value. This crisis highlighted how financial products like mortgage-backed securities tied together banks worldwide.
2.4 The Eurozone Debt Crisis (2010–2012)
Greece’s debt problems quickly spread fears of contagion across Europe. Investors worried that Portugal, Spain, and Italy could face similar defaults. Bond yields soared, threatening the stability of the euro. The European Central Bank and IMF intervened, but not before global investors felt the tremors.
2.5 COVID-19 Pandemic (2020)
The pandemic began as a health crisis in Wuhan, China, but within weeks it disrupted the global economy. Supply chains broke down, trade collapsed, tourism stopped, and financial markets plunged. Lockdowns across the world triggered the sharpest economic contraction in decades, proving that non-economic crises can also trigger financial domino effects.
Part 3: Mechanisms of Global Transmission
3.1 Financial Markets as Shock Carriers
Capital is mobile. When investors fear losses in one country, they often pull funds from other markets too—especially emerging economies seen as risky. This creates a contagion effect, where unrelated economies suffer simply because they are perceived as similar.
3.2 Trade Dependency
Countries dependent on exports are especially vulnerable. For example, Germany’s reliance on exports to Southern Europe meant that the Eurozone debt crisis hit German factories hard. Similarly, China’s export slowdown during COVID-19 hurt suppliers in Southeast Asia.
3.3 Currency and Exchange Rate Volatility
When a major economy devalues its currency, trading partners may respond with devaluations of their own. This “currency war” creates global instability. During the Asian crisis, once Thailand devalued the baht, other Asian nations followed suit, intensifying the crisis.
3.4 Psychological & Behavioral Factors
Markets are not purely rational. Fear and panic amplify contagion. A crisis often leads to herding behavior, where investors sell assets simply because others are selling. This causes overshooting—currencies collapse more than fundamentals justify, worsening the crisis.
Part 4: The Role of Institutions in Crisis Management
4.1 International Monetary Fund (IMF)
The IMF often steps in to stabilize economies through emergency loans, as seen in Asia (1997) and Greece (2010). However, IMF policies sometimes attract criticism for imposing austerity, which can deepen recessions.
4.2 Central Banks and Coordination
During 2008, central banks across the world—like the Federal Reserve, European Central Bank, and Bank of Japan—coordinated interest rate cuts and liquidity injections. This collective action helped restore confidence.
4.3 G20 and Global Governance
The G20 emerged as a key crisis-management forum after 2008. By bringing together major economies, it coordinated stimulus measures and financial reforms. However, the effectiveness of such cooperation often depends on political will.
Part 5: Why Crises Spread Faster Today
Technology and speed: Information flows instantly through news and social media, fueling panic selling.
Complex financial instruments: Derivatives, swaps, and securitized assets tie banks and funds across borders.
Globalized supply chains: A factory shutdown in one country can halt production worldwide.
Dependence on capital flows: Emerging economies rely heavily on foreign investment, making them vulnerable to sudden outflows.
Part 6: Lessons and Strategies for Resilience
6.1 For Governments
Diversify economies to avoid overdependence on one sector or market.
Maintain healthy fiscal reserves to cushion shocks.
Strengthen banking regulations to reduce financial vulnerabilities.
6.2 For Investors
Recognize that diversification across countries may not always protect against global contagion.
Monitor global risk indicators, not just local markets.
Use hedging strategies to reduce currency and credit risks.
6.3 For International Institutions
Improve early-warning systems to detect vulnerabilities.
Promote coordinated responses to crises.
Reform global financial rules to prevent excessive risk-taking.
Part 7: The Future of Global Crisis Contagion
The next global crisis could emerge from many sources:
Climate change disruptions (floods, droughts, migration pressures).
Geopolitical conflicts (trade wars, regional wars, sanctions).
Technological disruptions (cyberattacks on financial systems).
Debt bubbles in emerging economies.
Given the growing complexity of global interdependence, crises will likely spread even faster in the future. The challenge is not to prevent shocks entirely—since they are inevitable—but to design systems that are resilient enough to absorb them without collapsing.
Conclusion
The domino effect in global markets is both a risk and a reminder of shared destiny. A crisis in one country can no longer be dismissed as “their problem.” Whether it is a banking failure in New York, a currency collapse in Bangkok, or a health crisis in Wuhan, the shockwaves ripple outward, reshaping the economic landscape for everyone.
Globalization has made economies interdependent, but also inter-vulnerable. The lessons from past crises show that cooperation, resilience, and adaptability are crucial. The domino effect may never disappear, but its destructive impact can be mitigated if nations, institutions, and investors act with foresight.
The world economy, like a row of dominoes, is only as strong as its weakest piece. Protecting that weakest link is the surest way to prevent the fall of all.

International Trade Week – Analysis & Insights1. The Concept and Relevance of International Trade Week
International Trade Week is often hosted by governments, international organizations, and trade promotion bodies to bring together stakeholders across the global trade ecosystem. It includes panel discussions, workshops, exhibitions, and networking opportunities, where thought leaders share insights about trade flows, barriers, and innovations.
Its relevance lies in three primary dimensions:
Global Trade Interdependence – Today’s world is interconnected. From microchips made in Taiwan to textiles from Bangladesh and crude oil from the Middle East, every economy relies on imports and exports. ITW recognizes this interdependence and creates a collaborative environment.
Policymaking and Regulation – Trade is shaped by laws, tariffs, and treaties. Governments use ITW as a platform to communicate policy shifts and reassure investors and businesses.
Innovation and Opportunities – Trade is no longer limited to physical goods. Services, intellectual property, and digital platforms dominate the 21st century. ITW offers a window into new-age opportunities, including e-commerce, fintech, and sustainability-driven trade practices.
By bringing together diverse participants—from multinational corporations (MNCs) to small exporters—ITW acts as a bridge between aspiration and execution in international trade.
2. A Historical Perspective: Evolution of Global Trade
Understanding International Trade Week also means looking at the evolution of global trade itself.
Early Exchanges (Silk Road & Spice Routes): Ancient trade routes such as the Silk Road and maritime spice routes connected civilizations. These exchanges were as much about culture as they were about goods.
Colonial Trade (15th–19th Century): European colonial powers expanded global trade networks, often exploiting colonies for raw materials and markets. This era set the foundation for the global economic order.
Post-War Reconstruction (20th Century): After WWII, institutions like the General Agreement on Tariffs and Trade (GATT) and later the World Trade Organization (WTO) were created to ensure fair and open trade.
21st Century (Digital & Fragmented Trade): Today, trade is shaped by supply chain networks, technology, and geopolitics. The rise of China, regional trade agreements (RCEP, CPTPP, USMCA), and digital commerce show how trade continues to evolve.
International Trade Week acknowledges this historical journey, reminding participants that trade has always been dynamic, responding to power shifts, technological progress, and social needs.
3. Key Themes of International Trade Week
Every edition of International Trade Week usually focuses on specific themes that reflect the challenges and opportunities of the moment. While these themes vary by host country or organizer, some recurring topics include:
a) Resilient Supply Chains
The COVID-19 pandemic exposed the vulnerabilities of global supply chains. ITW sessions emphasize strategies like diversification, regionalization, and digital supply chain management.
b) Digital Trade & E-Commerce
With Amazon, Alibaba, and Shopify reshaping consumer behavior, ITW explores how digitalization is breaking down trade barriers and empowering small businesses to sell globally.
c) Sustainability & Green Trade
Sustainable trade practices, carbon border taxes, renewable energy, and ESG (environmental, social, governance) frameworks dominate discussions. Trade is increasingly tied to climate responsibility.
d) SMEs and Inclusive Trade
While multinational corporations dominate global exports, SMEs are crucial for job creation. ITW highlights financing, capacity building, and digital tools to help SMEs go global.
e) Geopolitics & Trade Wars
From the U.S.–China trade tensions to Brexit, geopolitics often disrupt trade flows. ITW provides a platform to address these issues diplomatically and pragmatically.
4. Economic Insights: The Impact of Trade on Economies
Trade is not an abstract concept; it directly affects jobs, prices, wages, and economic growth. During ITW, economists often present data-driven insights to show how trade shapes economies.
GDP Growth: Countries that embrace trade generally grow faster. For instance, export-oriented economies like South Korea and Vietnam have shown strong growth.
Employment: Trade-intensive industries provide millions of jobs. However, automation and offshoring can also displace workers, raising concerns of inequality.
Inflation Control: Imports can keep inflation in check by offering cheaper alternatives. But over-reliance on imports can expose economies to global shocks.
Innovation Transfer: Trade encourages technological adoption. Developing countries benefit from importing advanced machinery, while developed nations access new markets.
Economic models discussed at ITW reinforce the idea that balanced trade policies drive long-term prosperity.
5. Geopolitics and Trade Diplomacy
Trade cannot be separated from geopolitics. ITW sessions often feature diplomats and strategists who emphasize how global power dynamics shape commerce.
US–China Rivalry: The trade war between the U.S. and China reshaped global supply chains, pushing companies to adopt a “China+1” strategy.
Regional Trade Agreements (RTAs): Agreements like the EU Single Market, RCEP (Asia-Pacific), and CPTPP are creating trade blocs that bypass WTO stagnation.
Sanctions & Trade Barriers: Sanctions on countries like Russia and Iran illustrate how geopolitics directly impact trade.
Emerging Markets: Nations like India, Indonesia, and Brazil are being courted as alternative trade partners amid shifting alliances.
International Trade Week discussions often stress that diplomacy and trade are intertwined, and businesses must be agile in navigating these complexities.
6. Technology and Digital Trade
Perhaps the most transformative theme in recent ITW events has been technology.
Blockchain in Trade: Enhances transparency and traceability in supply chains, reducing fraud.
Artificial Intelligence (AI): Predicts demand patterns, optimizes logistics, and supports cross-border compliance.
Fintech & Trade Finance: Digital payments and blockchain-based financing reduce costs for SMEs.
Digital Platforms: Marketplaces allow even the smallest entrepreneur to reach global customers.
By showcasing case studies and startups, ITW emphasizes that digitalization is not a distant future—it is already redefining how trade works today.
7. Sustainability and the Future of Green Trade
One of the strongest insights from ITW is the link between trade and climate responsibility. With carbon emissions and environmental degradation becoming urgent issues, trade policies are being reshaped.
Carbon Border Adjustment Mechanisms (CBAM): The EU, for example, taxes imports based on carbon footprints.
Sustainable Supply Chains: Companies are expected to ensure responsible sourcing (e.g., conflict-free minerals, ethical textiles).
Green Technologies: Renewable energy products, electric vehicles, and eco-friendly goods are becoming trade growth drivers.
Global Cooperation: ITW emphasizes that sustainability in trade requires collective action, not isolated efforts.
8. Role of SMEs and Inclusive Growth
Small and medium enterprises (SMEs) often struggle to compete with global giants due to limited resources. Yet, they are the backbone of most economies.
ITW highlights policies such as:
Easier access to trade finance.
Training programs to improve export readiness.
Digital tools to reach international buyers.
Public–private partnerships to support SME participation in trade fairs.
Inclusive trade ensures that globalization does not just benefit large corporations but uplifts grassroots entrepreneurs as well.
9. Challenges in International Trade
While ITW celebrates opportunities, it also brings attention to challenges:
Protectionism: Countries imposing tariffs and quotas to shield domestic industries.
WTO Deadlock: The WTO’s inability to resolve disputes weakens global trade governance.
Digital Divide: Not all countries have equal access to digital infrastructure, creating imbalances.
Environmental Concerns: Trade expansion sometimes worsens ecological damage if not regulated.
Global Shocks: Pandemics, wars, and natural disasters disrupt supply chains.
These challenges remind stakeholders that progress in trade requires continuous adaptation.
10. Case Studies from International Trade Week
During ITW, real-world examples highlight successes and failures:
UK Trade Week 2023: Focused on post-Brexit trade diversification, encouraging SMEs to explore markets outside Europe.
Singapore’s Trade Dialogues: Emphasized digital trade corridors across ASEAN.
African Continental Free Trade Area (AfCFTA): Case studies showed how intra-African trade could unlock massive growth if infrastructure and regulations align.
Such case studies turn theory into actionable insights for businesses and policymakers.
11. Future Outlook of International Trade
Looking ahead, several trends are likely to dominate ITW discussions:
Multipolar Trade World: With the rise of Asia, Africa, and Latin America, trade will no longer be West-centric.
Digital & AI-Driven Commerce: Data will become as valuable as goods in trade.
Resilient Regional Supply Chains: “Friend-shoring” and nearshoring will increase.
Green Protectionism: Environmental rules will reshape competitive advantages.
Inclusive Globalization: Pressure will grow to ensure trade benefits are shared fairly.
12. Conclusion
International Trade Week is not just a ceremonial event—it is a mirror reflecting the state of global commerce and a compass pointing toward future directions. It encapsulates history, geopolitics, economics, and innovation in one platform. By analyzing themes like digitalization, sustainability, and inclusivity, ITW helps stakeholders prepare for a future where trade is more complex but also more opportunity-driven than ever before.
Ultimately, International Trade Week reminds us that trade is not about borders, but about connections. In an era where globalization faces both skepticism and necessity, ITW stands as a beacon for dialogue, cooperation, and shared prosperity.
Risk vs Reward: How Positional Traders Manage Market SwingsChapter 1: The Nature of Positional Trading
1.1 Defining Positional Trading
Positional trading is a strategy where traders hold positions for extended periods, often ranging from several weeks to several months, with the goal of capturing larger price movements. Unlike intraday or swing traders, positional traders are less concerned with short-term noise. Instead, they rely on broader fundamental themes, technical trends, and macroeconomic cycles.
1.2 Characteristics of Positional Trading
Time Horizon: Longer than swing trading but shorter than long-term investing.
Analysis: Combination of technical indicators (trendlines, moving averages, volume profile) and fundamental analysis (earnings, global events, monetary policy).
Risk Tolerance: Moderate to high, since positions are exposed to overnight and weekend risks.
Capital Allocation: Positions are often larger than swing trades, requiring strict risk management.
1.3 Why Traders Choose Positional Trading
Ability to capture big moves in trending markets.
Lower stress compared to day trading (fewer trades, less screen time).
Flexibility to balance trading with other commitments.
Opportunity to benefit from structural themes such as interest rate cycles, technological disruptions, or geopolitical developments.
Chapter 2: The Core Principle – Risk vs Reward
2.1 Understanding Risk
In trading, risk is not just the possibility of losing money—it also includes the uncertainty of outcomes. For positional traders, risk manifests as:
Price Volatility: Sudden swings due to earnings reports, macroeconomic data, or geopolitical events.
Gap Risk: Overnight or weekend news causing sharp market gaps.
Trend Reversal: A strong uptrend suddenly turning bearish.
Opportunity Cost: Capital locked in a stagnant trade while better opportunities emerge elsewhere.
2.2 Understanding Reward
Reward refers to the potential gain a trader expects from a trade. For positional traders, rewards typically come from:
Riding long-term trends (e.g., a bullish rally in technology stocks).
Capturing multi-month breakouts in commodities or currencies.
Benefiting from sectoral rotations where capital shifts between industries.
2.3 The Risk-Reward Ratio
A foundational tool for positional traders is the risk-reward ratio (RRR), which compares potential profit to potential loss. For example:
If a trader risks ₹10,000 for a possible gain of ₹30,000, the RRR is 1:3.
A higher RRR ensures that even if several trades go wrong, a few winning trades can offset losses.
Most positional traders aim for a minimum of 1:2 or 1:3 risk-reward ratios to sustain profitability.
Chapter 3: Market Swings – The Double-Edged Sword
3.1 What Are Market Swings?
Market swings refer to sharp upward or downward price movements over short to medium periods. They are caused by factors like:
Earnings surprises
Central bank announcements
Political instability
Global commodity price shocks
Investor sentiment shifts
3.2 Friend or Foe?
For positional traders, market swings can be:
Friend: Accelerating profits when positioned correctly.
Foe: Triggering stop-losses and eroding capital when caught off-guard.
3.3 The Positional Trader’s Dilemma
Market swings often force traders into a psychological tug-of-war:
Should they hold through volatility in hopes of a larger trend?
Or should they exit early to preserve gains?
The right answer depends on risk appetite, conviction in analysis, and adherence to strategy.
Chapter 4: Tools of Risk Management
4.1 Stop-Loss Orders
The most basic and effective tool for limiting downside risk.
Hard Stop-Loss: A predefined price level where the position is exited.
Trailing Stop-Loss: Moves upward (or downward in shorts) as the trade becomes profitable, locking in gains while allowing room for continuation.
4.2 Position Sizing
Deciding how much capital to allocate per trade is crucial. A common rule is risking no more than 1-2% of total capital on a single trade. This prevents a single loss from wiping out the account.
4.3 Diversification
Holding positions across different asset classes or sectors reduces exposure to idiosyncratic risks. For example, combining technology stocks with commodity trades.
4.4 Hedging
Advanced positional traders may use options, futures, or inverse ETFs to hedge risks. For instance, buying protective puts while holding long equity positions.
4.5 Patience and Discipline
No tool is more important than discipline. Sticking to pre-defined plans and resisting the urge to overreact to market noise often separates successful traders from the rest.
Chapter 5: Strategies to Maximize Reward
5.1 Trend Following
Using moving averages, MACD, or ADX to identify strong directional trends.
Entering trades in alignment with the broader trend rather than against it.
5.2 Breakout Trading
Entering trades when an asset breaks through a key resistance or support level with high volume.
Positional traders often ride multi-month breakouts.
5.3 Fundamental Catalysts
Aligning trades with earnings cycles, government policies, or macroeconomic themes.
Example: Investing in renewable energy stocks during a policy push for green energy.
5.4 Sector Rotation
Shifting positions as capital flows between sectors.
Example: Moving from banking to IT during periods of rate cuts.
5.5 Pyramid Positioning
Adding to winning trades gradually as trends confirm themselves.
Ensures exposure grows only when the market supports the thesis.
Chapter 6: Psychology of Positional Trading
6.1 The Fear of Missing Out (FOMO)
Traders often chase after rallies late, increasing risk. Successful positional traders resist this urge and wait for setups aligned with their strategies.
6.2 Greed vs. Discipline
Holding too long for extra gains can turn profits into losses. Discipline ensures profits are booked systematically.
6.3 Handling Drawdowns
Market swings inevitably lead to losing streaks. Accepting drawdowns as part of the journey helps maintain mental balance.
6.4 Patience as a Weapon
Unlike day traders, positional traders must often endure long periods of stagnation before trends materialize. Patience is not passive—it is an active tool in their arsenal.
Chapter 7: Lessons for Traders and Investors
Risk is inevitable but manageable – Market swings cannot be eliminated, but tools like stop-losses and diversification reduce their impact.
Reward requires patience – Larger profits are earned by holding through volatility, not by constantly jumping in and out.
Discipline beats prediction – Following rules matters more than correctly forecasting every swing.
Adaptability is key – Global events can shift markets suddenly; traders must be flexible.
Psychology is half the battle – A calm, patient mindset sustains traders through market storms.
Conclusion
Positional trading is not about avoiding market swings—it is about managing them. Every swing presents both a threat and an opportunity. The difference lies in how traders handle them. Those who respect risk, apply disciplined strategies, and patiently wait for reward tend to emerge stronger, while those swayed by fear, greed, or impulsiveness often fall behind.
The essence of risk vs reward in positional trading is best captured as a dance: risk sets the rhythm, reward provides the melody, and discipline keeps the trader moving in sync. In a world where markets will always swing—sometimes violently—the art lies not in predicting every move but in managing exposure, aligning with trends, and staying calm in the face of uncertainty.
For anyone seeking to thrive as a positional trader, the golden rule remains: protect your downside, and the upside will take care of itself.
"The Invisible Hand: How Financial Institutions Drive Global TraPart I: The Foundations of Finance in Trade
1. Trade and the Problem of Trust
Global trade is inherently risky. A company in Brazil selling coffee beans to a roaster in Germany faces multiple uncertainties:
Will the German buyer pay on time?
Will currency fluctuations eat into profits?
What if the shipment is damaged or delayed?
How does one enforce contracts across borders?
Financial institutions provide solutions to these questions. They transform uncertainty into manageable risk and convert long, fragile supply chains into predictable flows of commerce.
2. The Role of Banks
Banks are the backbone of trade finance. They offer products such as:
Letters of Credit (LCs): Guarantee that the exporter gets paid once documents prove shipment.
Trade Loans: Short-term credit for exporters and importers.
Foreign Exchange Services: Allow parties to transact across currencies.
Guarantees and Bonds: Ensure that obligations like customs duties or project milestones are met.
Through these mechanisms, banks reduce counterparty risk and keep goods moving.
3. The Rise of Global Financial Networks
The integration of SWIFT (Society for Worldwide Interbank Financial Telecommunications), correspondent banking, and international clearinghouses ensures that payments cross borders within minutes. These networks are the nervous system of world trade, linking thousands of financial institutions into a seamless web.
Part II: Financial Institutions as Trade Enablers
1. Financing Global Supply Chains
Trade is no longer a simple exchange between two parties—it often involves dozens of suppliers, assemblers, and distributors spread across continents. Financial institutions offer supply chain finance, where banks pay suppliers early at a discount, while buyers settle later. This improves liquidity for smaller firms and keeps supply chains resilient.
2. Insuring the Global Economy
Insurance companies play a critical role by covering risks like cargo damage, political instability, and credit defaults. Export credit agencies (ECAs), often backed by governments, step in to insure trade with high-risk markets where private insurers hesitate. For instance, the Export-Import Bank of the United States (EXIM) or Euler Hermes in Europe provide guarantees that encourage exporters to venture into uncertain territories.
3. Capital Markets and Trade Expansion
Global trade thrives when companies can raise capital. Investment banks and institutional investors fund infrastructure like ports, logistics hubs, and energy pipelines that underpin global commerce. Sovereign wealth funds and pension funds also inject long-term capital into trade-oriented industries.
4. Derivatives and Risk Management
Financial markets offer futures, options, and swaps that allow traders to hedge against volatile oil prices, unpredictable exchange rates, or fluctuating commodity costs. For example, an airline can lock in fuel prices via derivatives, stabilizing its operations even when crude oil swings wildly.
Part III: The Invisible Hand at Work
1. Lubricating Trade Flows
Financial institutions are often invisible because their work is behind the scenes. Ships may carry goods, but it is financing, guarantees, and payments that make those shipments possible. Without FI involvement, exporters would demand upfront payments, while importers would refuse to pay until delivery—paralyzing trade.
2. Encouraging Globalization
By spreading risk and offering capital, financial institutions encourage firms to expand globally. A textile manufacturer in India can sell in Europe because banks provide export financing, insurers cover transit risks, and foreign exchange markets enable currency conversion.
3. Acting as Global Gatekeepers
FIs also control access to global markets. Sanctions, anti-money laundering checks, and compliance requirements often run through banks, effectively turning them into enforcers of international rules. This gatekeeping role ensures some stability but can also create bottlenecks and inequality in access to trade finance.
Part IV: Historical Evolution of Financial Institutions in Trade
1. Early Trade Finance
From the Medici banks in Renaissance Italy to the use of bills of exchange in medieval Europe, finance and trade have been intertwined for centuries. These early mechanisms allowed merchants to avoid carrying gold across dangerous routes while enabling credit-based trade.
2. Colonialism and Global Expansion
European colonial powers used banks and insurers like Lloyd’s of London to manage risks in global trade, from slave shipments to spices and tea. Financial institutions thus shaped not only commerce but also geopolitics.
3. Bretton Woods and Modern Finance
The post-WWII system institutionalized global finance through the IMF, World Bank, and GATT (later WTO). The U.S. dollar became the anchor currency, and financial institutions expanded internationally, financing reconstruction and global trade growth.
4. Digital Era and Beyond
Today, fintechs, blockchain platforms, and digital banks are disrupting traditional trade finance, making cross-border payments cheaper and faster. Decentralized finance (DeFi) experiments even promise trustless systems where smart contracts automate trade agreements.
Part V: Challenges and Risks
1. Trade Finance Gap
The Asian Development Bank (ADB) estimates a $2 trillion global trade finance gap, especially hurting small and medium enterprises (SMEs) in developing nations. Many lack access to credit or face high compliance barriers.
2. Systemic Risks
Because financial institutions are so interconnected, failures in one region can cascade globally. The collapse of Lehman Brothers or the freezing of interbank markets had devastating effects on global trade.
3. Compliance and Geopolitics
Sanctions regimes, anti-money laundering (AML) rules, and “de-risking” by global banks often exclude firms in Africa or small island states, creating a two-tier global economy.
4. Technological Disruption
While fintech promises inclusion, it also poses risks. Cybersecurity threats, digital fraud, and lack of regulation in decentralized finance could destabilize trade finance systems.
Conclusion
Financial institutions are the invisible hand behind global trade. They make the impossible possible: ensuring trust across borders, spreading risk, financing supply chains, and enabling billions of daily transactions. From medieval bills of exchange to modern blockchain systems, finance has always been the hidden infrastructure of commerce.
Yet this invisible hand is not neutral. It determines who participates in trade, who gets excluded, and how global wealth is distributed. As we move into an era of digital transformation, geopolitical rivalry, and sustainability challenges, the role of financial institutions will only grow more critical.
If global trade is the bloodstream of the world economy, then financial institutions are its heart and nervous system—pumping liquidity, transmitting signals, and ensuring the rhythm of commerce continues without pause.