Etherium Trading Idea, Also for BTC and AltcoinsHello again.
We have some speaking about the price movement and about this pattern formation that I call BAT with WINGS , or Flying BAT .
- I hope you will find something useful in this Trading Idea.
Thank you, Have a nice day.
Tradingidea

EURAUD - Technical analysisHello dear traders! Welcome to this trading idea...
First, we have a few trading options here.
1. We can open short right now, with a small target profit at the previous resistance level...
2. Wait until the price tests our resistance level and sell or buy only after that.
3. Shorting position after the price comes down, an uprising diagonal (green) line, and will break down our marked red line price marking level.
In this situation, what we are waiting for is a selling opportunity. SELL
But... If the pair becomes bullish, we may go long later.

CHFJPY - Scalping is Back! Let's see...Hi guys. I will just be scalp here.
Entry price: 173.884 TP: 173.332 SL: 174.438 Win/Loss Ratio 1:1!
Let's do some good scalp! ^^

NZDCAD - TECH.Hello everybody! It's Nika.
As we can see, we have triple bottom support. Maybe not only that, but here is also rising support channel.
Have a nice trade.

XAUUSD Deep Analysis Using Neural Networks Technology #xauusdThis analysis by ss7trader neural networks technology. this will higher chance to hit the take profit target and if you need any help or question then you can ask me on tradingview @ss7trader mostly i am available or you can also comment in the idea. also must like share the idea to getting these type of market analysis daily basis.

Gold Reaction Zones for April 22XAUUSD – Intraday Reaction Zones
Smart Money Concepts | 1H + 4H Structure
NY Session Focus
🔻 SELL ZONES (Above Price)
1️⃣ 3500 – 3503
🔸 Psychological round number
🔸 Inefficiency + liquidity magnet
🔸 Watch for reversal wick or M15 CHoCH
2️⃣ 3472 – 3478
🔸 1H supply + previous rejection wick
🔸 Already caused a strong move down
🔸 Valid for short on second test with confirmation
3️⃣ 3564 – 3568
🔸 4H unmitigated supply zone
🔸 High-impact reversal area
🔸 Only in play if NY breaks out with strength
🟢 BUY ZONES (Below Price)
1️⃣ 3440 – 3447 (Currently in play)
🔹 1H OB + imbalance combo
🔹 First support zone for potential bullish reaction
🔹 Watch for rejection or confirmation before entry
2️⃣ 3410 – 3416
🔹 BOS origin zone on 1H
🔹 Imbalance + clean structural base
🔹 Stronger foundation for longs if 3440 breaks
3️⃣ 3350 – 3362
🔹 4H demand
🔹 Multiple rejections and accumulation in past sessions
🔹 Valid for bounce if deeper selloff continues
🧠 Market Context
Price broke below 1H HL at 3462 → currently pulling back
HTF structure still bullish, but intraday flow is bearish
NY may hunt liquidity into lower zones before reversal
Confirmation is key — no blind entries
📌 Important Notice!!!
The above analysis is for educational purposes only and does not constitute financial advice. Always compare with your plan and wait for confirmation before taking action.

Tyree Thomas Jr Buy GBP/CAD Bias 4/8/25I looked at GBP/CAD and checked the pair with the key points of my trading strategy. My trade idea is to enter a buy when the pair breaks out of the Fibonacci Retracement tool and then take profit at the first green line of the Fibonacci Extension tool. My name is Tyree Thomas Jr, and this is my bias of GBP/CAD for a buy.

Trading opportunity for API3USDTBased on technical factors there is a Sell position in :
📊 API3USDT
🔴 Sell Now
🪫Stop loss 1.250
🔋Target 0.820
📏 R/R 1,5
💸RISK : 1%
We hope it is profitable for you ❤️
Please support our activity with your likes👍 and comments📝

Trading opportunity for BIDUSDTBased on technical factors there is a Buy position in :
📊 BIDUSDT
🔵 Buy Now
🪫Stop loss 0.04350
🔋Target 0.08000
📏 R/R 2,6
💸RISK : 1%
We hope it is profitable for you ❤️
Please support our activity with your likes👍 and comments📝

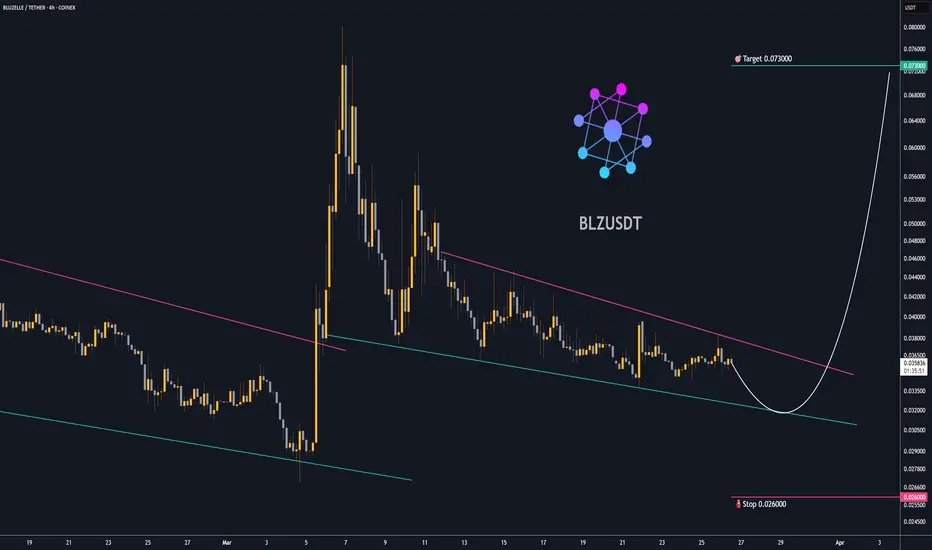
Trading opportunity for BLZUSDTBased on technical factors there is a Buy position in :
📊 BLZUSDT
🔵 Buy Now
🪫Stop loss 0.026000
🔋Target 0.073000
📏 R/R 3,8
💸RISK : 1%
We hope it is profitable for you ❤️
Please support our activity with your likes👍 and comments📝
Gold intraday view (Neowave Forecast)Hi everyone
Price is still trying to test the high 2956 using daily supports level.
I think price wont go down today...so expect some bullish swings.
and this levels should breach on monday, may be this friday.
Thank You

Falling Resistance Trendline Breakout on 2 hr Timeframe.Hello everyone, i hope you all will be doing good in your life and your Trading as well. Today i have analysed gold chart and found it has given breakout of falling resistance trendline, i am expecting momentum for upside in this. Probability is high it should travel towards our target area. The volume has been increasing, suggesting strong buying interest, and the RSI at 62.32 is in the bullish zone, confirming the upward momentum. Additionally, the MACD crossover adds further confidence to this bullish setup. The ideal entry point is when the price breaks above the resistance at 2,955.16 . Set the stop loss just below the support level at 2,860.96 to manage risk. For targets, consider aiming for 2,965.00 , 2,975.00 , and 2,985.00 , with the final target around 2,995.00 . If the breakout holds, this setup could present a strong uptrend continuation.
Disclaimer:- This analysis is for educational purposes only. Please trade responsibly and consult a financial advisor before making any decisions.
If you found this analysis helpful, don’t forget to like, follow, and share your thoughts in the comments below! Your support keeps me motivated to share more insights. Let’s grow and learn together—happy trading!

GOLD ROUTE MAP UPDATEHey Everyone,
Once again our chart idea is playing out perfectly with another amazing day on the markets today.
Yesterday we completed our bullish target at 2661 and failure to lock above confirmed a rejection. We used the rejection to buy dips inline with our plans. We are now seeing ema5 lock above 2661 opening 2681. This can now be protected and risk free.
Any rejections here will be opportunities for us to buy dips, as long as 2661 holds as support. A break below 2661 will open the lower Goldlturns for support once again.
We will keep the above in mind when taking buys from dips. Our updated levels and weighted levels will allow us to track the movement down and then catch bounces up.
We will continue to buy dips using our support levels taking 30 to 40 pips. As stated before each of our level structures give 20 to 40 pip bounces, which is enough for a nice entry and exit. If you back test the levels we shared every week for the past 24 months, you can see how effectively they were used to trade with or against short/mid term swings and trends.
BULLISH TARGET
2661 - DONE
EMA5 CROSS AND LOCK ABOVE 2661 WILL OPEN THE FOLLOWING BULLISH TARGET
2681
EMA5 CROSS AND LOCK ABOVE 2681 WILL OPEN THE FOLLOWING BULLISH TARGET
2711
BEARISH TARGETS
2633 - DONE
EMA5 CROSS AND LOCK BELOW 2633 WILL OPEN THE FOLLOWING BEARISH TARGET
2611
EMA5 CROSS AND LOCK BELOW 2611 WILL OPEN THE FOLLOWING BEARISH TARGET
2593
EMA5 CROSS AND LOCK BELOW 2593 WILL OPEN THE SWING RANGE
SWING RANGE
2570 - 2551
As always, we will keep you all updated with regular updates throughout the week and how we manage the active ideas and setups. Thank you all for your likes, comments and follows, we really appreciate it!
Mr Gold
GoldViewFX

XRPUSD Current 10 ¢ Range - Looking For Buying Opportunities ONLℹ️ XRP Remains at the top of the Daily chart BULL FLAG.
Considering many XRP holders are holding for the long run periods of sideways price action is often welcomed and is often considered a stronger bullish indicator compared to a price retracement.
Whilst XRPUSD flounders around the decending trendline of the flag top, we note the current 10¢ tracing range of this coin @ 2.3650 - 2.4675.
🟢Our current PLAN looks to accumulate more XRP on decent dips if and when they turn up.✅️
Often when these deep and often fast dips appear traders chuck their plan of trying to buy the dip in the bin then try to sell into the momentum and often end up getting trapped SHORT.
⚠️Below Is A Copy Of My Earlier Education Post You May Find Useful👍
I would consider the following as a GOLD STAR LESSON TO BE SAVED.
Yesterday created a great reminder opportunity that you must have a PLAN & RULES.
Even SeekingPips is human and therefore sometimes will deviate from the plan.
The GOLD SECRET is to realise the error and get back on track as soon as possible.
I was very clear on the chart share on 01/01/2025 that I only wanted to accumulate XRP
Here is the copy of that paragraph :
"ℹ️ However whilst price remains above 2.10 USD I do not want to take the short side of XRP."
By the next chart share the next day 02/01/25 it was clear to me where price was and that I was seeing a clear BULL FLAG on the DAILY CHART.
✅️ With that information I had a plan❕️✅️
ℹ️So what's the lesson you ask?❔️
⭐️Well Seeking Pips didn't stick to the plan.
Price was still well above 2.10 but shared a short chart idea.
This is why a TRADE JOURNAL is a GREAT idea.
In real time you may not see or notice any TRADING ERRORS but by having a journal it's in black and white and you can spot any problems early.✅️
⚠️So what were the KEY POINTS from yesterday?
🟢 Based on the D1 timeframe chart there was no valid reason according to my PLAN to conditioner any short positions.
🟢 Even based on the intra day timeframes that I use my RED LINE on my chart share at 2.3268 was never traded below.
🟢 Too zoomed in to price on lower timeframes. Seeking Pips considered the intra day timeframes and price action over what the Daily and Weekly charts were indicating.
🟢 Quantity over quality, wanting to be active and share some content, even given the fact that the DAY, WEEK and EVEN YEAR had just started.
🟢 NOT GIVING the IDEA time to play out. Barely two hours earlier I had already decided that my bias was to the long side.
There was no trigger to invalid that bias.
⭐️THE LESSON⭐️
Trading is not all about Lambos and penthouses. Yes that can be a final goal if you want it to be BUT to get to that point you really do have to iron out all of the ugly stuff first...
If this post helps even one peron on their trading journey it has done it's job.👌
PLEASE LIKE AND SHARE THIS POST IF YOU FOUND IT USEFUL. 👍

Nifty50 Trendline Retest – What’s Next for Traders?The Nifty50 is at a decisive point, retesting a key breakout level. Here's my take on the key levels to watch and how traders can approach the market
Nifty50 Analysis - 5th January
What's Happening?
Nifty 50 is at a make-or-break point. It recently broke out of a downward trendline, which is usually a good sign for bulls, but now the index is retesting that breakout. How it reacts at these levels will set the tone for the next move.
Key Levels to Watch:
- Resistance Zones:
- 24,222
- 24,347
- 24,528
- Support Zones:
- 23,990
- 23,897
- 23,790
- 23,592
Possible Scenarios:
1. The Bullish Path:
If Nifty holds above 24,057 and shows strength, we could see a move to 24,222, and if the momentum is strong enough, it might even test 24,347 or 24,528.
2. The Bearish Path:
If the price drops below 23,897, things could get dicey, with the index likely heading toward 23,790 and 23,592.
How to Trade This?
- For the Bulls:
Look for sustained buying above 24,057 to go long. Targets: 24,222, 24,347. Stop loss: Below 23,897.
- For the Bears:
If the price slips below 23,897, you might want to short. Targets: 23,790, 23,592. Stop loss: Above 24,057.
Final Thoughts:
This is one of those moments where patience pays off. Let Nifty show its hand before jumping in. Watch those key levels closely, and always trade with a plan (and a stop loss!).
NSE:NIFTY
Let me know your thoughts on this setup! Do you think bulls will hold, or will bears take over?

EUR/JPY - Trade idea dor the upcoming weekWhy did I choose this trade?
Trend Analysis and Bias:
-On the 4-hour (4H) chart, the price is in a downward correction but approaching a significant support area (Buy Zone) near 159.274, where I expect buyers to take control.
-My bias for the upcoming week is bullish, based on the overall market structure and key technical confirmations.
Key Structures and Confirmations:
-Break of Structure (BOS): The price has shown bullish strength by breaking key resistance levels multiple times in the past, confirming that buyers are dominant.
-Change of Character (CHoCH): After forming my Buy Zone, a clear CHoCH upwards occurred, providing another strong signal of buyer strength.
-Liquidity Grab: There is significant liquidity just above my Buy Zone, which has already been filled. This is another strong indication that the price could reverse upward from this zone.
-Fibonacci Confluence: I used the Fibonacci retracement tool to refine my Buy Zone. The Buy Zone aligns with the premium Fibonacci range, adding more confidence to the validity of this level.
Additionally, I always draw Fibonacci from an area of accumulation that leads to a break of structure. In this case, the accumulation area aligns perfectly with the Buy Zone, making it even stronger.
Volume and Imbalance:
The previous strong imbalance candle (IMB) shows that the market might retrace upward to fill this gap, further supporting my bullish outlook.
Psychological and Technical Levels:
The price is approaching the 159.000 level, a psychologically significant number that often acts as a magnet for buyers and sellers.
This level aligns closely with my Buy Zone, increasing the probability of a bullish reversal.
Trade Plan
Entry (Buy):
159.300, slightly above the Buy Zone, to capture the expected bullish reversal.
Stop Loss:
158.800, placed below the Buy Zone and the most recent swing low to avoid potential stop hunts.
Take Profit (TP):
TP1: 161.000 – The nearest resistance level, where price could encounter selling pressure.
TP2: 162.000 – A key resistance zone, ideal if bullish momentum continues strongly.
Why do I anticipate this move?
The Buy Zone is a strong support area, confirmed by Fibonacci confluence, bullish CHoCH, and prior liquidity being filled.
The Fibonacci is drawn from an accumulation zone that led to a structure break, further reinforcing the Buy Zone’s significance.
My bullish bias for the week aligns with these technical confirmations, suggesting that buyers will likely regain control at this level.
A combination of liquidity grab, CHoCH, BOS, and imbalance zones adds additional layers of confidence to this trade idea.
Disclaimer:
This is solely a trading idea based on my personal analysis, knowledge, and thought process. This is NOT financial advice. Please conduct your own research and implement proper risk management. Trading carries significant risks, and you should never risk more than you can afford to lose.
Tilen Safaric

THE STOCK GAUNTLET HAS BEGUN! $VKTX 2/17⚔️🛡️ THE STOCK GAUNTLET HAS BEGUN! ⚔️🛡️
STOCK/ TRADE SETUP UPDATE 2/17
2⃣ NASDAQ:VKTX - Viking Therapeutics
Show some love by: ❤️
LIKING l FOLLOWING l SHARING
Hit the🔔as well to be notified when each video drops
NFA #tradingstrategy #HIGHFIVESETUP
NASDAQ:VKTX

GBPUSD TRADE IDEA / DAY TRADE / LONGThis is trade idea for GBPUSD Day Trade
-Buy around 5m FVG according to the confirmation that will occur.
-Price above BSLQ Asian KZ
-Possible bullish price movement towards the resistance.
-Risk Reward 1:2.5

Rebound correction Silver. H4 09.10.2024Rebound correction Silver
Silver made a reversal downwards, which I wrote about in the last post Now the price has approached the margin zone and local support 30.20 from which they can make correction upwards. However, I believe that the fall will continue to the strong support zone 28.06-28.86 and in this zone I will look for culmination and a buy signal. Also, silver is now trading in the past profile accumulation area and if there is no reaction up, it will confirm the thoughts of a deeper decline.
CAPITALCOM:SILVER

NASDAQ near the buyers' zone. H4 04.09.2024NASDAQ near the buyers' zone
The NASDAQ stock index is forming a correction and is approaching the strong zone of buyers 18293-18579 from which I expect its rebound upwards. So far the move down is within the correction and now the price is trading in the margin zone. But as for me, there is not enough downward manipulation and then we will look at the buyback volumes. If they appear, we will act.

Beginning of AUDUSD workout. H4 03.09.2024Beginning of AUDUSD workout
Yesterday in the closed channel I recommended subscribers
to look for sales of the Australian dollar from the strong zone
0.6790-0.6816 with the perspective of corrective
fall to 0.6640+-
The price gave a reaction in the morning and I believe that
the push down will continue. It remains to cover a major
growth candle and then I will increase sales.
It is also desirable that the cumulative starts
to grow on the fall, they often get after that.
Already right now, even at 0.1 lot almost returned
the cost of a monthly subscription

Waiting for NaturalGas to rise. H4 30.08.2024Waiting for NaturalGas to rise
Gas tried to break down to 2.00 twice and bought back twice.
And large volumes are now around 2.10 and defending.
If they are not pushed down, they may rise to the upper boundary of the flat to 2.30 and even 2.50.
Increased vertical volumes came in at the moments of buyback, which often coincides
with the culmination and turns the market.

Waiting for WTI rebound. H4 30.08.2024 Waiting for WTI rebound
Oil WTI has been flattening with pullbacks all week, which is exhausting. My top-up was knocked out together with the rest of the last buy. Although the total plus came out due to partial fixation. Now the price is back to the key support area, it went down to the buyers' zone 73.34-72.63 and near the specified 1/2 margin. There are no large volumes, which is confusing, but they can make a buyback. Therefore, you should look here for confirmations on your strategy. If pushed the zones below, then the price will go to 71.
