IT SECTORNeed to keep a watch on IT sector next. Not sure when it will break the ongoing resistance zone. but looks like some good potential point are there on the upside.
Tradingideas

GOLD WEEKLY CHART MID/LONG TERM ROUTE MAPHey everyone,
Please check out our updated Weekly Chart Route Map, featuring updated revised key levels after completion of our last long term weekly chart idea for precise level-to-level tracking.
Price action has successfully filled EMA5 detachment (highlighted with a circle) and we are now seeing price play between 4059 (resistance) and 3821(support).
To determine the next directional move, we’ll need a decisive test and break of either boundary level. On the broader horizon, 3006 stands as the long-range pivotal swing zone, which may come into play if a major correction unfolds.
🔹 Note: The key distinction between a retracement range and a swing range is that swing ranges typically produce larger bounces and wider price reactions compared to standard retracement ranges.
We’ll continue to update this outlook throughout the week as the structure develops. Thank you all for your likes, comments and follows, we really appreciate it!
Mr Gold
GoldViewFX

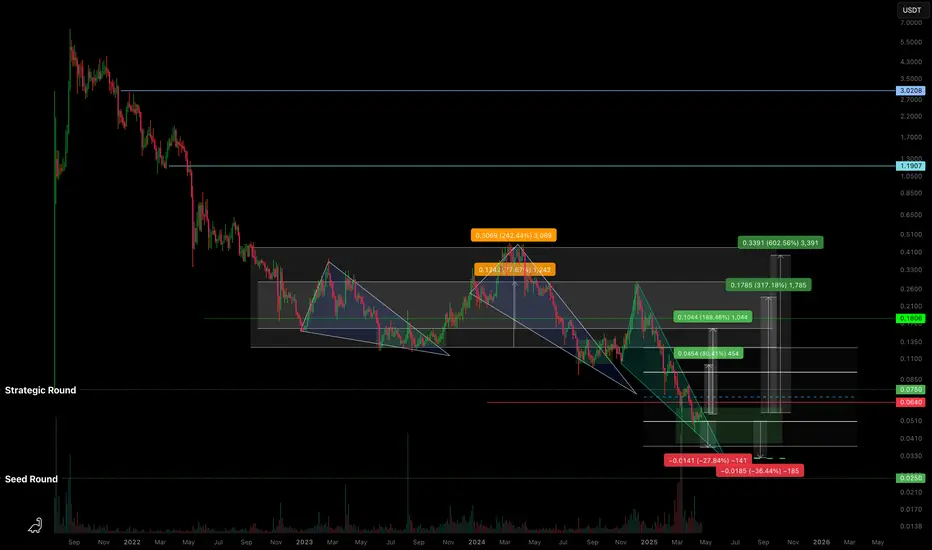
C98USDT — Descending Wedge & High R/R ZoneBased on the current structure, BINANCE:C98USDT is moving within a descending wedge , approaching zones that align with early investor positions.
🔍 What I’m seeing:
Potential drop into the range of a previous horizontal channel - marked on the chart.
We've already reached the Strategic Round level; below that is the Seed Round .
Assuming the project isn’t abandoned, it makes sense to expect investor defense in this zone.
From what I observe, there's likely accumulation happening from weak hands - at a discount .
🛡️ Approach:
As I’ve said before - you can’t treat coins like this in isolation .
They should be traded as part of a group of low-liquidity tokens , with proper risk management .
You can’t know in advance which one will “survive” without insider info from the team.
So the key is having a solid strategy and managing your portfolio and risk wisely .
📈 Targets:
Potential breakout targets from the wedge are marked on the chart.
If the market remains weak, I’ve noted a lower zone where consolidation might occur (sideways chop within a horizontal channel).
💭 Opinion:
The market is “paused” and waiting for a catalyst. You can’t rush it.
But zones like the current one on BINANCE:C98USDT seem attractive in terms of risk/reward .
The goal isn’t to guess - it’s to follow a pre-built strategy and stay focused .
📌 As always, this is not financial advice. Just my personal take and observations on the structure.
Gold Price Faces Resistance Near 4,207—Potential Pullback AheadGold (XAU/USD) is testing the upper channel resistance around 4,207 after a strong rally. The chart suggests a possible short-term correction toward the 4,200–4,158 support zone before the next directional move.
🟡 1. Current Trend
Gold (XAU/USD) is trading in an ascending channel, indicating an overall bullish trend.
Price action has been forming higher highs and higher lows, confirming steady upward momentum.
---
🔴 2. Resistance Zone
The upper boundary of the channel and price level around 4,207 USD is acting as a strong resistance.
The chart shows multiple rejections near this zone, suggesting a potential short-term top or profit-taking area.
---
🟢 3. Support Levels
The first key support is near 4,200 USD, aligning with previous price consolidation.
A deeper correction could test 4,158 USD, which matches the lower channel trendline and Ichimoku support zone.
---
⚫ 4. Price Action Pattern
The boxed consolidations represent sideways accumulation phases before each breakout — a sign of strong buying pressure.
However, the latest consolidation near the channel top hints at buyer fatigue, which could lead to a pullback.
---
🟣 5. Expected Move (Short-Term Outlook)
The downward arrows on the chart suggest a potential retracement within the channel.
Price could dip toward 4,158–4,200 USD before finding fresh buying interest.
As long as price remains above 4,158, the bullish structure remains intact.
---
⚙️ 6. Trading Implications
Aggressive traders: May look for short opportunities near resistance (~4,207) with tight stops above the channel.
Conservative traders: May wait for a bounce confirmation around 4,158–4,200 to rejoin the uptrend.

GOLD DAILY CHART ROUTE MAPHey everyone,
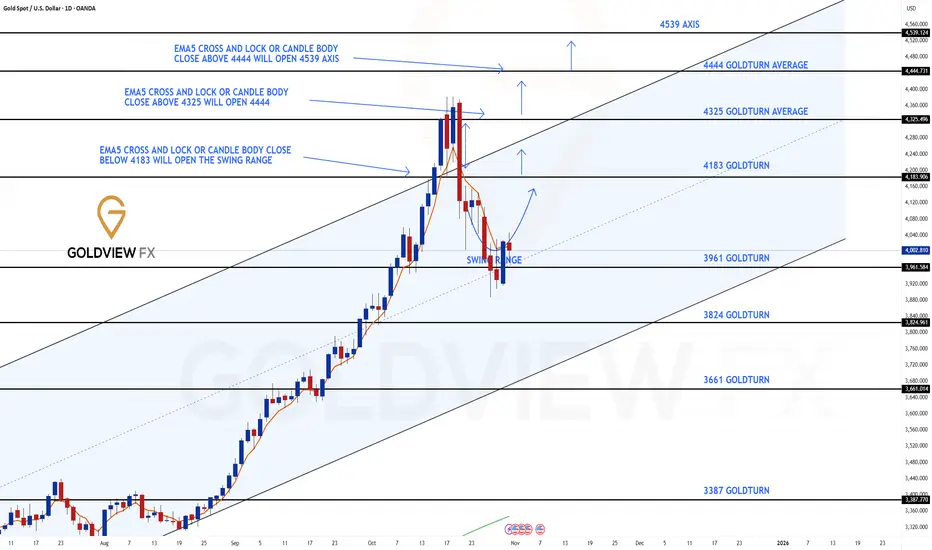
Please review our Daily Chart Route Map, now featuring updated levels for tracking Golds movement.
We continue to track our refreshed proprietary Goldturn Channel, our unique method for constructing ascending channels. Price action is now testing the swing range and the swing range seems to be holding support as expected. This swing range support also falls inline with the channel half line providing stronger support.
As long as ema5 remains above the swing zone we expect price to play between this range until the full updated long term swing is completed into 4145. An ema5 break below the swing range will open the lower channel floor for test, currently sitting at 3824
As always, we will keep you all updated with regular updates throughout the week and how we manage the active ideas and setups. Thank you all for your likes, comments and follows, we really appreciate it!
Mr Gold
GoldViewFX

ES (SPX, SPY) Analysis, Levels, Setups for Thu (Nov 13th)HTF Analysis
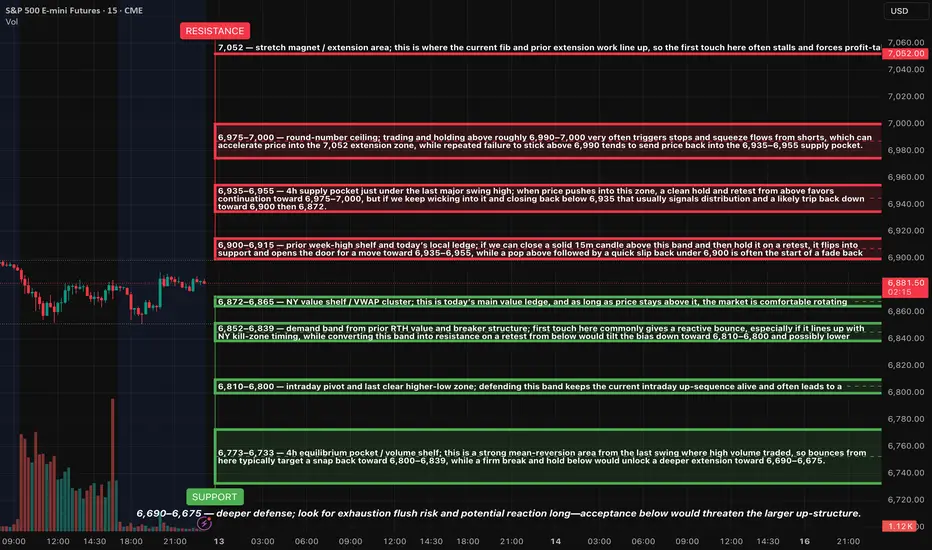
Daily Chart: The overall trend remains bullish. Currently, the price is situated near the upper range, just below the previous swing high in the 6,960–6,980 zone. The market structure is characterized by a sequence of higher highs and higher lows, indicating that we are experiencing a temporary pause rather than a confirmed peak.
4-Hour Chart: We’re observing a robust V-shaped recovery from the 6,63x–6,66x support zone, with the price now consolidating sideways beneath overhead resistance. The recent 4-hour candles are overlapping within today’s range, suggesting a coiling pattern under resistance rather than a decisive breakout.
15-Minute to 30-Minute Charts: There’s a well-defined range forming. The highs are established around the 6,900–6,915 level, while the lows are consistently found between the 6,872–6,865 shelf, with further lower shelves below. Today's price action has effectively mapped out a framework for potential trading opportunities moving into tomorrow.
MACRO / EVENTS
The government shutdown has officially ended, and normal operations are resuming across agencies. This removes the associated headline risk. The market can now return its focus to the usual macroeconomic drivers: inflation data, the Federal Reserve's policy path, and corporate earnings.
However, there remains some uncertainty regarding the timing and form of upcoming inflation releases due to previous disruptions in data collection. The 8:30 AM ET time slot is still considered a potential source of market volatility. Aside from that, the economic calendar is relatively light, meaning that trading activity around our key levels will likely drive most of the intraday market movements.
SETUPS FOR TOMORROW (LEVEL–KZ STYLE)
Long setup 1 – bounce from 6,872–6,865
Idea: Look for Asia or London to probe into 6,872–6,865 and hold. If we see a clean rejection candle on 15m or 5m and then price reclaims 6,880 and holds above, that sets up a continuation long.
Trigger concept: Reclaim and hold above 6,880 after testing 6,872–6,865.
Risk anchor: Below 6,865, with a little room for noise depending on spread and volatility.
Initial target: 6,900–6,915.
Secondary target: 6,935–6,955.
Stretch idea: If 6,955 holds as new support and order flow remains strong, leave a small runner with eyes on 6,975–7,000.
Long setup 2 – deeper dip buy at 6,852–6,839 or 6,810–6,800
Idea: If 6,872–6,865 fails cleanly but overnight selling is controlled, watch for a fade into 6,852–6,839 or, in a stronger flush, 6,810–6,800. Look for exhaustion and quick reclaim of the upper edge of the band as a signal that buyers are stepping back in.
Trigger concept: Fast rejection wick through the band followed by a close back above the upper edge on 5m–15m.
Risk anchor: Below the lower edge of the chosen band (either under 6,839 or under 6,800).
Targets: First push back to 6,872–6,865, then 6,900–6,915 if momentum improves.
Short setup 1 – fade 6,900–6,915 pop-and-fail
Idea: If price rips into 6,900–6,915 during NY AM without first testing the lower shelves and then quickly fails to hold above 6,900, that is often a spot to fade the top of the range.
Trigger concept: Wick above 6,900–6,915 with a 5m–15m close back below 6,900.
Risk anchor: Above 6,915–6,920.
Initial target: 6,872–6,865.
Extended target: 6,852–6,839 if 6,872 cracks and holds below.
Short setup 2 – rejection from 6,935–6,955
Idea: If we get a clean breakout above 6,900–6,915 but the first test of 6,935–6,955 stalls with heavy wicks and no follow-through, you can look for a tactical fade of that 4h supply pocket.
Trigger concept: Failure to hold above 6,955, with a rotation back under 6,935 on a 15m close.
Risk anchor: Above 6,960–6,965.
Initial target: 6,900–6,915.
Secondary target: 6,872–6,865 if selling expands.
RISK NOTES
Avoid trading in the middle of the 6,872–6,865 and 6,900–6,915 band; let price push into the edges and then trade the reaction.
Size down if price is very slow and overlapping ahead of the 8:30 ET window; there is no need to swing full size into dead tape.
If you see a sudden spike around the data or headline window, focus first on how price behaves at the key shelves 6,872, 6,900, and 6,935 rather than trying to guess the news.
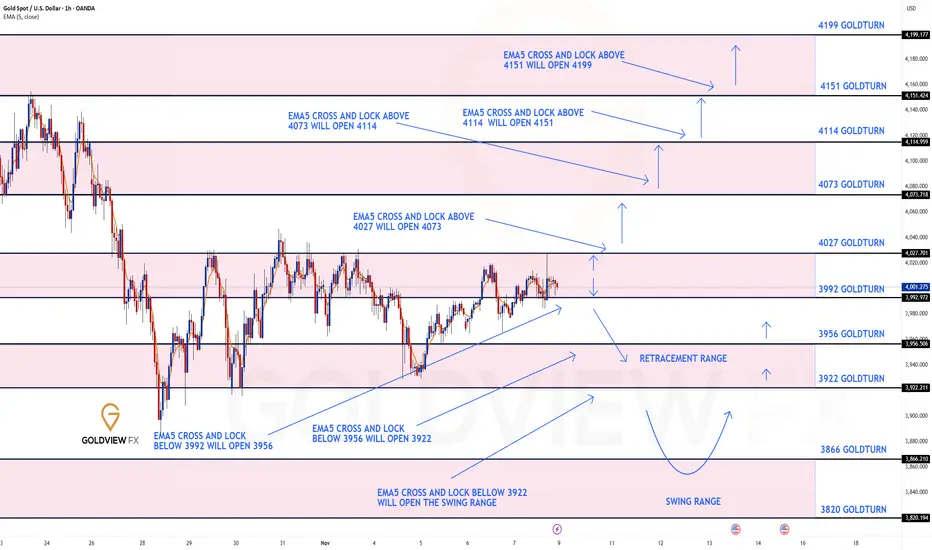
GOLD 1H CHART ROUTE MAP UPDATE & TRADING PLAN FOR THE WEEKHey Everyone,
Please see our updated 1h chart levels and targets for the coming week.
We are seeing price play between two weighted levels with a gap above at 4027 and a gap below at 3992. We will need to see ema5 cross and lock on either weighted level to determine the next range.
We will see levels tested side by side until one of the weighted levels break and lock to confirm direction for the next range.
We will keep the above in mind when taking buys from dips. Our updated levels and weighted levels will allow us to track the movement down and then catch bounces up.
We will continue to buy dips using our support levels taking 20 to 40 pips. As stated before each of our level structures give 20 to 40 pip bounces, which is enough for a nice entry and exit. If you back test the levels we shared every week for the past 24 months, you can see how effectively they were used to trade with or against short/mid term swings and trends.
The swing range give bigger bounces then our weighted levels that's the difference between weighted levels and swing ranges.
BULLISH TARGET
4027
EMA5 CROSS AND LOCK ABOVE 4027 WILL OPEN THE FOLLOWING BULLISH TARGETS
4073
EMA5 CROSS AND LOCK ABOVE 4073 WILL OPEN THE FOLLOWING BULLISH TARGET
4114
EMA5 CROSS AND LOCK ABOVE 4114 WILL OPEN THE FOLLOWING BULLISH TARGET
4151
EMA5 CROSS AND LOCK ABOVE 4151 WILL OPEN THE FOLLOWING BULLISH TARGET
4199
BEARISH TARGETS
3992
EMA5 CROSS AND LOCK BELOW 3992 WILL OPEN THE FOLLOWING BEARISH TARGET
3956
EMA5 CROSS AND LOCK BELOW 3956 WILL OPEN THE FOLLOWING BEARISH TARGET
3922
EMA5 CROSS AND LOCK BELOW 3922 WILL OPEN THE SWING RANGE
3866
3820
As always, we will keep you all updated with regular updates throughout the week and how we manage the active ideas and setups. Thank you all for your likes, comments and follows, we really appreciate it!
Mr Gold
GoldViewFX
GOLD 4H CHART ROUTE MAP UPDATE & TRADING PLAN FOR THE WEEKHey Everyone,
Please see our updated 4h chart levels and targets for the coming week.
We are seeing price play between two weighted levels with a gap above at 4042 and a gap below at 3964. We will need to see ema5 cross and lock on either weighted level to determine the next range.
We will see levels tested side by side until one of the weighted levels break and lock to confirm direction for the next range.
We will keep the above in mind when taking buys from dips. Our updated levels and weighted levels will allow us to track the movement down and then catch bounces up.
We will continue to buy dips using our support levels taking 20 to 40 pips. As stated before each of our level structures give 20 to 40 pip bounces, which is enough for a nice entry and exit. If you back test the levels we shared every week for the past 24 months, you can see how effectively they were used to trade with or against short/mid term swings and trends.
The swing range give bigger bounces then our weighted levels that's the difference between weighted levels and swing ranges.
BULLISH TARGET
4042
EMA5 CROSS AND LOCK ABOVE 4042 WILL OPEN THE FOLLOWING BULLISH TARGETS
4147
EMA5 CROSS AND LOCK ABOVE 4147 WILL OPEN THE FOLLOWING BULLISH TARGET
4264
EMA5 CROSS AND LOCK ABOVE 4264 WILL OPEN THE FOLLOWING BULLISH TARGET
4340
EMA5 CROSS AND LOCK ABOVE 4340 WILL OPEN THE FOLLOWING BULLISH TARGET
4422
EMA5 CROSS AND LOCK ABOVE 4422 WILL OPEN THE FOLLOWING BULLISH TARGET
4494
BEARISH TARGETS
3964
EMA5 CROSS AND LOCK BELOW 3964 WILL OPEN THE FOLLOWING BEARISH TARGET
3873
EMA5 CROSS AND LOCK BELOW 3873 WILL OPEN THE SWING RANGE
3741
3632
As always, we will keep you all updated with regular updates throughout the week and how we manage the active ideas and setups. Thank you all for your likes, comments and follows, we really appreciate it!
Mr Gold
GoldViewFX


Trades with B – Daily Recap (Nov 10 2025)Ticker: QQQ / NQ1!
Strategy: ORB Pro with Filters + 5 min / 15 min Multi-Timeframe Confluence
Result: Green day ✅ (+$97.78 total gain)
🧭 Market Context
The market opened inside an early consolidation range with mixed momentum. The 5-minute chart gave the first confirmation through a clean ORB signal rejection, while the 15-minute held the higher-timeframe structure and kept the EMA slope intact.
The plan today was simple — trade the first valid signal from ORB Pro, confirm with the higher timeframe trend, and respect stops.
🎯 Trade Execution Recap
9:37 AM: First Call entry (ORB signal + fib retest) — caught the initial push before stall. + $172.94
9:44 AM: Locked profits on strength into EMA resistance.
11:14 AM: Put entry after ORB Pro signaled a short on the 5 min matching 15 min trend.
11:40 AM: Exit for + $194.94 after momentum follow-through.
Cumulative Options P/L:
QQQ $618 Put (11/10/25) → + $67.89
QQQ $621 Call (11/10/25) → + $29.89
Net: + $97.78
💡 What Went Right
Followed the ORB signal with confirmation from the higher-timeframe trend filter.
Perfect execution on the Put trade — clean entry and timely exit.
Didn’t overstay the welcome once the move completed.
⚠️ What to Improve
Stay patient for stronger confluence before taking early entries.
Avoid re-entries once price returns to mid-range (less edge after initial break).
🧘♂️ Reflection
“The 5 min showed me the trigger, the 15 min confirmed the story. ORB Pro did its job — I just had to listen.”

$T with a bullish outlook following its earnings #StocksThe PEAD projected a bullish outlook for $T after a negative over reaction following its earnings release placing the stock in drift D with an expected accuracy of 84.62%.

$XOM with a bearish outlook following its earnings #StocksThe PEAD projected a bearish outlook for NYSE:XOM after a negative over reaction following its earnings release placing the stock in drift A with an expected accuracy of 25%.

$GOOGL with a bullish outlook following its earnings #StocksThe PEAD projected a bullish outlook for NASDAQ:GOOGL after a positive over reaction following its earnings release placing the stock in drift A with an expected accuracy of 78.95%.

$BAC with a bearish outlook following its earnings #StocksThe PEAD projected a bearish outlook for NYSE:BAC after a positive over reaction following its earnings release placing the stock in drift B with an expected accuracy of 42.86%.

$AMZN with a bullish outlook following its earnings #StocksThe PEAD projected a bullish outlook for NASDAQ:AMZN after a positive over reaction following its earnings release, with an expected accuracy of 75%.

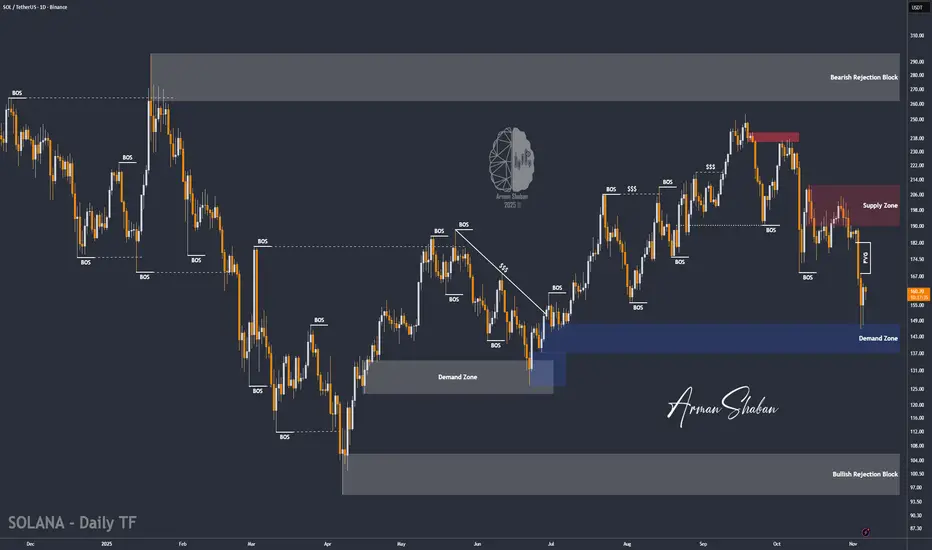
SOL/USDT | Solana Rebounds From $146 – Bulls Back in Control!By analyzing the #Solana chart on the daily timeframe, we can see that after correcting to $146, the price found strong demand and is now trading around $160.
If Solana manages to hold above the key demand zone of $137–$147, we can expect further upside movement. The medium-term targets are $168, $182, and $196. This analysis will be updated soon.
Please support me with your likes and comments to motivate me to share more analysis with you and share your opinion about the possible trend of this chart with me !
Best Regards , Arman Shaban
Bitcoin Weekly Technical Analysis Report $BTCBitcoin Weekly Technical Analysis Report BINANCE:BTCUSDT
Background Overview
Bitcoin (BTC) has become the most influential digital asset globally due to its decentralization, fixed supply, and transparent transactions. At the intersection of traditional finance and the crypto market, Technical Analysis (TA) is a crucial tool for investors to assess price trends and develop trading strategies. Based on the three key assumptions—“history repeats itself,” “price moves in trends,” and “market action discounts all information”—technical analysis uses chart patterns, trend lines, support and resistance levels, volume, and various indicators to make probabilistic forecasts about future price movements.
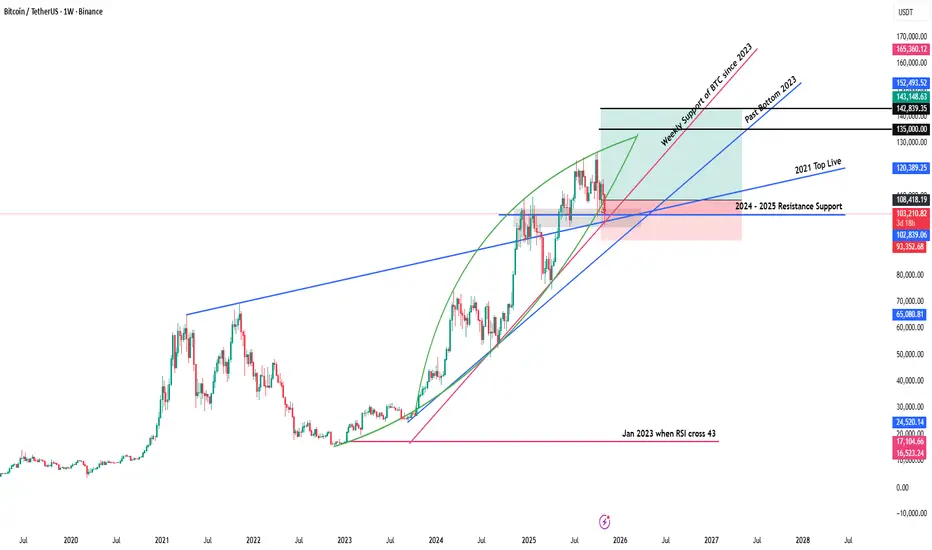
The weekly chart, as a core time frame for medium- to long-term trend analysis, filters out noise from daily and lower time frames, providing a clearer view of the main trend direction, key turning points, and the balance between bulls and bears. The BTC/USDT weekly chart analyzed here (from TradingView) covers price movements from 2023 to the present. It includes annotations such as “Weekly Support of BTC since 2023,” “Past Bottom 2023,” and “2024–2025 Resistance Support,” along with green and pink shaded areas that visually represent different stages of market psychological levels.
Currently, Bitcoin is priced at 103,384.25 USDT, with a weekly decline of -6.47% and a weekly volume of 118,000 USDT. From the chart structure, the price is near the 2024–2025 resistance-turned-support zone while being supported by the ascending trend line that has formed since 2023. The battle between bulls and bears is intense in this range, and price movements over the coming weeks will have a decisive impact on the medium- to long-term trend.
This report will combine key support and resistance levels, trend lines, volume, and technical indicators from the chart, compare historical patterns with the current market environment, conduct an in-depth analysis from multiple perspectives, and propose corresponding strategic recommendations and risk warnings.
Research Support and Evidence Analysis
This analysis is strictly based on the technical elements and relevant market data presented in the chart, with the following key supporting points:
• Current price and change: 103,384.25 USDT, weekly decline of -6.47%, indicating short-term bearish dominance, but the price has not yet broken key support.
• Weekly volume: 118,000 USDT, which has expanded compared to the recent average, suggesting increased market participation and greater divergence between bulls and bears.
• Key support levels:
– “Weekly Support of BTC since 2023” trend line: An ascending trend line connecting the weekly lows since 2023, currently around 100,000 USDT, providing important support.
– “Past Bottom 2023” zone: The 2023 Bitcoin low accumulation area, around 95,000–98,000 USDT, serving as the last line of defense for bulls.
• Key resistance levels:
– “2024–2025 Resistance Support” level: Previous high points where price repeatedly failed to break through, around 110,000–115,000 USDT, now acting as resistance.
– Pink resistance zone: Corresponds to historical accumulation areas and Fibonacci extension levels, around 118,000–122,000 USDT, serving as both a target for bulls and a point for bears to counterattack.
• Trend line analysis:
– Main ascending trend line: Extending upward from the 2023 low with a moderate slope, reflecting the medium- to long-term bullish trend.
– Secondary descending trend line: Connecting the late 2024 and early 2025 highs, forming a short-term descending channel; the price is currently approaching the upper boundary of this channel.
• Volume confirmation:
– When the 2023 support zone formed, volume gradually decreased, indicating easing selling pressure.
– When breaking through resistance in 2024, volume expanded significantly, confirming the validity of the breakout.
– During the current pullback, volume has expanded again, requiring vigilance against panic selling.
Data Comparison and Detailed Summary
To more intuitively present the relationship between key price levels and historical movements, the main support and resistance levels, trend lines, and volume characteristics are summarized as follows:
drive.google.com
From the table, it is clear that the support system formed in 2023 remains effective, while the resistance zone from late 2024 to early 2025 is pressuring the current price. Volume shows distinct patterns at different stages: decreasing at support zones, expanding on breakouts, and expanding again during pullbacks, reflecting cyclical changes in market sentiment.
Source Origin and Citation Interpretation
• Data authority: TradingView integrates real-time quotes from major global exchanges, ensuring the accuracy of price and volume data.
• Annotation professionalism: The trend lines, support and resistance zones on the chart are drawn by experienced analysts based on classic technical analysis methods such as historical highs and lows, accumulation areas, and Fibonacci retracements.
• Time frame representativeness: The weekly chart filters short-term fluctuations and is more suitable for medium- to long-term trend analysis, matching the decision cycles of institutional investors and long-term holders.
For labels such as “Weekly Support of BTC since 2023,” “Past Bottom 2023,” and “2024–2025 Resistance Support,” their origin is the chart drawer’s summary of historical key price levels. Although somewhat subjective, they align with the general definitions in technical analysis for “significant highs and lows” and “accumulation areas.” Therefore, interpretation should combine multiple verifications (such as volume and indicator confirmation) to reduce the risk of bias from single labels.
In-depth Insights and Independent Thinking
Combining the above data and chart features, deeper market insights can be gained from the following perspectives:
The medium- to long-term trend remains healthy
– The main ascending trend line has been extending upward from the 2023 low, and each pullback has not broken below it, indicating that the bullish structure is intact.
– The current price is approaching this trend line. If it can stabilize and rebound here, it will validate the effectiveness of the trend support and lay the foundation for the next upward wave.
The importance of the resistance-turned-support zone
– The 110,000–115,000 USDT zone repeatedly acted as resistance from late 2024 to early 2025. After being recently broken, it has turned into support.
– If the price can stabilize above this zone, it will further consolidate the bulls’ advantage and challenge the pink resistance zone (118,000–122,000 USDT).
Volume signals reveal market sentiment
– Volume decreased at the 2023 bottom, indicating exhausted selling pressure and paving the way for the subsequent rebound.
– Volume expanded during the resistance breakout, confirming increased market participation, while the current pullback’s expanded volume requires vigilance against panic selling.
– Future signs of stabilization with decreasing volume will present a better opportunity for bulls to enter.
Risks and opportunities coexist
– Short-term bears dominate, and the price is approaching the main ascending trend line. A breakdown below could trigger larger-scale stop-losses, targeting the 95,000–98,000 USDT zone.
– If the trend line support holds, combined with oversold signals from technical indicators, a wave of buying opportunities will emerge, with an initial target of 110,000–115,000 USDT.
Macro environment and market structure
– Global liquidity, regulatory policies, and institutional capital flows are exogenous variables affecting Bitcoin’s medium- to long-term trends.
– Although technical analysis can provide probabilistic judgments on price paths, it still needs to be combined with fundamental analysis and market sentiment to improve decision-making success rates.
Extended Discussion / Related Topics
In the current technical context, the following topics can be further explored:
• Multi-dimensional verification of technical indicators
– Relative Strength Index (RSI): Whether the weekly RSI is in overbought or oversold territory, and any divergence with price.
– Moving Averages (MA): The arrangement and divergence of the 50-week, 100-week, and 200-week MAs, and their confirmation of trend direction.
– MACD histogram and signal line: Weekly golden crosses and death crosses, as well as momentum changes in the histogram, indicating trend continuation or reversal.
• Fibonacci retracement and extension
– The role of Fibonacci retracement levels (38.2%, 50%, 61.8%) from the 2023–2024 main upward wave in the current pullback.
– If the price breaks above the pink resistance zone, the next targets can be referenced by Fibonacci extension levels (161.8%, 261.8%).
• Market sentiment and capital flows
– Can data such as futures open interest, funding rates, and exchange net inflows/outflows resonate with chart patterns?
– The impact of continuous buying by institutions like Grayscale and MicroStrategy, compared with the long-short ratio of retail leveraged funds, on medium- to long-term support and resistance.
• Risk management strategies
– Near key support and resistance levels, how to set stop-loss and take-profit to optimize risk-reward ratios.
– When volatility surges, should position size be adjusted, or derivatives like options be used for hedging?
• Future trend outlook
– If the price stabilizes above 110,000–115,000 USDT, the bullish target could extend to 130,000–150,000 USDT.
– If it breaks below the main ascending trend line and loses the 95,000 USDT support, a larger-scale correction may begin, with a downside target around 80,000 USDT.
Through in-depth exploration of the above topics, a more comprehensive investment decision framework can be constructed. On the basis of technical analysis, combining market structure and macro factors will improve the ability to predict price movements.
GOLD DAILY CHART ROUTE MAP Hey everyone,
Please review our Daily Chart Route Map, now featuring updated levels for tracking Golds movement.
We continue to track our refreshed proprietary Goldturn Channel, our unique method for constructing ascending channels. Price action is now testing the swing range and the swing range seems to be holding support as expected. This swing range support also falls inline with the channel half line providing stronger support.
As long as ema5 remains above the swing zone we expect price to play between this range until the full long term swing is completed into 4183. An ema5 break below the swing range will open the lower channel floor for test, currently sitting at 3824
As always, we will keep you all updated with regular updates throughout the week and how we manage the active ideas and setups. Thank you all for your likes, comments and follows, we really appreciate it!
Mr Gold
GoldViewFX
HTZ:From Breakdown to Breakout,Bullish Reversal Gaining TractionHertz Global Holdings, Inc. (NASDAQ: HTZ)
Technical Outlook: Potential Reversal Following Structural Breakout
Date : 5 November 2025
Summary
Hertz Global Holdings (HTZ) has exhibited signs of a potential medium-term trend reversal following a prolonged downtrend since mid-2023. Multiple bullish technical signals — including a breakout from key continuation patterns, RSI divergence, and sustained support retests — point toward a possible shift in market sentiment.
Price Action and Technical Developments
1. Downtrend continuation : Since July 2023, HTZ has been in a persistent downtrend, reinforced by a breakdown below major horizontal support.
2. Symmetrical triangle breakdown (Feb 2024) : The stock failed to hold within a consolidation structure, confirming bearish momentum at that stage.
3. Bullish divergence (Sept 2024) : Despite registering new price lows, the RSI formed higher highs, suggesting weakening downside momentum and potential for reversal.
4. Falling wedge breakout (Nov 2024) : Price action reversed from a classic bullish pattern, followed by a strong rally through the end of November.
5. Symmetrical triangle breakout (Apr 2025) : HTZ broke out of consolidation on elevated volume, coinciding with a break above the long-term descending trendline — a key technical inflection point.
6. Current setup (Nov 2025) : The share price is consolidating within a falling channel. On 4 November 2025, it rebounded from a confluence of supports — including the uptrend line from September 2024 and prior resistance turned support — reinforcing near-term bullish bias.
Trading Idea
Entry Zone: 4.71 - 5.50
Target: 10.50 and 15.00
Support: 4.71
Conclusion
After a long downtrend, HTZ is showing a clear shift in momentum. With multiple bullish patterns confirmed and strong support holding, the stock may be entering a new uptrend phase toward USD 10.50 and USD 15.00.

GOLD 1H CHART ROUTE MAP UPDATE & TRADING PLAN FOR THE WEEKHey Everyone,
Please see our updated 1h chart levels and targets for the coming week.
We are seeing price play between two weighted levels with a gap above at 4042 and a gap below at 3992. We will need to see ema5 cross and lock on either weighted level to determine the next range.
We will see levels tested side by side until one of the weighted levels break and lock to confirm direction for the next range.
We will keep the above in mind when taking buys from dips. Our updated levels and weighted levels will allow us to track the movement down and then catch bounces up.
We will continue to buy dips using our support levels taking 20 to 40 pips. As stated before each of our level structures give 20 to 40 pip bounces, which is enough for a nice entry and exit. If you back test the levels we shared every week for the past 24 months, you can see how effectively they were used to trade with or against short/mid term swings and trends.
The swing range give bigger bounces then our weighted levels that's the difference between weighted levels and swing ranges.
BULLISH TARGET
4042
EMA5 CROSS AND LOCK ABOVE 4042 WILL OPEN THE FOLLOWING BULLISH TARGETS
4089
EMA5 CROSS AND LOCK ABOVE 4089 WILL OPEN THE FOLLOWING BULLISH TARGET
4136
EMA5 CROSS AND LOCK ABOVE 4136 WILL OPEN THE FOLLOWING BULLISH TARGET
4194
BEARISH TARGETS
3992
EMA5 CROSS AND LOCK BELOW 3992 WILL OPEN THE FOLLOWING BEARISH TARGET
3956
EMA5 CROSS AND LOCK BELOW 3956 WILL OPEN THE FOLLOWING BEARISH TARGET
3922
EMA5 CROSS AND LOCK BELOW 3922 WILL OPEN THE SWING RANGE
3866
3820
As always, we will keep you all updated with regular updates throughout the week and how we manage the active ideas and setups. Thank you all for your likes, comments and follows, we really appreciate it!
Mr Gold
GoldViewFX

Bitcoin BullishThis crypto has been bearish for the past few days, and has reached a POI, 1 H our demand Zone.
I anticipate a slight bullish pullback towards the 109 - 110k supply Zone.

GOLD 4H CHART ROUTE MAP UPDATE & TRADING PLAN FOR THE WEEKHey Everyone,
Please see our updated 4h chart levels and targets for the coming week.
We are seeing price play between two weighted levels with a gap above at 4079 and a gap below at 3985. We will need to see ema5 cross and lock on either weighted level to determine the next range.
We will see levels tested side by side until one of the weighted levels break and lock to confirm direction for the next range.
We will keep the above in mind when taking buys from dips. Our updated levels and weighted levels will allow us to track the movement down and then catch bounces up.
We will continue to buy dips using our support levels taking 20 to 40 pips. As stated before each of our level structures give 20 to 40 pip bounces, which is enough for a nice entry and exit. If you back test the levels we shared every week for the past 24 months, you can see how effectively they were used to trade with or against short/mid term swings and trends.
The swing range give bigger bounces then our weighted levels that's the difference between weighted levels and swing ranges.
BULLISH TARGET
4079
EMA5 CROSS AND LOCK ABOVE 4079 WILL OPEN THE FOLLOWING BULLISH TARGETS
4173
EMA5 CROSS AND LOCK ABOVE 4173 WILL OPEN THE FOLLOWING BULLISH TARGET
4264
EMA5 CROSS AND LOCK ABOVE 4264 WILL OPEN THE FOLLOWING BULLISH TARGET
4340
EMA5 CROSS AND LOCK ABOVE 4340 WILL OPEN THE FOLLOWING BULLISH TARGET
4422
EMA5 CROSS AND LOCK ABOVE 4422 WILL OPEN THE FOLLOWING BULLISH TARGET
4494
BEARISH TARGETS
3985
EMA5 CROSS AND LOCK BELOW 3985 WILL OPEN THE FOLLOWING BEARISH TARGET
3873
EMA5 CROSS AND LOCK BELOW 3873 WILL OPEN THE SWING RANGE
3741
3632
As always, we will keep you all updated with regular updates throughout the week and how we manage the active ideas and setups. Thank you all for your likes, comments and follows, we really appreciate it!
Mr Gold
GoldViewFX

GOLD 1H CHART ROUTE MAP UPDATE & TRADING PLAN FOR THE WEEKHey Everyone,
Please see our updated 1h chart levels and targets for the coming week.
We are seeing price play between two weighted levels with a gap above at 4134 and a gap below at 4090. We will need to see ema5 cross and lock on either weighted level to determine the next range.
We will see levels tested side by side until one of the weighted levels break and lock to confirm direction for the next range.
We will keep the above in mind when taking buys from dips. Our updated levels and weighted levels will allow us to track the movement down and then catch bounces up.
We will continue to buy dips using our support levels taking 20 to 40 pips. As stated before each of our level structures give 20 to 40 pip bounces, which is enough for a nice entry and exit. If you back test the levels we shared every week for the past 24 months, you can see how effectively they were used to trade with or against short/mid term swings and trends.
The swing range give bigger bounces then our weighted levels that's the difference between weighted levels and swing ranges.
BULLISH TARGET
4134
EMA5 CROSS AND LOCK ABOVE 4134 WILL OPEN THE FOLLOWING BULLISH TARGETS
4174
EMA5 CROSS AND LOCK ABOVE 4174 WILL OPEN THE FOLLOWING BULLISH TARGET
4236
EMA5 CROSS AND LOCK ABOVE 4236 WILL OPEN THE FOLLOWING BULLISH TARGET
4288
EMA5 CROSS AND LOCK ABOVE 4288 WILL OPEN THE FOLLOWING BULLISH TARGET
4331
EMA5 CROSS AND LOCK ABOVE 4331 WILL OPEN THE FOLLOWING BULLISH TARGET
4360
BEARISH TARGETS
4090
EMA5 CROSS AND LOCK BELOW 4090 WILL OPEN THE FOLLOWING BEARISH TARGET
4042
EMA5 CROSS AND LOCK BELOW 4042 WILL OPEN THE SWING RANGE
4122
4075
EMA5 CROSS AND LOCK BELOW 4075 WILL OPEN THE SECONDAARY SWING RANGE
3987
3939
As always, we will keep you all updated with regular updates throughout the week and how we manage the active ideas and setups. Thank you all for your likes, comments and follows, we really appreciate it!
Mr Gold
GoldViewFX
