GOLD 4H CHART ROUTE MAP UPDATE & TRADING PLAN FOR THE WEEKHey Everyone,
Please see our updated 4h chart levels and targets for the coming week.
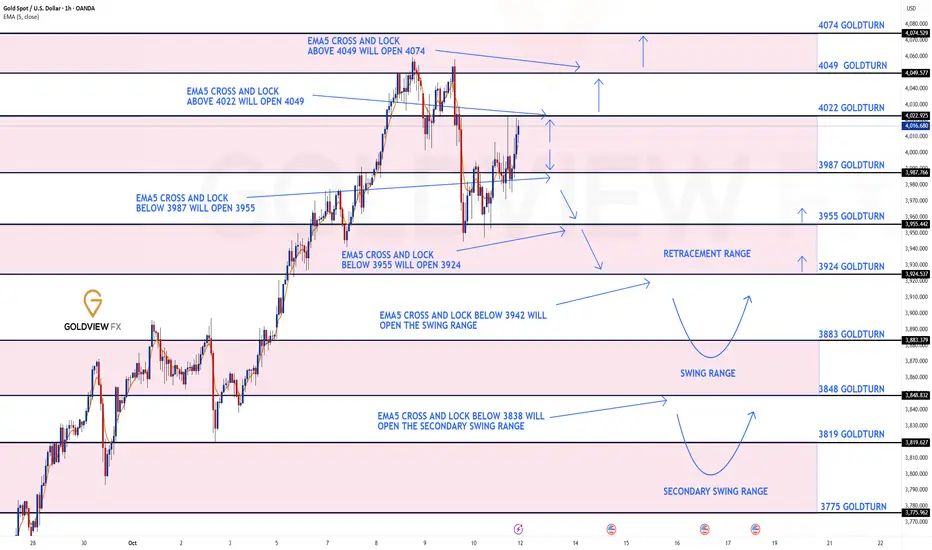
We are seeing price play between two weighted levels with a gap above at 4173 and a gap below at 4079. We will need to see ema5 cross and lock on either weighted level to determine the next range.
We will see levels tested side by side until one of the weighted levels break and lock to confirm direction for the next range.
We will keep the above in mind when taking buys from dips. Our updated levels and weighted levels will allow us to track the movement down and then catch bounces up.
We will continue to buy dips using our support levels taking 20 to 40 pips. As stated before each of our level structures give 20 to 40 pip bounces, which is enough for a nice entry and exit. If you back test the levels we shared every week for the past 24 months, you can see how effectively they were used to trade with or against short/mid term swings and trends.
The swing range give bigger bounces then our weighted levels that's the difference between weighted levels and swing ranges.
BULLISH TARGET
4173
EMA5 CROSS AND LOCK ABOVE 4173 WILL OPEN THE FOLLOWING BULLISH TARGETS
4264
EMA5 CROSS AND LOCK ABOVE 4264 WILL OPEN THE FOLLOWING BULLISH TARGET
4333
EMA5 CROSS AND LOCK ABOVE 4333 WILL OPEN THE FOLLOWING BULLISH TARGET
4333
EMA5 CROSS AND LOCK ABOVE 4333 WILL OPEN THE FOLLOWING BULLISH TARGET
4422
EMA5 CROSS AND LOCK ABOVE 4422 WILL OPEN THE FOLLOWING BULLISH TARGET
4494
BEARISH TARGETS
4079
EMA5 CROSS AND LOCK BELOW 4079 WILL OPEN THE SWING RANGE
3985
3873
EMA5 CROSS AND LOCK BELOW 3873 WILL OPEN THE SECONDARY SWING RANGE
3741
3632
As always, we will keep you all updated with regular updates throughout the week and how we manage the active ideas and setups. Thank you all for your likes, comments and follows, we really appreciate it!
Mr Gold
GoldViewFX
Tradingideas

Investors, Traders, and Policy Makers in the World MarketImportance and Difference.
Introduction
The global financial market is an intricate ecosystem where capital flows seamlessly across borders, industries, and sectors. Within this ecosystem, three fundamental participants play distinct yet interconnected roles — investors, traders, and policy makers. Each group contributes to the market’s structure, functioning, and stability in different ways.
Investors provide the long-term capital necessary for growth and innovation; traders ensure market liquidity and efficiency through short-term operations; and policy makers establish the regulatory and economic framework that governs both.
Understanding their importance and differences is essential for comprehending how the world market operates and responds to global financial dynamics.
1. Role and Importance of Investors
1.1 Who are Investors?
Investors are individuals or institutions that allocate capital to assets such as stocks, bonds, mutual funds, real estate, or startups with the expectation of earning long-term returns. Unlike traders, who focus on short-term market fluctuations, investors emphasize fundamental value and sustainability.
Investors can be categorized into:
Retail investors – individual participants investing personal funds.
Institutional investors – entities such as pension funds, insurance companies, mutual funds, and sovereign wealth funds managing large capital pools.
1.2 Importance of Investors in the Global Market
Capital Formation:
Investors are the backbone of economic growth. Their funds are used by corporations for expansion, innovation, and employment generation. When investors purchase shares or bonds, they provide the necessary capital for companies to operate and expand.
Long-term Stability:
Investors bring stability to the market through their long-term orientation. Unlike traders, they are less influenced by daily market volatility, ensuring that companies have a reliable source of capital even during uncertain times.
Corporate Governance:
Institutional investors often influence corporate governance by voting on important issues, promoting transparency, ethical conduct, and accountability. This oversight helps maintain investor confidence in global markets.
Economic Growth and Development:
By channeling savings into productive investments, investors drive infrastructure development, technological advancement, and job creation. Their confidence can determine the economic trajectory of entire nations.
Wealth Creation:
Investors benefit from dividends, interest, and capital appreciation, which enhances individual and institutional wealth. This wealth accumulation fuels consumption and savings, further stimulating the economy.
2. Role and Importance of Traders
2.1 Who are Traders?
Traders are market participants who buy and sell financial instruments — such as equities, commodities, currencies, or derivatives — to profit from short-term price movements. Their approach is usually technical, relying on charts, patterns, and market sentiment rather than long-term fundamentals.
Traders can be classified as:
Day traders: Execute multiple trades within a single day.
Swing traders: Hold positions for days or weeks.
Arbitrage traders: Exploit price differences across markets.
Algorithmic or high-frequency traders: Use computer algorithms to execute rapid trades.
2.2 Importance of Traders in the Global Market
Market Liquidity:
Traders enhance liquidity by constantly buying and selling assets, ensuring that other market participants can enter or exit positions easily. A liquid market reduces transaction costs and improves efficiency.
Price Discovery:
Through continuous trading activity, traders help establish fair market prices. Their collective actions reflect real-time market sentiment, economic data, and investor expectations, making markets more transparent.
Market Efficiency:
Traders exploit inefficiencies and arbitrage opportunities, which helps align prices with intrinsic value. This process of correcting mispriced assets contributes to overall market efficiency.
Risk Management and Hedging:
Traders also play a role in managing financial risks through derivative instruments. For instance, commodity traders help producers hedge against price volatility in oil, metals, or agricultural goods.
Economic Signaling:
The behavior of traders can act as a signal of market health. Sharp price movements or heavy trading volumes often indicate changes in investor sentiment, guiding policy makers and long-term investors in their decisions.
3. Role and Importance of Policy Makers
3.1 Who are Policy Makers?
Policy makers are government officials, central banks, and regulatory authorities responsible for shaping the financial, monetary, and fiscal policies that govern the global market. Their actions influence interest rates, inflation, exchange rates, taxation, and capital flow regulations.
Key examples include:
Central Banks (like the U.S. Federal Reserve, European Central Bank, Reserve Bank of India)
Financial Regulators (like SEBI, SEC, FCA)
Government Ministries and Economic Councils
3.2 Importance of Policy Makers in the Global Market
Economic Stability:
Policy makers ensure macroeconomic stability through monetary and fiscal policies. By adjusting interest rates and money supply, central banks can control inflation, manage unemployment, and stabilize currencies.
Regulation and Oversight:
Regulatory bodies protect investors and maintain market integrity by enforcing laws against fraud, insider trading, and market manipulation. Effective regulation enhances investor confidence and market credibility.
Crisis Management:
During financial crises, policy makers implement interventions such as bailouts, stimulus packages, or liquidity support to prevent systemic collapse. For example, central banks’ coordinated actions during the 2008 crisis prevented a global depression.
Trade and Capital Flow Management:
Policy makers influence global trade through tariffs, exchange rate policies, and cross-border investment regulations. Their decisions can encourage or restrict foreign investment and affect global capital mobility.
Long-term Economic Planning:
Governments design long-term economic strategies to promote sustainable development, technological innovation, and social welfare, ensuring that the market supports inclusive growth.
4. Interrelationship Between the Three Groups
Although their goals and methods differ, investors, traders, and policy makers are interdependent within the world market:
Investors and Traders:
Traders provide liquidity that allows investors to buy or sell assets without major price disruptions. Meanwhile, investors create long-term value that traders can speculate on in the short term.
Traders and Policy Makers:
Traders respond immediately to policy announcements — such as interest rate changes or fiscal packages — influencing market volatility. Policy makers, in turn, observe trader behavior as a barometer for market sentiment.
Investors and Policy Makers:
Investors rely on stable and predictable policies to make long-term decisions. Conversely, governments depend on investor confidence to finance public debt and stimulate economic growth.
This cyclical relationship ensures that each participant supports the other, maintaining balance within the global financial ecosystem.
5. Global Examples and Case Studies
2008 Financial Crisis:
The crisis highlighted how interconnected these three groups are. Excessive risk-taking by traders and institutions led to a collapse in investor confidence, prompting massive interventions by policy makers through quantitative easing and stimulus measures.
COVID-19 Pandemic (2020):
During the pandemic, investors sought safe assets, traders reacted to volatility, and policy makers injected liquidity and cut interest rates to stabilize economies. The coordinated response prevented a deeper global recession.
Inflation Control by Central Banks (2022–2023):
Central banks worldwide raised interest rates to combat inflation. Traders responded with shifts in bond and currency markets, while investors adjusted portfolios toward defensive assets, showing the dynamic interplay between all three.
6. Challenges Faced by Each Group
Investors: Face risks from inflation, policy uncertainty, and geopolitical tensions. Their challenge lies in maintaining returns amid market volatility.
Traders: Confront high competition, algorithmic dominance, and unpredictable market swings. Risk management and speed are critical to survival.
Policy Makers: Must balance economic growth with financial stability while avoiding overregulation or political interference. Global coordination remains a persistent challenge.
7. The Future of Their Roles in the Global Market
The future of the world market will be shaped by technology, globalization, and sustainability.
Investors are increasingly prioritizing ESG (Environmental, Social, Governance) principles.
Traders are adopting AI-driven and algorithmic systems to enhance speed and accuracy.
Policy Makers are developing frameworks for digital currencies, blockchain regulation, and climate finance.
This evolution will demand greater cooperation among all three to ensure inclusive and resilient global markets.
8. Conclusion
The global financial market is a dynamic system where investors, traders, and policy makers each play indispensable roles. Investors provide long-term capital and stability; traders inject liquidity and efficiency; and policy makers maintain order and economic balance.
Their interactions create a complex yet balanced ecosystem that fuels global economic growth, innovation, and development. Recognizing the distinctions and synergies among these three groups helps one appreciate the mechanisms that sustain the world market and the challenges that lie ahead in maintaining its stability and inclusiveness.

GOLD WEEKLY CHART MID/LONG TERM ROUTE MAPHey everyone,
Please check out our updated Weekly Chart Route Map, featuring updated revised key levels after completion of our last long term weekly chart idea for precise level-to-level tracking.
We’ve refreshed our long-term structure on the weekly chart. Price action recently rejected the 4294 level and is now range-bound between 4284 (resistance) and 4059 (support). This consolidation aligns with a detachment from the EMA5, highlighted on the chart with a circle. Even if a full detachment doesn’t materialize, a partial (halfway) correction remains the more probable scenario.
To determine the next directional move, we’ll need a decisive test and break of either boundary level. On the broader horizon, 3006 stands as the long-range pivotal swing zone, which may come into play if a major correction unfolds.
🔹 Note: The key distinction between a retracement range and a swing range is that swing ranges typically produce larger bounces and wider price reactions compared to standard retracement ranges.
We’ll continue to update this outlook throughout the week as the structure develops. Thank you all for your likes, comments and follows, we really appreciate it!
Mr Gold
GoldViewFX

REVEALED: What REAL Trading isWhat is Financial Trading in a nutshell?
For the last 20 years I’ve summed up trading as just ONE BIG AUCTION.
It sounds like a fast-paced, high-risk, Wall Street movie scene with shouting brokers and skyrocketing graphs.
But, here’s the truth:
Trading is the most relaxing thing – when done right!
It’s a lifestyle, a process, and a mindset.
It’s one thing where YOU can take your finances on an exciting adventure — if you do it right.
Whether you’re a complete newbie or a seasoned trader, here is a refresher to dive into what trading really is.
Trading Is More Than Just an Auction of buying or selling…
Let’s clear up one thing first.
For the last 20 years I’ve summed up trading as just ONE BIG AUCTION.
And yes it is one big market of buying and selling – but that’s only part of it.
TRADING is all about solving a puzzle of analyzing probabilities, managing risks, and navigating uncertainty.
Every time you enter a trade (buy or sell), you’re making an educated guess on where the market is LIKELY to go next.
And you’re placing a bet on human behavior — how millions of people around the world (with their emotions, news reactions, and strategies) will affect the price of an asset.
That’s the technical side of trading. Here’s where I want you to integrate trading into your life…
Trading Is A Lifestyle
It’s not just about making money — it’s about integrating trading into your lifestyle.
You need to find the right markets, time, time frame, styles, strategy and approach.
Trading is like hitting the gym; it requires discipline, consistency, and a whole lot of sweat equity.
And just like you don’t get a six-pack or lose weight after ONE workout.
You shouldn’t expect to master trading overnight.
It’s a routine you build day by day.
A typical trading day might include:
Pre-market analysis (Weekly bias):
You need to check what’s happening in the world with other markets with both Asian, American, European and even London session.
You also need to look at the US Economic Calendar to see what news is arising for the week.
Analyse and Execute trades:
Once done the pre analysis, you need to do the actual analysis. See what trades are lining up according to your proven strategy. And if anything looks good to go EXECUTE.
Review and track your trades:
This is where you will reflect on what went right and what went wrong. This is where you’ll track and review your trades that lined up to add to your journal.
The key takeaway: Trading isn’t just what you do; it’s who you become.
Trading Is a Forever Game
When it comes to trading, think long-term.
Like, REALLY long-term. Because trading is a forever game.
Unlike sports with seasons or video games with levels, trading doesn’t end.
The markets will be there tomorrow, next week, and 100 years from now.
And as a trader, your mission is to stay in the game for the long haul.
That means managing your risk, protecting your capital, and always looking to improve your skills.
Trading Is A Business Where YOU Are The Boss
The beauty of trading?
You’re in control.
Trading is a business, and you are the CEO.
You call the shots, decide when to enter and exit trades, and ultimately, you take control of your financial destiny.
Like any business, trading requires:
Planning and strategy:
Risk and reward management:
Tracking performance and improving:
And, just like in any business, you’ll make mistakes.
But those mistakes are not failures; they’re lessons.
You learn from them, adapt, and get better. That’s what makes trading such an empowering journey.
Final Words:
Financial trading is more than a job, a hobby, or a side hustle.
It’s a process-driven approach to decision-making, a lifestyle to live, a forever game to play, and a business where you’re in charge.
If done right, trading can be one of the most rewarding pursuits you’ll ever undertake.
Key Takeaways
Trading is a process: Follow a set strategy, criteria, and rules for success.
Trading is a lifestyle: Incorporate trading into your daily routine and stick with it consistently.
Trading is a forever game: It’s not a one-time event; it’s a lifelong pursuit.
Trading is a business: You’re the CEO — plan your moves, manage your risk, and take charge of your financial destiny.

GOLD 4H CHART ROUTE MAP UPDATE & TRADING PLAN FOR THE WEEKHey Everyone,
Please see our updated 4h chart levels and targets for the coming week.
We are seeing price play between two weighted levels with a gap above at 4333 and a gap below at 4225. We will need to see ema5 cross and lock on either weighted level to determine the next range.
We will see levels tested side by side until one of the weighted levels break and lock to confirm direction for the next range.
We will keep the above in mind when taking buys from dips. Our updated levels and weighted levels will allow us to track the movement down and then catch bounces up.
We will continue to buy dips using our support levels taking 20 to 40 pips. As stated before each of our level structures give 20 to 40 pip bounces, which is enough for a nice entry and exit. If you back test the levels we shared every week for the past 24 months, you can see how effectively they were used to trade with or against short/mid term swings and trends.
The swing range give bigger bounces then our weighted levels that's the difference between weighted levels and swing ranges.
BULLISH TARGET
4333
EMA5 CROSS AND LOCK ABOVE 4333 WILL OPEN THE FOLLOWING BULLISH TARGETS
4422
EMA5 CROSS AND LOCK ABOVE 4422 WILL OPEN THE FOLLOWING BULLISH TARGET
4494
EMA5 CROSS AND LOCK ABOVE 4494 WILL OPEN THE FOLLOWING BULLISH TARGET
4572
BEARISH TARGETS
4225
EMA5 CROSS AND LOCK BELOW 4225 WILL OPEN THE FOLLOWING BEARISH TARGET
3985
EMA5 CROSS AND LOCK BELOW 4122 WILL OPEN THE SWING RANGE
3985
3857
EMA5 CROSS AND LOCK BELOW 3857 WILL OPEN THE SECONDARY SWING RANGE
3741
3632
As always, we will keep you all updated with regular updates throughout the week and how we manage the active ideas and setups. Thank you all for your likes, comments and follows, we really appreciate it!
Mr Gold
GoldViewFX

GOLD DAILY CHART ROUTE MAP UPDATEHey everyone,
Check out our updated Daily Chart Route Map, now featuring updated levels for tracking Golds movement.
We’ve refined our proprietary Goldturn Channel, our unique method for constructing ascending channels. Price action recently broke out above the channel, with a body close above 4325, leaving a long-term gap open near 4444.
Currently, we’re observing rejection at 4325, and our channel top is now acting as support. The market is range-bound between 4325 (resistance) and 4183 (channel top as support). A decisive break above or below either of these levels will help define the next directional move, keeping in mind the open gap overhead at 4444.
On the downside, 3961 remains the pivotal swing zone, aligning with the channel midline, should we see a confirmed break below 4183.
As always, we will keep you all updated with regular updates throughout the week and how we manage the active ideas and setups. Thank you all for your likes, comments and follows, we really appreciate it!
Mr Gold
GoldViewFX

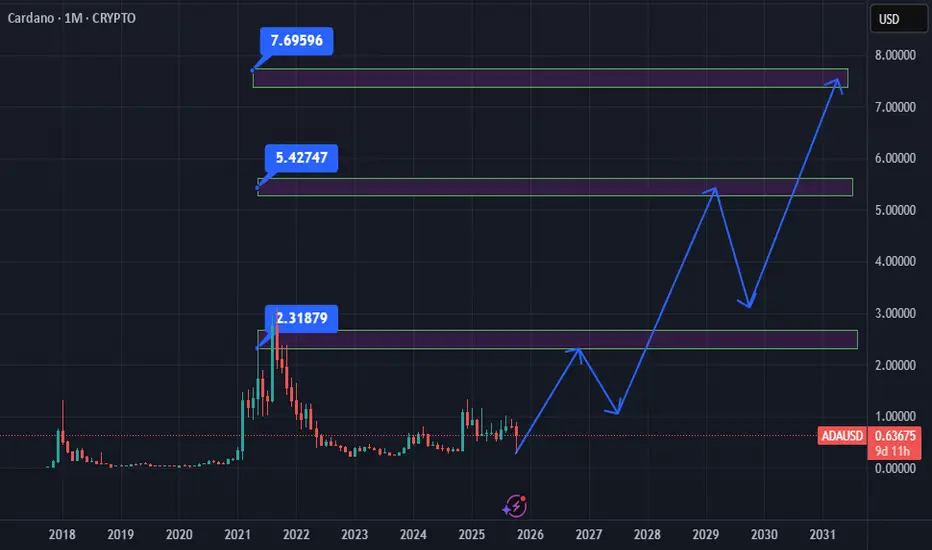
Cardano/ADA Primed for Explosion: Key Targets Up to $5The chart should display sufficient key points and important levels while maintaining simplicity and order, avoiding clutter – this is what true analysis means. These levels in the monthly timeframe provide ideal zones for long-term investors to enter and exit, and offer traders a broader movement perspective since we're in a higher timeframe BINANCE:ADAUSD
ES (SPX, SPY) Analysis, Key Levels, Setups for Wed (Oct 22)Key catalysts and schedule (ET): The federal shutdown continues, pausing most government statistics. There is no 8:30am tier-1 macro release expected. The energy markets will receive the EIA Weekly Petroleum Status Report at 10:30am. Of particular note, the Fed’s Michael Barr is scheduled to speak during the U.S. day, a potential market-moving event. Earnings reports from AT&T, Thermo Fisher, Boston Scientific, and Vertiv before the open, and IBM after the close, could also sway the index mood.
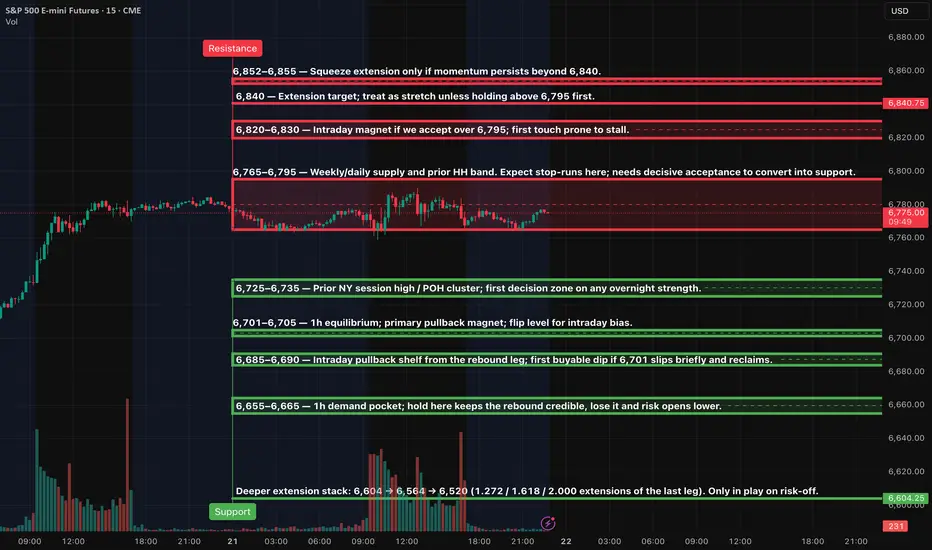
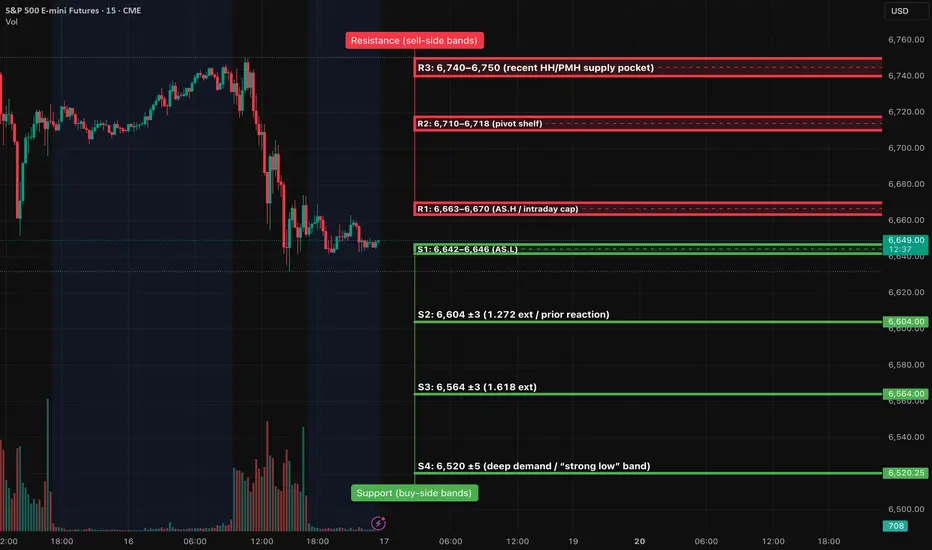
Key zones — resistance: The 6,765–6,795 zone, serving as the weekly/daily supply and prior high-high band, remains a crucial area of focus. It is the first ceiling to consider. The 6,820–6,830 zone becomes an intraday magnet if we manage to hold above 6,795. The 6,840 stretch target is a significant level that requires time above 6,795 first. The 6,852–6,855 zone is a potential squeeze extension, but only if momentum persists beyond 6,840.
Key zones — support: 6,725–6,735 is the prior NY session high / POH pocket and first decision area on any overnight strength that fades; 6,701–6,705 is the 1h equilibrium and flip line for intraday bias; 6,685–6,690 is the intraday pullback shelf and first buyable dip if 6,701 briefly slips and reclaims; 6,655–6,665 is the 1h demand pocket that keeps the rebound credible; 6,604 is the deeper extension stack that only comes into play on risk-off.
Overnight → NY forecast: baseline expectation is a range build under the 6,765–6,795 ceiling with stop-runs into the band and fades back toward 6,735 and 6,705; acceptance and sustained holding above 6,795 turns the tape constructive toward 6,820–6,830, with a paced push to 6,840 and only a momentum extension opening 6,852–6,855; loss of 6,701 during Asia/London that does not quickly reclaim tilts the path toward 6,690 and 6,665 before buyers try again; if 6,665 gives way decisively, risk opens to 6,604 where a larger bounce attempt is favored.
Setups (Level-KZ Protocol, 15m→5m→1m)
Short fade at the 6,765–6,795 band on the first clean test: enter on a 15m close back inside the band and a 5m re-close with a lower-high; place SL above 6,805–6,810; target 6,735 for TP1, 6,705 for TP2, 6,690 for TP3; if TP1 prints, close 70% and set the 30% runner to BE.
Long continuation only after real acceptance above 6,795: wait for a 15m full-body close above, then buy the 5m pullback that holds 6,795–6,800; SL 6,785; target 6,820–6,830 for TP1, 6,840 for TP2, 6,852–6,855 for TP3.
Quick-reclaim bounce at 6,701–6,705: if we sweep 6,701 and instantly reclaim on 1m/5m, buy the reclaim with SL 6,695; target 6,735 for TP1, 6,771–6,780 for TP2, 6,795 test for TP3.
Deeper flush-and-reverse at 6,655–6,665: buy only on confirmation (15m wick-rejection + 5m higher-low); SL 6,649; target 6,690 for TP1, 6,705 for TP2, 6,735 for TP3.
Bear continuation only if 6,701 is lost and holds below: sell the underside retest of 6,701–6,705; SL 6,712; target 6,690 for TP1, 6,665 for TP2, 6,604 extension for TP3 if momentum expands.
Bias and invalidation: The market currently exhibits a ' two-sided bias ', meaning it is neither bullish nor bearish, while we are trapped between 6,705 and 6,795. The tape turns constructive for extensions only after holding above 6,795 for multiple 15m closes. The intraday bias flips lower if we slip and cannot reclaim 6,701 on 15m closes. Invalidate any long if 6,665 breaks and holds; invalidate any short if we base above 6,830 and the first pullback defends 6,820.
Kill-zones and execution plan: Asia (20:00–00:00 ET) is optional and sized down; look for the 6,701 sweep/reclaim; London (02:00–05:00 ET) favors range probes into 6,735 or 6,705; NY AM (09:30–11:00 ET) is primary — fade the first touch of 6,795 if we gap under it, or buy the 6,795 pullback if we gap and hold above; manage lunch as maintenance only (12:00–13:00 ET); NY PM (13:30–16:00 ET) allows a final push toward 6,840 only if 6,820–6,830 converts to a floor.
Risk and management rules (applied to all plays): use a hard stop anchored to the relevant 15m wick ±0.25–0.50; take no partials before TP1; at TP1 close 70% and move the runner to BE; allow no more than two attempts per level per session; time-stop any trade that hasn’t hit TP1 or SL within 45–60 minutes.
GOLD 1H CHART ROUTE MAP UPDATE & TRADING PLAN FOR THE WEEKHey Everyone,
Please see our updated 1h chart levels and targets for the coming week.
We are seeing price play between two weighted levels with a gap above at 4275 and a gap below at 4229. We will need to see ema5 cross and lock on either weighted level to determine the next range.
We will see levels tested side by side until one of the weighted levels break and lock to confirm direction for the next range.
We will keep the above in mind when taking buys from dips. Our updated levels and weighted levels will allow us to track the movement down and then catch bounces up.
We will continue to buy dips using our support levels taking 20 to 40 pips. As stated before each of our level structures give 20 to 40 pip bounces, which is enough for a nice entry and exit. If you back test the levels we shared every week for the past 24 months, you can see how effectively they were used to trade with or against short/mid term swings and trends.
The swing range give bigger bounces then our weighted levels that's the difference between weighted levels and swing ranges.
BULLISH TARGET
275
EMA5 CROSS AND LOCK ABOVE 4275 WILL OPEN THE FOLLOWING BULLISH TARGETS
4320
EMA5 CROSS AND LOCK ABOVE 4320 WILL OPEN THE FOLLOWING BULLISH TARGET
4360
BEARISH TARGETS
4229
EMA5 CROSS AND LOCK BELOW 4229 WILL OPEN THE FOLLOWING BEARISH TARGET
4194
EMA5 CROSS AND LOCK BELOW 4194 WILL OPEN THE FOLLOWING BEARISH TARGET
4151
EMA5 CROSS AND LOCK BELOW 4151 WILL OPEN THE SWING RANGE
4122
4075
EMA5 CROSS AND LOCK BELOW 4075 WILL OPEN THE SECONDAARY SWING RANGE
4022
3955
As always, we will keep you all updated with regular updates throughout the week and how we manage the active ideas and setups. Thank you all for your likes, comments and follows, we really appreciate it!
Mr Gold
GoldViewFX

XAUUSD-GOLD 1H Chart—SELL Setup with 3 Profit TargetsHello Guys,
Here’s my 1-hour XAUUSD-GOLD analysis for you.
These are the exact SELL levels I’ll be watching:
🔵SELL level: 4285.9
🔴 Stop level:4335.3 (or adjust based on your own margin)
🟢 TP1: 4264.8
🟢 TP2: 4232.1
🟢 TP3: 4185.0
Risk-to-reward ratio on this setup: 2.05
If XAUUSD-GOLD reaches these levels, I’ll definitely take a SELL position.
Every like is my biggest motivation to keep sharing these analyses.
Thanks to everyone supporting me!

Global Commodity Trends: An In-Depth Analysis1. Overview of Commodity Categories
Commodities can broadly be categorized into three segments:
Energy Commodities – including crude oil, natural gas, coal, and renewable energy components.
Metal Commodities – comprising precious metals (gold, silver, platinum) and industrial metals (copper, aluminum, nickel, lithium).
Agricultural Commodities – such as grains, oilseeds, coffee, cotton, and sugar.
Each sector operates under different economic drivers but shares common threads: cyclical demand, global trade dependency, and vulnerability to geopolitical and climatic disruptions.
2. Energy Commodities: Shifting Power Dynamics
Oil Market Evolution
Crude oil remains the most influential commodity, dictating the rhythm of the global economy. After years of volatility, oil prices in 2025 have stabilized between $75–$90 per barrel, balancing between OPEC+ production controls and demand recovery in post-pandemic industrial economies. Key trends influencing the oil market include:
Geopolitical Tensions: Conflicts in the Middle East, Russia-Ukraine tensions, and sanctions have repeatedly disrupted supply routes and reshaped trade alliances.
Energy Transition: Many nations are reducing fossil fuel dependence, creating dual effects—investment withdrawal from oil projects and short-term supply tightness.
US Shale Resurgence: Technological improvements have revived U.S. shale production, moderating price spikes and diversifying global supply sources.
Natural Gas and LNG Boom
The liquefied natural gas (LNG) market has become a critical player in global energy security. Europe’s pivot away from Russian pipeline gas has spurred demand for LNG imports from the U.S., Qatar, and Australia. Asian markets—particularly India, Japan, and South Korea—are also expanding their LNG infrastructure. Prices remain elevated due to limited shipping capacity and long-term contract negotiations.
Renewable Commodities
The renewable sector is emerging as a commodity class of its own. Materials essential for wind turbines, solar panels, and batteries—like lithium, cobalt, and rare earth elements—are now strategically significant. Nations rich in these resources, such as Chile (lithium), the Democratic Republic of Congo (cobalt), and China (rare earths), have gained economic leverage in the green transition era.
3. Metal Commodities: Industrial and Technological Backbone
Copper: The ‘New Oil’ of Electrification
Copper is a vital indicator of global industrial health and the clean energy revolution. With rising demand from electric vehicles (EVs), grid expansion, and renewable infrastructure, copper prices have remained strong, hovering near $9,000–$10,000 per metric ton in 2025. However, supply shortages from major producers like Chile and Peru continue to pressure the market. Technological exploration and recycling have become key to meeting demand sustainably.
Aluminum and Steel: Industrial Expansion
Global infrastructure projects—particularly in India, Southeast Asia, and Africa—have driven demand for aluminum and steel. China’s gradual construction slowdown has been offset by growth in emerging markets. Decarbonization efforts have also led to “green steel” innovations, with major producers investing in hydrogen-based smelting technologies.
Precious Metals: Inflation Hedges
Gold remains a preferred hedge against inflation, currency devaluation, and financial instability. In 2025, gold prices are resilient around $2,100 per ounce, supported by central bank purchases and investor uncertainty about global debt sustainability. Silver, platinum, and palladium also benefit from industrial use in electronics, solar energy, and automotive catalysis.
Critical Minerals and Rare Earths
The rise of electric mobility and digital technologies has made critical minerals central to geopolitical competition. Nations are now securing mineral supply chains to reduce dependence on single-country producers. The U.S. and EU have launched strategic mineral alliances to diversify sourcing and encourage domestic mining.
4. Agricultural Commodities: Weather, Demand, and Technology
Food Security Challenges
Global food prices have experienced volatility due to extreme weather, conflict disruptions, and changing consumption patterns. Droughts in key grain-producing regions (such as North America and Australia) have tightened wheat and corn supplies, while El Niño weather patterns have affected rice production in Asia.
Grains and Oilseeds
Wheat and Corn: Prices remain firm as global demand for animal feed and biofuels continues to grow.
Soybeans: Driven by rising protein consumption in developing economies and biofuel production in the U.S. and Brazil, soybean demand remains robust.
Rice: Export restrictions by major producers like India in 2024–25 have kept rice prices elevated, intensifying food inflation pressures in Africa and Asia.
Soft Commodities: Coffee, Cocoa, and Cotton
Coffee and cocoa markets face supply disruptions due to unpredictable weather and labor shortages. Meanwhile, cotton prices have stabilized as global textile demand recovers post-pandemic. However, sustainability standards and organic production are reshaping trade patterns, with premium pricing for ethically sourced materials.
Technological Innovation in Agriculture
Precision farming, AI-driven weather forecasting, and genetically resilient crops are transforming agricultural productivity. These innovations aim to balance yield improvements with sustainability and environmental preservation, reducing the carbon footprint of global agriculture.
5. Geopolitical and Economic Influences
Global commodity trends are closely tied to geopolitics and macroeconomics. Several key developments have reshaped the landscape:
Trade Wars and Sanctions: The U.S.–China trade rivalry and sanctions on Russia and Iran have disrupted traditional commodity flows, leading to new alliances among BRICS nations.
Currency Movements: A strong U.S. dollar often suppresses commodity prices by making them costlier for non-dollar economies. However, increasing talk of “de-dollarization” could redefine commodity pricing in the long term.
Global Inflation and Interest Rates: Higher interest rates have tempered speculative investments in commodities, yet inflationary pressures from supply chain disruptions continue to sustain price floors.
Environmental Regulations: Climate policies and carbon taxes are influencing production costs and trade competitiveness, particularly in energy and metals sectors.
6. Technological and Structural Shifts
Digitalization and Smart Commodities
Blockchain and AI technologies are revolutionizing commodity trading systems. Digital platforms now enable transparent pricing, efficient logistics, and reduced transaction costs. Smart contracts in blockchain-based trade reduce fraud and enhance traceability from mines to markets.
Green Commodities and ESG Investments
Investors increasingly favor environmentally and socially responsible commodities. ESG (Environmental, Social, and Governance) frameworks are pushing companies to disclose emissions data, human rights practices, and sustainability metrics. This shift is influencing how commodity-backed financial instruments are structured and traded.
Automation in Mining and Logistics
Robotics, automation, and remote monitoring have transformed mining and shipping operations, reducing costs and improving safety. Autonomous drilling and AI-based maintenance systems enhance operational efficiency across industries dependent on raw materials.
7. Regional Insights
Asia-Pacific
Asia remains the largest consumer of commodities, with China and India leading demand for energy, metals, and food. India’s industrial expansion and renewable energy programs are reshaping regional trade flows. Southeast Asian nations are emerging as key exporters of palm oil, rubber, and rare earths.
North America
The U.S. and Canada benefit from abundant energy and agricultural resources. The shale industry revival and strategic mineral exploration position North America as a stable supplier amidst global uncertainty.
Europe
Europe’s energy diversification post-Ukraine war has accelerated investment in renewables, hydrogen, and circular economy practices. High carbon pricing has also made European industries more sustainable but less cost-competitive globally.
Africa and Latin America
These regions are rich in untapped resources, from lithium in Chile and Argentina to cobalt in the DRC and oil in Nigeria. However, political instability and infrastructure challenges hinder full potential. Strategic partnerships with China and Western investors aim to modernize extraction and processing industries.
8. Challenges Ahead
Despite progress, several structural challenges persist in global commodity markets:
Supply Chain Fragmentation: Geopolitical rivalries threaten trade connectivity.
Climate Risks: Extreme weather events continue to impact yields, mining operations, and energy supply.
Resource Nationalism: Governments are asserting greater control over natural resources, imposing export restrictions or windfall taxes.
Market Volatility: Speculative trading and financial derivatives amplify short-term price fluctuations, complicating investment planning.
Sustainability Pressure: Transitioning to low-carbon operations requires significant capital and policy alignment across nations.
9. The Future of Commodity Markets
Looking ahead to 2030 and beyond, the global commodity landscape is expected to be shaped by four major forces:
Energy Transition Acceleration: The world will see greater integration of renewables, hydrogen, and energy storage, reducing fossil fuel dependency but increasing demand for critical minerals.
Technological Integration: AI, blockchain, and predictive analytics will dominate commodity trading, making markets more transparent and efficient.
Sustainable Agriculture: Climate-resilient crops and smart irrigation will redefine global food systems.
Geopolitical Realignment: Multipolar trade networks among BRICS+ nations will challenge traditional commodity pricing systems dominated by Western economies.
Conclusion
Global commodity trends in 2025 reveal a dynamic interplay of energy transformation, technological evolution, and geopolitical recalibration. While oil and gas remain vital to short-term stability, the long-term trajectory points toward green minerals, digital commodities, and sustainable agriculture. The world is navigating a complex transition where supply chains, trade policies, and investment strategies must adapt to environmental and political realities. In essence, commodities have evolved from mere tradable goods into strategic instruments of power, policy, and progress. Managing this transformation with foresight, equity, and sustainability will define the resilience of the global economy in the years ahead.
GOLD 4H CHART ROUTE MAP Hey Everyone,
This is an extended 4H chart idea, continuing from our previous analysis, now with the added Goldturn levels above, allowing us to continue to track ongoing movement.
After completing the 4212 move, price continued to push upward, leaving a small gap near 4383 before facing rejection. We’re now seeing price retest the lower Goldturn levels for support, with a current test around the 4212 Goldturn. The 4212–4154 zone remains a key weighted area, and as long as price holds above this zone, we may see a potential bounce.
We’ll return on Sunday with our multi-timeframe roadmap and trading plans for the week ahead. Thank you all once again for your continued support, likes, and comments, we truly appreciate it.
Mr. Gold
GoldViewFX

ES (SPX, SPY) Analysis, Key Levels, Setups For Fri (Oct 17)MACRO SCHEDULE (ET) — confirmed not impacted by shutdown
• NY AM: No confirmed 8:30 ET U.S. government releases (data blackout continues).
• 16:15 — Fed H.8 (weekly bank data) — after cash close; limited intraday impact.
BIAS:
• Short-term momentum is down; price sits in the lower half of this week’s range.
• Expect a liquidity probe lower in London, then a bounce attempt into NY AM if key demand holds.
SETUPS — Level-KZ Protocol (15m→5m→1m)
Tier-1 (A++) — Continuation SHORT from R1/R2
Trigger: 15m rejection back below 6,663–6,670 ➜ 5m re-close below with LH ➜ 1m first pullback fails.
Entry: 6,658–6,662.
SL: Above 15m trigger wick +0.25–0.50.
TP1: 6,604 (≥2.0R gate). TP2: 6,564. TP3: 6,520.
Tier-1 (A++) — Acceptance SHORT below S1
Trigger: 15m full-body close < 6,642 ➜ 5m pullback holds below ➜ 1m LH entry.
Entry: 6,638–6,641.
SL: Above 6,646 +0.25–0.50.
Targets: TP1 6,604; TP2 6,564; TP3 6,520. Management as above.
Tier-2 (A+ Bounce) — Quick-Reclaim LONG at S2
Trigger: Fast sweep below 6,604 with immediate 15m reclaim ➜ 5m hold/re-close above ➜ 1m HL entry.
Entry: 6,605–6,609.
SL: 6,596–6,598 (15m wick low −0.25–0.50).
TP1: 6,663; TP2: 6,690–6,700. Size ¾.
Tier-3 (A Bounce) — Exhaustion LONG at S3
Trigger: Flush into 6,564 ±3 with capitulation wick and 15m momentum pivot ➜ 5m HL ➜ 1m trigger.
SL: Below 6,556–6,558.
TP1: 6,604; TP2: 6,663. Size ½.
INVALIDATION:
• Invalidate long bias if 15m accepts below 6,564 (two 15m bodies or one decisive close ≥1.5pt).
• Invalidate short bias if 15m accepts above 6,718 and holds.
• Max 2 attempts per level per session; stop trading at −2R net or after +3R net.
NEWS / HEADLINE NOTES
With government data paused, price will be more technically driven. Fed headlines can spark brief moves; prioritize level reactions over narrative.
Earnings/gamma flows may add noise near R1 (6,663–6,670) and R2 (6,710–6,718).
GOLD DAILY CHART ROUTE MAP UPDATEDaily Chart Update – Goldturn Channel Analysis
Hey Traders,
After successfully completing our previous Daily chart projection, we’re excited to share our latest Goldturn Channel update and Daily chart idea, our proprietary method of identifying structural turning points within Golds ascending channel formation.
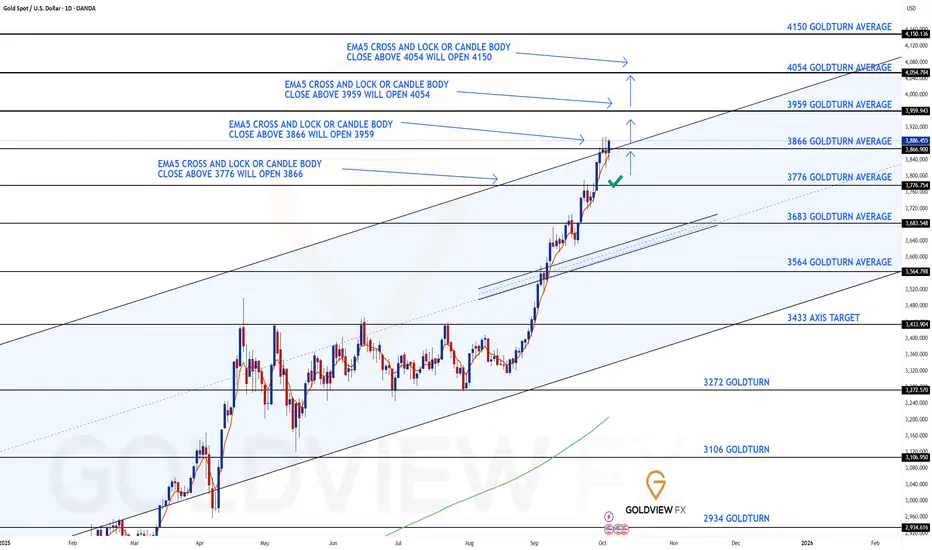
Price action has now reached the upper boundary of the Goldturn channel, following a precise move to the 3866 target, triggered by the body close above 3776. With a new body close above 3866, we now have the 3959 gap open.
The 3866 channel top area remains a critical inflection point:
A confirmed EMA5 cross and lock above the channel top would strengthen the bullish breakout structure.
Conversely, an EMA5 rejection or close back below this level may indicate a fake out or short-term exhaustion.
On the downside, 3766 now acts as the nearest dynamic support, while 3683 aligns with the channel midline and remains a key structural pivot should deeper correction unfold.
As always, we will keep you all updated with regular updates throughout the week and how we manage the active ideas and setups. Thank you all for your likes, comments and follows, we really appreciate it!
Mr Gold
GoldViewFX
Introduction to Regional Price Differences1. Definition and Concept of Regional Price Differences
Regional price differences occur when the cost of a product or service varies between regions due to a combination of factors such as transportation costs, local demand and supply conditions, taxes, and market competition. These differences are not limited to goods alone but also extend to services like housing, healthcare, and education.
For example, the price of a smartphone may differ between metropolitan cities and rural areas due to logistical costs and varying consumer purchasing power. Regional price differences highlight the economic disparities between regions and help in understanding regional market dynamics.
2. Factors Causing Regional Price Differences
Several factors contribute to the variations in prices across regions:
Transportation and Logistics: Shipping goods over long distances increases costs. Remote areas often pay higher prices due to transportation expenses.
Supply and Demand: Products in high demand in a particular region may be priced higher, while in areas of oversupply, prices tend to drop.
Taxes and Regulations: Different regions impose varied taxes, tariffs, and regulatory costs, affecting final prices.
Local Economic Conditions: Income levels, employment rates, and regional economic health influence what consumers can pay.
Market Competition: More competitive markets often have lower prices, while monopolistic or limited-supply regions may experience higher prices.
3. Importance for Businesses
Understanding regional price differences is vital for businesses to develop effective pricing strategies. By analyzing these variations, companies can:
Optimize profit margins by adjusting prices according to regional purchasing power.
Decide on the best locations for distribution and retail.
Design promotional strategies tailored to local market conditions.
For instance, a luxury brand may price products higher in urban areas where consumers have more disposable income, while offering discounts or lower prices in rural regions to boost sales.
4. Role in International Trade
Regional price differences also play a significant role in international trade. Countries with lower production costs or cheaper labor can export products at lower prices, creating competitive advantages. Conversely, regions with higher prices may import goods to meet consumer demand at affordable rates.
For example, agricultural products from developing countries may be cheaper than in developed countries due to lower labor costs, influencing global trade patterns and consumer choices.
5. Price Arbitrage and Market Efficiency
Price differences create opportunities for arbitrage, where traders buy products in a low-price region and sell them in a high-price region, earning profits from the difference. This mechanism helps in balancing prices over time, promoting market efficiency.
However, transportation costs, tariffs, and market access restrictions may limit arbitrage. For instance, oil or gas price differences between countries often lead to international trading strategies designed to exploit these variations.
6. Consumer Behavior and Regional Pricing
Regional price differences directly affect consumer behavior. Consumers often make purchasing decisions based on price sensitivity:
In high-price regions, buyers may reduce consumption, switch to alternatives, or seek imports.
In low-price regions, consumers may increase consumption or attract traders from high-price areas.
Understanding these patterns helps businesses and policymakers anticipate demand fluctuations and plan accordingly.
7. Government Policies and Interventions
Governments often intervene to address regional price differences, especially for essential goods. Policies include:
Subsidies: Lowering the cost of goods in high-price regions.
Price Controls: Fixing maximum prices to protect consumers.
Infrastructure Development: Reducing logistics costs to equalize prices between regions.
Such measures ensure affordability, reduce regional inequality, and stabilize markets.
8. Impact on Inflation Measurement
Regional price differences can distort inflation indices if not accounted for. For instance, the Consumer Price Index (CPI) may vary significantly between urban and rural areas. Policymakers often use weighted averages or regional indices to capture the true impact of inflation on households across different regions.
Ignoring regional differences could mislead monetary policy decisions, affecting interest rates, taxation, and social welfare programs.
9. Technological and Digital Influence
Technology and e-commerce platforms are gradually reducing regional price differences. Online marketplaces allow consumers to access products from anywhere, often at competitive prices.
Price Comparison Tools: Help consumers find the lowest prices across regions.
Digital Payments and Logistics Solutions: Facilitate faster, cheaper movement of goods.
However, challenges remain, such as last-mile delivery costs, regional taxes, and local market conditions.
10. Future Trends and Implications
Regional price differences will continue to evolve with globalization, technology, and changing consumer behavior. Key trends include:
Increased Market Transparency: Consumers can compare prices globally, narrowing differences.
Dynamic Pricing Models: Businesses will adopt region-specific pricing using AI and big data.
Sustainable Supply Chains: Reducing logistics and production costs may lead to more uniform pricing.
Policy Adjustments: Governments may enhance infrastructure and regulations to ensure equitable access to goods.
Understanding these dynamics is crucial for businesses, investors, and policymakers to remain competitive and responsive to market needs.
Conclusion
Regional price differences are a fundamental feature of economic markets, influenced by a combination of supply-demand dynamics, logistics, government policies, and technological developments. They impact businesses, consumers, and trade flows while offering opportunities for profit and efficiency. By analyzing these differences, stakeholders can make informed decisions, ensure fair pricing, and contribute to regional economic development.
Future Trends in Global Index Trading1. Expansion of Thematic and Sector-Based Indices
Traditional indices like the S&P 500 or FTSE 100 are giving way to thematic indices that focus on specific industries or megatrends such as artificial intelligence, green energy, cybersecurity, biotechnology, and space technology.
Investors are increasingly allocating capital toward sectors that align with technological innovation or sustainability goals. This evolution will diversify index offerings and allow traders to gain exposure to cutting-edge sectors without needing to pick individual stocks.
For example, ESG and renewable energy indices are expected to attract major institutional inflows as global decarbonization policies intensify. Similarly, AI-focused indices will become a major attraction as machine learning reshapes corporate productivity.
2. Rise of AI and Algorithmic Trading in Index Management
Artificial Intelligence (AI) and algorithmic models are transforming index trading by enhancing speed, accuracy, and decision-making.
Advanced algorithms analyze massive data sets in real time, predicting market sentiment, volatility, and correlations between global indices. These tools enable traders to rebalance portfolios instantly and exploit arbitrage opportunities.
In the future, AI-driven “smart indices” could automatically adjust their weightings based on macroeconomic conditions, geopolitical risk, or investor sentiment — creating dynamic, self-optimizing benchmarks rather than static ones.
3. Increased Popularity of Passive Investing and ETFs
Over the past decade, passive index funds and exchange-traded funds (ETFs) have outperformed most active managers. This trend will continue as investors seek low-cost, diversified exposure to global markets.
Global ETF assets are projected to surpass $20 trillion by 2030, largely fueled by index-linked strategies. As more retail and institutional investors favor passive investing, liquidity in major indices like the MSCI World, NASDAQ-100, and Nifty 50 will deepen.
Moreover, fractional and automated ETF investing platforms will make index exposure more accessible, further democratizing global market participation.
4. Integration of ESG (Environmental, Social, and Governance) Criteria
Sustainability will be one of the defining features of future global index construction. Regulators and investors alike are demanding transparency, ethical governance, and environmental accountability.
ESG indices will not only track performance but also quantify corporate sustainability using measurable metrics such as carbon footprint, social equity, and board diversity.
In the next decade, “green indices” may become a mainstream benchmark, influencing capital allocation toward responsible corporations. Investors will increasingly use carbon-adjusted indices or climate risk-weighted indices to mitigate environmental exposure.
5. Real-Time Global Connectivity and 24/7 Trading
With technology reducing barriers between global markets, the concept of 24/7 trading across indices is becoming a reality.
Cryptocurrency markets already operate continuously, setting the precedent for traditional markets to follow. Index futures and global ETFs may soon be traded around the clock, allowing traders to react instantly to geopolitical or economic developments in any region.
Enhanced inter-market connectivity among exchanges in Asia, Europe, and North America will ensure smoother liquidity flow and minimize regional trading gaps.
6. Blockchain and Tokenization of Indices
Blockchain technology will revolutionize how indices are built, traded, and settled. Through tokenization, entire indices could be represented as digital tokens, allowing investors to buy fractional shares of global market indices seamlessly.
This innovation will make global index trading more transparent, secure, and accessible, particularly for retail investors.
Smart contracts could automate dividend distribution, rebalancing, and settlement, while decentralized finance (DeFi) platforms may introduce index-backed synthetic assets, enabling trading beyond traditional market hours.
The fusion of blockchain and finance will create a borderless, low-cost trading environment.
7. Customizable and Personalized Index Products
Investors of the future will demand customized indices that align with their personal risk tolerance, ethical values, or investment objectives.
Through AI-based portfolio construction, traders could create personal indices tracking specific sets of companies, sectors, or regions — effectively blending active and passive investing.
Robo-advisors and fintech platforms are already offering custom index portfolios that automatically rebalance based on user preferences, risk profiles, or global market movements.
This personalization trend will redefine how investors interact with global indices, making index trading both dynamic and individual-centric.
8. Data-Driven Trading and Predictive Analytics
The future of global index trading will rely heavily on big data, alternative data, and predictive analytics.
Beyond financial metrics, traders will analyze satellite imagery, shipping data, internet traffic, and sentiment analysis from social media to anticipate index trends.
Predictive models powered by machine learning will improve timing, reduce drawdowns, and identify early signals of macroeconomic shifts.
For example, sentiment data from millions of online sources could forecast the next market correction or bull run before it appears in traditional indicators.
Data-driven decision-making will become the cornerstone of competitive index trading.
9. Geopolitical and Economic Diversification
Global index traders must increasingly account for geopolitical risk, trade tensions, and currency fluctuations.
The rise of regional economic blocs — such as BRICS expansion, Asian market integration, and European green reforms — will lead to new regional index compositions.
Diversification across multiple regions will become essential to hedge against localized shocks like war, inflation, or policy shifts.
Future indices will incorporate multi-currency and multi-region components, helping investors reduce exposure to any single market’s volatility.
This diversification will also open opportunities for cross-border arbitrage and currency-hedged index products.
10. Regulatory Evolution and Market Transparency
As global index trading expands, regulatory oversight will strengthen. Authorities such as SEBI, SEC, and ESMA are developing frameworks to ensure data integrity, transparency, and investor protection in index creation and trading.
Future regulations will likely require disclosure of index methodologies, weighting criteria, and data sources, ensuring fairness and accountability.
Moreover, with the rise of AI and algorithmic trading, governments will impose ethical and operational standards to prevent manipulation and systemic risk.
Enhanced transparency will foster trust, attract more institutional participation, and create a stable global trading ecosystem.
Conclusion
The future of global index trading will be defined by technology-driven transformation, investor empowerment, and sustainable innovation.
AI, blockchain, ESG integration, and data analytics will reshape how indices are constructed, traded, and understood. The line between active and passive investing will blur as markets evolve toward automation, customization, and inclusivity.
As global economies become more interconnected, traders who embrace these trends — combining digital intelligence with strategic diversification — will thrive in the next generation of financial markets.

GOLD 4H CHART ROUTE MAP UPDATE & TRADING PLAN FOR THE WEEKHey Everyone,
Please see our updated 4h chart levels and targets for the coming week.
We are seeing price play between two weighted levels with a gap above at 4041 and a gap below at 3978. We will need to see ema5 cross and lock on either weighted level to determine the next range.
We will see levels tested side by side until one of the weighted levels break and lock to confirm direction for the next range.
We will keep the above in mind when taking buys from dips. Our updated levels and weighted levels will allow us to track the movement down and then catch bounces up.
We will continue to buy dips using our support levels taking 20 to 40 pips. As stated before each of our level structures give 20 to 40 pip bounces, which is enough for a nice entry and exit. If you back test the levels we shared every week for the past 24 months, you can see how effectively they were used to trade with or against short/mid term swings and trends.
The swing range give bigger bounces then our weighted levels that's the difference between weighted levels and swing ranges.
BULLISH TARGET
4041
EMA5 CROSS AND LOCK ABOVE 4041 WILL OPEN THE FOLLOWING BULLISH TARGETS
4099
EMA5 CROSS AND LOCK ABOVE 4099 WILL OPEN THE FOLLOWING BULLISH TARGET
4154
EMA5 CROSS AND LOCK ABOVE 4154 WILL OPEN THE FOLLOWING BULLISH TARGET
4212
BEARISH TARGETS
3978
EMA5 CROSS AND LOCK BELOW 3978 WILL OPEN THE FOLLOWING BEARISH TARGET
3916
EMA5 CROSS AND LOCK BELOW 3916 WILL OPEN THE SWING RANGE
3840
3767
EMA5 CROSS AND LOCK BELOW 3767 WILL OPEN THE SECONDARY SWING RANGE
3689
3632
As always, we will keep you all updated with regular updates throughout the week and how we manage the active ideas and setups. Thank you all for your likes, comments and follows, we really appreciate it!
Mr Gold
GoldViewFX

Derivatives and Risk Management in Global Markets1. Introduction
In modern financial systems, derivatives are indispensable tools that shape the structure, strategy, and stability of global markets. They serve as critical instruments for managing risks, enhancing liquidity, and providing opportunities for speculation and arbitrage. Derivatives—contracts whose value is derived from underlying assets such as equities, commodities, currencies, interest rates, or indices—have transformed the way investors, corporations, and institutions navigate uncertainty.
The importance of derivatives has grown exponentially over the past four decades. From the early futures markets in Chicago to today’s complex over-the-counter (OTC) instruments, derivatives have become central to the global financial ecosystem. However, while they offer significant benefits in risk mitigation and capital efficiency, they also introduce systemic risks when used recklessly, as seen in crises such as the 2008 financial meltdown. Understanding derivatives and their role in risk management is thus essential for policymakers, traders, and global investors.
2. Concept and Nature of Derivatives
The term derivative originates from the idea that the instrument’s value “derives” from an underlying variable or asset. Derivatives are financial contracts that allow participants to transfer, hedge, or assume risk related to changes in asset prices, interest rates, exchange rates, or other market factors.
2.1 Types of Derivatives
Forward Contracts
A forward is a customized, over-the-counter agreement between two parties to buy or sell an asset at a predetermined price on a specific future date. These contracts are flexible but carry counterparty risk because they are not traded on regulated exchanges.
Futures Contracts
Futures are standardized forward contracts traded on organized exchanges. They are regulated and guaranteed by clearinghouses, which mitigate default risk. Futures are widely used for commodities, stock indices, and currencies.
Options
An option gives the holder the right, but not the obligation, to buy or sell an asset at a predetermined price within a specified period.
Call option: Right to buy.
Put option: Right to sell.
Options enable asymmetrical payoff structures, making them powerful hedging and speculative tools.
Swaps
A swap is a contractual agreement to exchange cash flows between two parties, typically to manage exposure to interest rates, currency movements, or credit risk. Common swaps include interest rate swaps, currency swaps, and credit default swaps (CDS).
Structured Derivatives
These combine features of multiple derivative types or are embedded in other securities. Examples include collateralized debt obligations (CDOs) and equity-linked notes (ELNs).
3. Growth and Globalization of Derivatives Markets
Since the 1980s, deregulation, financial innovation, and technological advancement have fueled the explosive growth of global derivatives. The notional value of outstanding derivatives now exceeds hundreds of trillions of dollars globally, encompassing exchange-traded and OTC markets.
3.1 Exchange-Traded Derivatives (ETDs)
ETDs are standardized instruments traded on regulated exchanges such as the Chicago Mercantile Exchange (CME), Intercontinental Exchange (ICE), Eurex, and the National Stock Exchange (NSE) of India. These markets provide transparency, liquidity, and margin requirements to ensure integrity.
3.2 Over-the-Counter (OTC) Derivatives
OTC derivatives are privately negotiated contracts between institutions, tailored to specific needs. They dominate in areas like interest rate swaps and credit derivatives. While offering flexibility, OTC products pose greater counterparty and systemic risks.
3.3 Drivers of Global Derivatives Expansion
Financial liberalization and globalization
Volatile interest rates, currencies, and commodities
Corporate demand for risk hedging
Technological innovations and algorithmic trading
Sophisticated financial engineering and product innovation
The globalization of finance has interconnected derivative markets across continents. Today, an oil futures contract traded in New York can influence hedging strategies in Singapore, while a currency swap in London might impact credit exposure in Mumbai.
4. Derivatives in Risk Management
Risk management is the art and science of identifying, assessing, and mitigating exposure to financial uncertainty. Derivatives serve as vital tools in this process. Their principal value lies not merely in speculation but in their ability to transfer risk efficiently among market participants.
4.1 Types of Financial Risks Managed by Derivatives
Market Risk
The risk of losses due to changes in asset prices, interest rates, or exchange rates. Futures and options are widely used to hedge such risks.
Interest Rate Risk
Corporations and banks use interest rate swaps and futures to stabilize borrowing costs or asset yields.
Currency (Exchange Rate) Risk
Multinational firms hedge foreign exchange exposure through forward contracts, currency options, or swaps to mitigate losses from currency fluctuations.
Commodity Price Risk
Producers, consumers, and traders use commodity derivatives to stabilize revenues or input costs. For example, airlines hedge jet fuel costs through oil futures.
Credit Risk
Credit derivatives like CDS help lenders transfer the risk of borrower default to other parties.
Liquidity and Volatility Risk
Derivatives like volatility indices (VIX futures) allow investors to hedge against unexpected market turbulence.
4.2 Corporate Hedging Strategies
Corporations utilize derivatives not for speculation but for risk stabilization. Examples include:
Airlines hedging fuel prices using crude oil futures.
Exporters hedging currency exposure through forward contracts.
Banks managing interest income volatility via interest rate swaps.
Portfolio managers using index futures to hedge market downturns.
These strategies protect firms from adverse price movements, enhance planning accuracy, and stabilize cash flows, which in turn supports long-term investment and profitability.
5. Speculation and Arbitrage
While hedging is risk-averse, speculation involves taking on risk in anticipation of profit from price movements. Derivatives amplify speculative opportunities because they require limited initial investment relative to their notional exposure—a phenomenon known as leverage. Traders use derivatives to bet on price directions of currencies, stocks, or commodities.
Arbitrage, on the other hand, involves exploiting price discrepancies in related markets to earn risk-free profits. For example:
Simultaneous purchase and sale of futures and spot assets when mispriced.
Cross-market arbitrage between exchanges in different countries.
Arbitrage activities improve market efficiency by aligning prices across markets.
However, speculative misuse or excessive leverage can destabilize markets, as seen in the collapse of Long-Term Capital Management (LTCM) in 1998 and the 2008 financial crisis.
6. Derivatives and Systemic Risk
Derivatives can amplify systemic risk when interconnected financial institutions face cascading defaults. The 2008 crisis exemplified this danger, as credit default swaps magnified the exposure of banks and insurance firms to mortgage-backed securities. The opacity of OTC contracts and high leverage contributed to widespread contagion.
6.1 Major Lessons from the 2008 Crisis
Lack of transparency in OTC markets increased counterparty risk.
Inadequate collateral and margin requirements led to credit exposures.
Complex structured products obscured true risk levels.
6.2 Regulatory Reforms Post-2008
In response, global regulators implemented sweeping reforms:
Central clearing mandates for standardized OTC derivatives.
Reporting obligations to trade repositories for transparency.
Higher capital and margin requirements for derivative exposures.
Regulatory bodies like ESMA, CFTC, and SEBI strengthened oversight.
These reforms have improved resilience but also shifted derivative activity toward exchange-traded platforms, enhancing systemic safety.
7. Valuation and Pricing of Derivatives
Derivative valuation relies on sophisticated mathematical models that account for time, volatility, and interest rates.
7.1 Key Pricing Models
Black-Scholes Model (1973)
A groundbreaking formula for pricing European options using variables like volatility, strike price, time to maturity, and risk-free rate.
Binomial and Trinomial Models
Discrete-time frameworks that model possible price movements and associated probabilities.
Monte Carlo Simulation
Used for complex derivatives where analytical solutions are infeasible, especially in exotic options or structured products.
Interest Rate Models (e.g., Hull-White, Vasicek)
Applied to value interest rate derivatives and fixed-income instruments.
Accurate pricing is essential for managing risk exposure and ensuring market stability.
8. Derivatives and Emerging Markets
Emerging economies like India, Brazil, and China have witnessed rapid development of derivative markets, often starting with currency and interest rate products before expanding to equity and commodity derivatives.
8.1 The Indian Derivatives Market
India’s derivatives segment, led by the National Stock Exchange (NSE) and Multi Commodity Exchange (MCX), has grown dramatically since the early 2000s. Key features include:
Equity index futures and options (NIFTY, Bank NIFTY)
Currency futures and options (USD/INR, EUR/INR)
Commodity derivatives (gold, crude oil, agricultural products)
Interest rate futures
These instruments support corporate hedging, institutional trading, and retail participation, contributing to capital market depth and liquidity.
8.2 Challenges in Emerging Markets
Limited financial literacy and risk awareness
Low liquidity in certain derivative segments
Regulatory and infrastructural constraints
Higher volatility and exchange rate instability
Despite these hurdles, derivatives are becoming vital for managing economic and financial risks in developing economies.
9. The Role of Technology and Innovation
Digital transformation has revolutionized derivative trading and risk management. Algorithmic trading, artificial intelligence (AI), and blockchain are reshaping how derivatives are priced, executed, and settled.
9.1 Algorithmic and High-Frequency Trading (HFT)
Algorithms execute complex trading strategies in milliseconds, enhancing market liquidity but sometimes increasing volatility.
9.2 Artificial Intelligence and Risk Analytics
AI-driven models improve credit risk assessment, volatility forecasting, and derivative portfolio optimization.
9.3 Blockchain and Smart Contracts
Decentralized platforms promise transparent, tamper-proof recording of derivative contracts, reducing counterparty risk and settlement delays.
10. Derivatives and Global Risk Interconnection
Globalization has linked derivative markets across geographies. A disruption in one region can transmit shocks globally through interconnected positions, as seen in:
The Asian financial crisis (1997)
The global financial crisis (2008)
COVID-19 market volatility (2020)
Risk management now requires systemic thinking—understanding interdependencies among markets, institutions, and instruments. International coordination among regulators and central banks (through the Financial Stability Board and BIS) is essential to monitor global derivative exposures and systemic vulnerabilities.
11. Ethical and Strategic Considerations
While derivatives enhance efficiency, ethical concerns arise when used for manipulation or excessive speculation. The Barings Bank collapse (1995) and Société Générale’s trading scandal (2008) highlighted the dangers of poor internal controls and unmonitored derivative trading.
Corporations and institutions must balance profit motives with prudent risk governance. Derivative policies should align with the firm’s risk appetite, compliance standards, and shareholder value objectives.
12. The Future of Derivatives and Risk Management
Looking forward, derivative markets will continue evolving amid changing macroeconomic, technological, and regulatory landscapes.
Key Trends:
Green and ESG-linked Derivatives
Instruments tied to carbon credits, renewable energy, and sustainability metrics are gaining traction.
Digital Asset Derivatives
Futures and options on cryptocurrencies and tokenized assets are creating new risk paradigms.
Cross-border Regulatory Harmonization
Standardization across jurisdictions will enhance transparency and reduce arbitrage gaps.
AI-powered Risk Management Systems
Predictive analytics and machine learning will redefine how firms identify and manage exposure.
The emphasis will shift toward resilience—ensuring derivative use supports sustainable growth without amplifying systemic fragility.
13. Conclusion
Derivatives are the backbone of modern financial architecture. They enable efficient risk transfer, price discovery, and market integration across borders. Used wisely, derivatives enhance stability and facilitate economic growth by allowing firms and investors to manage uncertainty. Yet, when misused, they can magnify systemic risks and destabilize economies.
Risk management, therefore, is not just about employing derivatives—it’s about understanding their power, purpose, and peril. The challenge for global markets lies in maintaining a delicate balance: leveraging derivatives for innovation and stability while safeguarding against excesses that could endanger financial integrity.
In essence, derivatives are neither inherently good nor bad—they are reflections of how humans manage risk in pursuit of progress. As financial systems evolve, the sophistication of derivatives must be matched by an equal measure of prudence, transparency, and ethical governance.
Commodity Supercycles and Resource ScarcityIntroduction
Commodities—ranging from energy and metals to agricultural products—are the essential building blocks of the global economy. Their prices fluctuate based on demand and supply dynamics, technological progress, and macroeconomic cycles. However, history reveals that commodity markets often experience prolonged periods of rising and falling prices known as “commodity supercycles.” These cycles, typically lasting decades, reflect fundamental transformations in the world economy—industrial revolutions, rapid urbanization, or structural shifts in demand.
In recent decades, economists and investors have increasingly linked commodity supercycles to resource scarcity, the growing challenge of balancing finite natural resources with the expanding needs of humanity. As population growth, industrialization, and the transition to green technologies intensify, questions about the sustainability of resource use have become central to global economic planning.
This essay explores the concept of commodity supercycles, their historical patterns, causes, and implications, as well as the relationship between these cycles and resource scarcity. It also examines how emerging trends such as renewable energy, recycling technologies, and geopolitical tensions are shaping the next possible supercycle.
Understanding Commodity Supercycles
A commodity supercycle refers to a long-term, broad-based price boom across multiple commodities, driven by structural shifts in global demand. Unlike short-term price fluctuations due to seasonal or cyclical economic activity, supercycles typically last 20 to 40 years. They are usually tied to periods of rapid industrialization or technological transformation that cause sustained increases in commodity consumption.
For example, the post-World War II reconstruction era, the 1970s oil shocks, and the China-led industrialization of the 2000s each corresponded with major supercycles. These booms were followed by extended downturns as supply caught up with demand or economic growth slowed.
Economists identify three key phases of a commodity supercycle:
Expansion Phase – Rising demand, limited supply, and increasing investment in resource extraction.
Peak and Plateau Phase – Supply gradually expands, demand growth stabilizes, and prices reach their highest levels.
Contraction Phase – Oversupply, slowing demand, and technological changes drive prices down over a long period.
Each phase reflects deep economic transformations that go beyond traditional business cycles, often linked to the rise and fall of global powers, demographic shifts, and major infrastructure booms.
Historical Overview of Commodity Supercycles
1. The 19th Century Industrial Revolution Cycle (1850–1914)
The first recognized supercycle was driven by the Industrial Revolution in Europe and North America. Rapid urbanization, rail expansion, and mechanized manufacturing led to soaring demand for coal, iron, steel, and agricultural commodities.
Technological innovation in steam engines, metallurgy, and transportation created a massive pull on global resources. Colonization expanded access to raw materials, but prices still rose sharply due to unprecedented demand. This cycle ended with the onset of World War I and the Great Depression, which collapsed trade and industrial output.
2. The Post-World War II Boom (1945–1973)
The second major supercycle followed World War II, driven by reconstruction in Europe and Japan, the rise of suburbanization, and the U.S. economic boom. Infrastructure projects, automobiles, and consumer goods required steel, copper, oil, and agricultural commodities. The Bretton Woods system, which stabilized exchange rates, and the establishment of multilateral trade institutions like the IMF and World Bank, supported global growth.
The cycle peaked with the 1973 oil crisis, when OPEC’s embargo sent oil prices skyrocketing, causing inflationary pressures and economic slowdown.
3. The China-Driven Supercycle (2000–2014)
The most recent supercycle was fueled by China’s industrialization and urbanization after joining the World Trade Organization (WTO) in 2001. Massive infrastructure spending, steel production, and construction caused an extraordinary demand surge for iron ore, copper, aluminum, coal, and oil.
Prices of most commodities reached historic highs between 2008 and 2011. However, by 2014, a slowdown in China’s growth and global oversupply brought the cycle to an end. The collapse in oil and metal prices marked the beginning of a prolonged downturn.
Causes of Commodity Supercycles
Several structural forces interact to create supercycles. The most significant include:
1. Industrialization and Urbanization
Periods of intense industrial expansion, such as in 19th-century Britain or 21st-century China, lead to sharp increases in commodity demand. Infrastructure development, housing, and manufacturing all require raw materials, creating upward pressure on prices.
2. Demographic Growth
Population booms in emerging economies increase demand for food, energy, and housing. For example, post-war baby booms and the rise of the global middle class have repeatedly expanded resource consumption.
3. Technological Innovation
Technological revolutions both create and destroy demand for commodities. The internal combustion engine increased oil demand; renewable technologies now increase demand for lithium, nickel, and copper. These transitions often reconfigure global trade flows.
4. Supply Constraints
Commodity supply is slow to adjust due to long investment cycles, geological limitations, and political instability. For instance, developing a new copper mine can take over a decade. Limited supply elasticity amplifies the impact of demand shocks.
5. Geopolitical and Policy Factors
Wars, trade restrictions, or resource nationalism can tighten supply and intensify price cycles. The 1970s oil crisis and recent Russia-Ukraine conflict illustrate how geopolitics can trigger commodity surges.
Resource Scarcity: A Growing Challenge
Resource scarcity refers to the limited availability of natural resources relative to human demand. This scarcity is not only physical but also economic—driven by rising extraction costs, environmental degradation, and geopolitical constraints.
1. Physical and Geological Limits
Many commodities, especially fossil fuels and certain metals, exist in finite quantities. As high-quality reserves are depleted, extraction becomes more expensive and energy-intensive. For example, new oil discoveries have declined steadily since the 1980s, raising concerns about “peak oil.”
2. Environmental Constraints
Mining, deforestation, and fossil fuel extraction cause environmental damage and carbon emissions. Climate change policies now restrict resource exploitation, creating a trade-off between economic growth and sustainability.
3. Economic and Political Constraints
Resource access is often limited by political instability, nationalization of assets, and export controls. Countries with critical resources may use them for strategic leverage, increasing global scarcity risk.
4. Water and Food Scarcity
Beyond metals and energy, water and arable land are becoming increasingly scarce. Global warming, desertification, and pollution threaten agricultural productivity, leading to food security challenges and potential social unrest.
The Link Between Supercycles and Resource Scarcity
Supercycles often exacerbate resource scarcity. During expansion phases, intense demand leads to rapid depletion of reserves, environmental damage, and overexploitation. As production costs rise, prices increase, creating feedback loops that sustain the cycle.
Conversely, resource scarcity can trigger new supercycles by increasing extraction costs and limiting supply. For example, the transition to renewable energy requires massive amounts of critical minerals like lithium, cobalt, and rare earth elements—resources that are themselves scarce and geographically concentrated.
This dynamic interplay means that resource scarcity is both a driver and a consequence of commodity supercycles. As one resource becomes scarce, economies adapt by shifting demand to substitutes—sometimes triggering new cycles in different commodities.
Case Studies: Resource Scarcity in Action
1. Oil and Energy Scarcity
Oil remains the world’s most important commodity. Periods of high prices, such as during the 1970s and 2000s, reflected both demand surges and fears of resource exhaustion. While technological innovations like fracking temporarily alleviated scarcity, geopolitical risks and environmental constraints continue to threaten long-term supply stability.
2. The Green Energy Transition and Critical Minerals
The global push toward decarbonization has created massive demand for metals such as lithium, nickel, cobalt, and copper. Electric vehicles (EVs), solar panels, and batteries rely on these inputs. However, these minerals are heavily concentrated in a few countries—such as the Democratic Republic of Congo (cobalt) and Chile (lithium)—raising concerns over future bottlenecks and new forms of resource dependency.
3. Water Scarcity and Agricultural Commodities
Climate change-induced droughts are reducing freshwater availability for irrigation. In regions like South Asia and Africa, this threatens food production and could trigger volatility in agricultural commodity markets such as wheat, rice, and soybeans. As populations grow, the risk of food inflation and social instability rises.
The Emerging 21st-Century Supercycle
Many analysts believe the world may be entering a new commodity supercycle, driven by structural transformations such as green industrialization, digital infrastructure, and geopolitical realignments.
Key Drivers:
Energy Transition – The shift from fossil fuels to renewables increases demand for transition metals and critical minerals.
Geopolitical Fragmentation – Resource nationalism, trade wars, and sanctions are disrupting supply chains, raising production costs.
Reindustrialization in the West – Efforts to “reshore” supply chains and reduce dependency on China are spurring domestic infrastructure investment.
Global Population and Urban Growth – With the world population surpassing 8 billion, resource demand for housing, energy, and food remains robust.
However, this new supercycle differs from past ones—it is shaped by sustainability imperatives, technological advances, and decarbonization policies. While demand for green metals is booming, fossil fuel demand may plateau or decline, making this supercycle more selective and diversified.
Economic and Market Implications
1. Inflationary Pressures
Sustained commodity price increases can fuel inflation, especially in emerging economies reliant on imports. The 2021–2023 period illustrated how energy and food shortages contributed to global inflation spikes.
2. Investment Opportunities
Supercycles create profitable opportunities in mining, energy, and infrastructure sectors. Investors anticipate long-term demand by financing exploration and extraction. However, volatility remains high, requiring risk management strategies.
3. Shifts in Global Power
Resource-rich nations—such as Australia, Chile, and Saudi Arabia—gain geopolitical leverage during supercycles. Conversely, resource-dependent importers face economic vulnerability and trade deficits.
4. Technological Innovation
Scarcity stimulates innovation. Rising commodity prices encourage investment in recycling, substitution, and efficiency technologies. For example, advances in battery chemistry aim to reduce reliance on cobalt.
Managing Resource Scarcity: Sustainable Pathways
To mitigate the risks of resource scarcity and stabilize future supercycles, policymakers and industries must pursue sustainable resource management strategies.
1. Circular Economy
Recycling and reusing materials can reduce pressure on primary extraction. The shift toward a circular economy—where waste becomes input—offers a long-term solution to resource depletion.
2. Technological Substitution
Innovation can replace scarce materials with more abundant ones. For instance, sodium-based batteries may reduce dependence on lithium, and carbon composites may replace steel in some applications.
3. Diversification of Supply
Developing multiple sources for critical materials reduces geopolitical dependency. Collaborative international frameworks can ensure more equitable resource distribution.
4. Resource Efficiency
Improving energy and material efficiency across industries can lower demand growth. Smart grids, energy-efficient buildings, and sustainable farming techniques play key roles.
5. Global Governance and Cooperation
International institutions must coordinate policies for resource management, ensuring fair trade, transparent supply chains, and environmental protection. Initiatives like the Extractive Industries Transparency Initiative (EITI) promote responsible mining and investment.
Conclusion
Commodity supercycles are more than economic phenomena—they are reflections of humanity’s evolving relationship with the planet’s resources. Each cycle marks a phase of industrial transformation, technological progress, and social change. Yet, they also expose the vulnerabilities of a world dependent on finite natural assets.
As we enter a new era defined by climate imperatives, energy transitions, and population growth, resource scarcity is likely to be the defining economic and political challenge of the 21st century. Whether this results in instability or innovation depends on how effectively societies manage the delicate balance between consumption and conservation.
Future supercycles may not be characterized by endless extraction, but by smart utilization, circular economies, and technological breakthroughs. In this sense, the path ahead requires not only economic foresight but also environmental responsibility—because managing resource scarcity wisely will determine the sustainability of global growth itself.
International Trade Policies and Market Reactions1. Evolution of International Trade Policies
1.1 Early Mercantilism to Free Trade
From the 16th to 18th centuries, trade was dominated by mercantilist policies — where nations sought to maximize exports and minimize imports to accumulate gold and silver. Colonial powers like Britain, France, and Spain established monopolistic trade routes to extract wealth from colonies.
The late 18th and 19th centuries saw the emergence of free trade ideology, led by economists like Adam Smith and David Ricardo. Smith’s The Wealth of Nations (1776) argued that nations should specialize in producing goods where they hold an absolute advantage, while Ricardo’s theory of comparative advantage demonstrated that even less efficient countries benefit from trade if they specialize relatively.
The 19th century ushered in a wave of trade liberalization, with the British Corn Laws repeal (1846) marking a major shift toward open markets.
1.2 The Rise and Fall of Protectionism
The Great Depression (1929–1939) marked a turning point. Countries imposed tariffs and quotas to protect domestic industries, triggering a global collapse in trade. The infamous U.S. Smoot-Hawley Tariff Act (1930) raised tariffs on over 20,000 imports, leading to retaliations and worsening economic conditions.
After World War II, nations recognized the need for cooperative trade frameworks to prevent such economic nationalism. This led to the establishment of the General Agreement on Tariffs and Trade (GATT) in 1947, promoting tariff reduction and trade liberalization.
1.3 The WTO Era and Beyond
In 1995, GATT evolved into the World Trade Organization (WTO) — a comprehensive body overseeing global trade rules, dispute resolution, and policy negotiations. WTO membership grew to 160+ nations, significantly integrating developing economies into the global system.
However, by the 2010s, trade liberalization faced resistance. The rise of China, global financial crises, nationalism, and technological disruptions renewed debates on whether free trade truly benefits all. Trade wars — especially between the U.S. and China — revealed the fragility of the open trading system.
2. Key Instruments of International Trade Policy
2.1 Tariffs
A tariff is a tax imposed on imported goods. It serves both as a revenue source and a protectionist tool. For instance, higher tariffs on steel imports make domestic steel more competitive. However, they often lead to retaliatory tariffs, inflationary pressure, and inefficiencies in global supply chains.
2.2 Quotas and Import Restrictions
Quotas limit the volume of imports of specific goods. Unlike tariffs, which adjust prices, quotas directly restrict quantities. Quotas are often used in sensitive industries such as agriculture, textiles, and automobiles to protect domestic producers.
2.3 Subsidies and Export Incentives
Governments often provide subsidies to domestic industries to boost exports. For example, agricultural subsidies in the U.S. and EU have long been criticized for distorting international competition. Export incentives, such as tax breaks, help national firms expand globally.
2.4 Trade Agreements
Trade agreements are either bilateral, regional, or multilateral. They define trade rules, tariffs, and dispute resolution frameworks. Examples include:
NAFTA/USMCA (North America)
European Union (EU) Single Market
ASEAN Free Trade Area (AFTA)
Comprehensive and Progressive Agreement for Trans-Pacific Partnership (CPTPP)
Such agreements often lead to increased cross-border investments and market integration.
2.5 Non-Tariff Barriers (NTBs)
NTBs include standards, licensing requirements, and regulations that indirectly restrict trade. For instance, safety standards on food imports or environmental norms on manufacturing can act as barriers, especially for developing nations.
3. Role of International Organizations
3.1 The World Trade Organization (WTO)
The WTO is the primary body overseeing trade liberalization and dispute settlement. It ensures that trade policies are predictable, transparent, and non-discriminatory. However, the WTO has struggled to address digital trade, state subsidies, and China’s economic model, leading to calls for reform.
3.2 International Monetary Fund (IMF)
While not a trade body, the IMF stabilizes global financial systems by providing liquidity to countries with trade imbalances. Its policies often influence trade indirectly through exchange rate stabilization and macroeconomic adjustments.
3.3 World Bank and Regional Development Banks
The World Bank, Asian Development Bank (ADB), and African Development Bank (AfDB) finance infrastructure that supports trade — ports, logistics, and transport networks. These institutions promote trade integration for developing economies.
3.4 Regional Trade Blocs
Organizations like the European Union (EU) and African Continental Free Trade Area (AfCFTA) represent regional approaches to trade governance, focusing on internal liberalization while negotiating collectively with external partners.
4. Case Studies: Trade Policy and Market Reactions
4.1 U.S.-China Trade War (2018–2020)
The U.S.-China trade conflict began when the United States imposed tariffs on Chinese goods worth over $360 billion, accusing China of intellectual property theft and unfair subsidies. China retaliated with tariffs on U.S. exports.
Market Reactions:
Equity markets fell sharply during tariff announcements, with major indices like the S&P 500 and Shanghai Composite showing volatility.
Commodity prices, especially soybeans and rare earth metals, were disrupted due to changing trade routes.
The U.S. dollar strengthened as investors sought safety, while emerging market currencies depreciated.
Multinational corporations diversified production out of China, shifting supply chains to Vietnam, India, and Mexico.
4.2 Brexit and European Trade Dynamics
The United Kingdom’s exit from the European Union (Brexit) in 2020 marked a historic shift in trade policy. It introduced customs checks and regulatory divergence.
Market Reactions:
The British pound (GBP) experienced extreme volatility, depreciating nearly 15% after the 2016 referendum.
UK equity markets underperformed, while European indices also saw uncertainty.
Long-term bond yields dropped due to investor flight to safety.
Trade volumes between the UK and EU initially fell but later stabilized as new trade deals were negotiated.
4.3 NAFTA to USMCA Transition
The United States-Mexico-Canada Agreement (USMCA) replaced NAFTA in 2020, modernizing rules on digital trade, labor, and environmental standards.
Market Reactions:
North American equity markets reacted positively due to reduced uncertainty.
The Canadian dollar and Mexican peso gained strength after the deal’s ratification.
Automobile industry supply chains adapted to new “rules of origin,” affecting production strategies.
4.4 COVID-19 Pandemic and Trade Restrictions
During the COVID-19 crisis, nations imposed export bans on medical equipment, vaccines, and food products, disrupting supply chains globally.
Market Reactions:
Commodity and logistics markets experienced historic price spikes.
Shipping costs (Baltic Dry Index) soared, reflecting port closures and demand surges.
Equities in logistics and technology sectors gained, while tourism and manufacturing sectors declined sharply.
5. Mechanisms of Market Reactions to Trade Policies
5.1 Currency Markets
Currency values are among the most sensitive indicators of trade policy changes. A nation imposing tariffs on imports can experience currency appreciation if it reduces import demand. Conversely, trade tensions often weaken emerging market currencies due to capital outflows.
Example: During the 2018 trade war, the Chinese Yuan (CNY) depreciated over 10% against the U.S. Dollar (USD), reflecting reduced export expectations.
5.2 Stock Markets
Trade policies directly affect corporate profits and investor sentiment:
Export-heavy industries (e.g., technology, manufacturing) are vulnerable to tariffs.
Domestic-oriented sectors (e.g., utilities, healthcare) may benefit from protectionist measures.
Stock markets often respond immediately to policy news. For instance, when trade agreements are signed, equity indices surge due to improved confidence.
5.3 Commodity Markets
Trade policies influence the demand and supply dynamics of commodities:
Oil and metals prices react to industrial production expectations.
Agricultural commodities are highly sensitive to tariffs and quotas.
Example: During the U.S.-China trade conflict, China shifted soybean imports from the U.S. to Brazil, boosting Brazilian exports and altering global price structures.
5.4 Bond Markets
Government bond yields reflect investor risk perceptions. During trade disputes, investors seek safe-haven assets like U.S. Treasuries or German Bunds, pushing yields down. Conversely, successful trade agreements often lead to yield increases as growth expectations rise.
5.5 Investor Sentiment and Volatility
Trade uncertainty amplifies market volatility. The VIX Index, a measure of market fear, often spikes during trade negotiations or tariff announcements. High volatility can deter investment, increase hedging costs, and reduce liquidity.
6. The Political Economy of Trade
Trade policy decisions are influenced not only by economics but also by domestic politics and geopolitical strategy. Policymakers balance between protecting local industries and maintaining international competitiveness.
Protectionism appeals to domestic voters during unemployment or deindustrialization phases.
Free trade is supported by multinational corporations and export-oriented economies.
Geopolitical trade tools, such as sanctions or technology restrictions, are increasingly used to assert national power — seen in U.S. restrictions on Chinese semiconductor access.
Thus, trade policy often reflects both economic rationale and strategic interests, leading to complex market outcomes.
7. The Future of Global Trade Policy
7.1 Digital Trade and E-Commerce
The rise of digital trade — cross-border e-commerce, data flows, and cloud services — is reshaping trade frameworks. The WTO and regional agreements now include digital trade chapters, ensuring free data flow while protecting privacy.
7.2 Green Trade Policies
Climate change has introduced carbon border adjustment mechanisms (CBAM) and ESG-linked trade standards. For example, the EU’s CBAM imposes tariffs on imports with high carbon footprints, influencing global supply chains toward sustainability.
7.3 Regionalization and Supply Chain Realignment
The post-pandemic world is witnessing “friend-shoring” and regionalization — where trade partners are chosen based on political alignment rather than cost efficiency. This trend reshapes trade flows, especially in semiconductors, rare earths, and energy.
7.4 Reforming the WTO
To remain relevant, the WTO must adapt to the digital economy, industrial subsidies, and state capitalism. Its dispute settlement system, currently weakened, needs restoration for fair enforcement of rules.
7.5 Artificial Intelligence and Automation
AI and robotics are transforming production and trade competitiveness. Nations that leverage technology to increase productivity will gain comparative advantages, altering traditional labor-cost-based trade models.
Conclusion
International trade policies form the framework through which global commerce operates, shaping patterns of production, consumption, and investment. Over time, the pendulum has swung between free trade and protectionism, reflecting shifting political priorities and economic realities.
Market reactions to trade policy changes are immediate and far-reaching, influencing currencies, equities, bonds, and commodities. Investors interpret these signals to assess risks and opportunities across global markets.
As the world faces geopolitical fragmentation, technological transformation, and environmental imperatives, the future of trade policy will depend on adaptability and cooperation. A balance between national interests and global integration will be key to ensuring sustainable economic growth and market stability.

Global Bond and Fixed Income Markets1. Introduction
The global bond and fixed income markets form the backbone of the world’s financial system. These markets are where governments, corporations, and institutions raise capital by issuing debt instruments—promises to repay borrowed funds with interest. Bonds, treasury bills, notes, and other fixed-income securities collectively represent trillions of dollars in outstanding obligations, making this one of the largest and most liquid asset classes globally.
Unlike equity markets, where investors purchase ownership stakes in companies, the fixed income market revolves around lending. Investors essentially become creditors, earning predictable income through periodic coupon payments and principal repayment upon maturity. The stability and reliability of these returns make bonds a cornerstone for institutional investors, central banks, and individuals seeking steady income or capital preservation.
In 2025, the total global bond market exceeds $140 trillion, spanning government debt, corporate bonds, municipal debt, supranational issuances, and structured credit instruments. The market’s depth, liquidity, and risk-return spectrum make it indispensable to modern finance, influencing monetary policy, interest rates, and economic growth worldwide.
2. The Role and Importance of Fixed Income Markets
The global fixed income market serves several critical economic functions:
Capital Formation:
Governments and corporations issue bonds to fund infrastructure projects, corporate expansion, research, and public programs. Without bond markets, large-scale financing would rely solely on bank loans, limiting growth.
Monetary Policy Implementation:
Central banks conduct open market operations primarily using government securities. By buying or selling these securities, they manage liquidity, control interest rates, and influence inflation.
Benchmark for Other Assets:
Government bond yields act as a benchmark for pricing corporate bonds, equities, and even mortgages. The risk-free rate, derived from sovereign bonds, forms the foundation for asset valuation models globally.
Portfolio Diversification and Risk Management:
Bonds often move inversely to equities during downturns, providing diversification benefits. Institutional investors use them to balance portfolio risk and stabilize returns.
Safe-Haven Investment:
During financial uncertainty or geopolitical instability, investors flock to high-quality government bonds (such as U.S. Treasuries or German Bunds), seeking safety and liquidity.
3. Major Segments of the Global Bond Market
The fixed income universe comprises several segments, each catering to different issuers, investors, and risk profiles.
3.1. Government Bonds
Issued by national governments, these are considered the safest investments in the market.
Sovereign Bonds: Examples include U.S. Treasuries, U.K. Gilts, Japanese Government Bonds (JGBs), and Indian Government Securities (G-Secs).
Emerging Market Debt: Countries like Brazil, Mexico, or South Africa issue bonds denominated in local or foreign currency. These carry higher yields due to higher default risk.
Government bonds are critical for monetary policy, as their yields reflect market expectations of inflation and interest rates.
3.2. Corporate Bonds
Corporations issue bonds to raise capital for operations, expansion, or refinancing existing debt.
Investment-Grade Bonds: Issued by financially strong corporations (rated BBB- or higher).
High-Yield (Junk) Bonds: Issued by riskier companies offering higher yields to compensate for credit risk.
Corporate bonds are vital for economic expansion, providing businesses with an alternative to equity financing.
3.3. Municipal Bonds
Issued by states, cities, or local authorities to finance public projects like roads, hospitals, and schools. In countries like the U.S., municipal bonds offer tax-exempt interest income, making them attractive to individual investors.
3.4. Supranational and Sovereign Agency Bonds
Organizations such as the World Bank, European Investment Bank (EIB), or Asian Development Bank (ADB) issue bonds to fund development projects. These securities often enjoy high credit ratings and are used to promote sustainable financing globally.
3.5. Structured and Securitized Products
These include Mortgage-Backed Securities (MBS), Asset-Backed Securities (ABS), and Collateralized Debt Obligations (CDOs). They pool loans or receivables and repackage them into tradable securities. Structured finance became notorious after the 2008 financial crisis but remains a vital part of credit markets.
4. Key Participants in the Global Bond Market
Issuers:
Governments, municipalities, corporations, and supranational agencies.
Their objective is to raise funds at the lowest possible cost.
Investors:
Institutional Investors: Pension funds, insurance companies, mutual funds, and sovereign wealth funds dominate demand due to their large asset bases and need for steady returns.
Retail Investors: Participate through direct purchases or mutual funds.
Foreign Investors: Often buy sovereign and corporate bonds for yield diversification and currency exposure.
Intermediaries:
Investment banks underwrite and distribute bond issues.
Dealers, brokers, and electronic trading platforms facilitate secondary market trading.
Regulators and Rating Agencies:
Agencies like Moody’s, S&P Global, and Fitch Ratings assess issuer creditworthiness.
Regulators (like the SEC, ESMA, or SEBI) oversee transparency, disclosure, and market integrity.
5. Bond Valuation and Pricing Mechanisms
The value of a bond depends primarily on three factors — coupon rate, maturity, and prevailing market interest rates.
5.1. Present Value of Cash Flows
A bond’s price equals the present value of its future cash flows (coupons and principal). When market interest rates rise, bond prices fall, and vice versa. This inverse relationship between yields and prices defines fixed income market dynamics.
5.2. Yield Measures
Current Yield: Annual coupon divided by current price.
Yield to Maturity (YTM): The internal rate of return if held to maturity.
Yield Spread: The difference between yields of different securities, indicating relative risk.
5.3. Credit and Duration Risk
Credit Risk: Possibility of default by the issuer.
Duration: Measures bond price sensitivity to interest rate changes. Longer-duration bonds are more sensitive to rate movements.
6. Global Market Size and Regional Overview
6.1. United States
The U.S. has the world’s largest bond market, valued over $50 trillion. U.S. Treasuries are considered the global benchmark for risk-free assets. The Federal Reserve’s actions in buying or selling Treasuries directly impact global liquidity.
6.2. Europe
The Eurozone bond market includes German Bunds (considered ultra-safe) and peripheral debt from countries like Italy, Spain, and Greece. The European Central Bank (ECB) manages yields via quantitative easing and bond-buying programs.
6.3. Asia-Pacific
Japan’s bond market, dominated by JGBs, is the largest in Asia, though yields remain extremely low. China’s bond market has grown rapidly, becoming a key avenue for global investors seeking exposure to yuan-denominated assets. India’s G-Sec market is expanding, supported by reforms that enhance foreign participation.
6.4. Emerging Markets
Countries in Latin America, Africa, and Eastern Europe issue both local and dollar-denominated bonds. These offer higher returns but carry risks such as currency depreciation and political instability.
7. Fixed Income Derivatives and Innovations
Derivatives based on bonds—such as futures, options, swaps, and credit default swaps (CDS)—allow investors to hedge or speculate on interest rate and credit movements.
Interest Rate Swaps: Exchange fixed and floating rate payments to manage rate exposure.
Credit Default Swaps: Provide insurance against bond default.
Bond Futures: Allow hedging of portfolio value against rate changes.
The rise of Exchange-Traded Funds (ETFs) and green bonds has further diversified access and objectives within fixed income investing.
8. Influence of Macroeconomic Factors
Bond markets are deeply intertwined with macroeconomic conditions.
Interest Rates:
Central banks’ rate decisions directly affect bond yields. A rate hike lowers bond prices, while cuts drive them higher.
Inflation:
Rising inflation erodes the real return of fixed-income securities, leading investors to demand higher yields.
Fiscal Policy:
Government deficits increase bond supply, potentially pushing yields upward.
Currency Movements:
Exchange rate fluctuations impact returns on foreign-denominated bonds.
Global Risk Sentiment:
During crises, investors move funds from risky assets to safe-haven bonds, causing yield compression in developed markets.
9. Technological Evolution and Market Infrastructure
Modern bond markets are increasingly electronic, transparent, and efficient.
Electronic Trading Platforms: Platforms like Tradeweb and MarketAxess have revolutionized secondary bond trading.
Blockchain and Tokenization: Tokenized bonds and blockchain-based settlements are improving speed, transparency, and cost efficiency.
AI and Big Data Analytics: Used for credit analysis, risk modeling, and market forecasting.
These innovations are making fixed income markets more accessible and integrated across borders.
10. ESG and Green Bond Revolution
Environmental, Social, and Governance (ESG) investing has reshaped the bond landscape. Green bonds finance environmentally sustainable projects such as renewable energy and clean transportation.
The global green bond market surpassed $2 trillion in cumulative issuance by 2025.
Sustainability-linked bonds tie coupon payments to ESG performance metrics, promoting responsible corporate behavior.
Governments, development banks, and corporations alike are leveraging ESG bonds to align with global climate goals and attract sustainability-focused investors.
Conclusion
The global bond and fixed income markets are the quiet yet powerful engines of global finance. They enable governments to fund development, corporations to grow, and investors to achieve stability and income.
In an era marked by technological transformation, sustainability goals, and shifting monetary landscapes, fixed income markets are evolving rapidly. The interplay of interest rates, inflation, and global capital flows continues to shape their dynamics.
As the world transitions into a more interconnected, digital, and climate-conscious financial system, the bond market remains indispensable—not just as a financing mechanism but as the foundation upon which the modern economy rests.
The ability of fixed income markets to adapt—through innovation, transparency, and sustainability—will determine their continued strength and relevance in the decades ahead.

ES (SPX, SPY) Analyses, Key Levels, Setups for Tue (Oc 14)News & Event Map (ET)
• 06:00 NFIB Small-Business Optimism (Sept).
• 08:45 Fed Gov. Michelle Bowman remarks.
• 12:20 Fed Chair Powell keynote.
• Mid-day U.S. T-bill auctions (6-wk, 13-/26-wk close mid-day).
• Backdrop: Fresh U.S.–China port fee headlines add a macro risk-off/risk-on toggle.
• Earnings: Early-season, light but picking up (e.g., Bank OZK, ESLT, NEWT).
Read: plan London 02:00–05:00, NY AM 09:30–11:00, PM 13:30–16:00. Avoid initiating during Powell’s window unless already risk-reduced.
For overnight London session:
1) A Bounce (Tier-3) — Long from 6,661–6,672 (only on exhaustion + reclaim)
• Trigger: Flush into the band → 1m reclaim → 5m up-close.
• Invalidation/SL: Below 6,653.
• TP1: 6,689–6,692 (take 70%, runner BE).
• TP2: 6,706–6,710.
• Note: If the stop required to the 15m wick makes TP1 < 2R, skip.
2) Reclaim-Fail Short (Tier-1 quality) — Short on 6,689–6,692 retest-fail
• Trigger: Pop back into 6,689–6,692, 15m can’t hold above, 5m rolls over; 1m LH entry.
• SL: Above 6,696–6,698.
• TP1: 6,672 → 6,666.
• TP2: 6,661.
• Stretch: 6,640–6,650 if momentum persists.
3) Breakdown Continuation (Tier-1) — Short on 15m acceptance below 6,661
• Trigger: 15m full-body close < 6,661, then 5m retest holds below.
• SL: Back above 6,666–6,668.
• TP1: 6,640–6,650.
• TP2: Trail for a bleed toward mid-650s if tape stays heavy.
For NY session:
Tier-1 A++ (Major) — Short at 6,718–6,725
• Trigger (Rejection-Fade): 15m close back below 6,718 after a wick through; 5m re-close lower with LH; 1m first pullback entry.
• SL: Above 6,730 (±0.25–0.50).
• TP1: 6,689–6,692 (close 70% → runner BE).
• TP2: 6,661–6,672.
• TP3: 6,645–6,650.
• Invalidation: 15m full-body acceptance ≥6,725 (don’t fade; flip to the long continuation play).
Tier-1 A++ (Major) — Long continuation on 6,725+ acceptance
• Trigger (Acceptance-Go): 15m full-body close ≥6,725 → 5m pullback holds 6,718–6,721 and re-closes up → 1m HL entry.
• SL: Below 6,712 (±0.25–0.50).
• TP1: 6,735–6,745.
• TP2: 6,760 area.
• TP3: 6,780 stretch.
• Invalidation: 15m close back inside 6,718 after entry.
Tier-2 A+ Bounce — Quick-reclaim long at 6,689–6,692
• Trigger: Sweep/flush into the band, instant reclaim on 1m → 5m up-close.
• SL: Below 6,682.
• TP1: 6,707–6,710.
• TP2: 6,718–6,725.
• TP3: 6,735.
• Size: ¾ standard.
Tier-3 A Bounce — Exhaustion flush long at 6,661–6,672
• Trigger: Capitulation wick + 5m bullish re-close from the band.
• SL: 6,653.
• TP1: 6,689–6,692.
• TP2: 6,706–6,710.
• TP3: 6,718.
• Size: ½ standard.
PA projections:
Market Analysis: London to New York Trading Session
London Session (02:00–05:00)
In the early hours, the base case scenario for the market suggests a modest advance to the 6,661–6,672 range, followed by a brief spike to 6,689–6,692. However, resistance is expected to kick in at this level, potentially leading to a reversal back to 6,672 and down to 6,661. In a bearish scenario, if there is a 15-minute acceptance below 6,661, we may target 6,640–6,650 as potential support levels.
Pre-New York Session (08:00–09:30)
As long as prices remain below 6,689, we anticipate the formation of a lower high beneath 6,700, exerting downward pressure towards 6,661. There is a heightened risk of a flush toward 6,645–6,650 during this period.
New York Morning Session (09:30–11:00)
The bearish sentiment is likely to persist if prices remain under 6,689, with selling opportunities expected towards 6,661 and the 6,645–6,650 range. The momentum in this phase will determine whether we establish a base or continue to decline. Conversely, a bullish alternative may emerge if there is a sustained 15-minute close above 6,689 for 30 to 60 minutes, which could pivot the market towards a buying strategy, targeting 6,706–6,710 and possibly testing 6,718–6,725. A decisive move above 6,725 would shift the focus to 6,735–6,745.
Key Levels to Watch
Bullish Scenario: A successful flip to bullish sentiment would require two consecutive 15-minute closes above 6,689, with pullbacks holding at this level.
Bearish Confirmation: A bearish confirmation would manifest through a 15-minute full-body close below 6,661, followed by a failed retest from below.
Conclusion: The outlook remains inherently biased towards a sell-rallies strategy throughout the trading day from London into New York, as long as prices stay below 6,689. A recovery and sustained hold above this threshold would redirect attention to tests of 6,706 and 6,718.
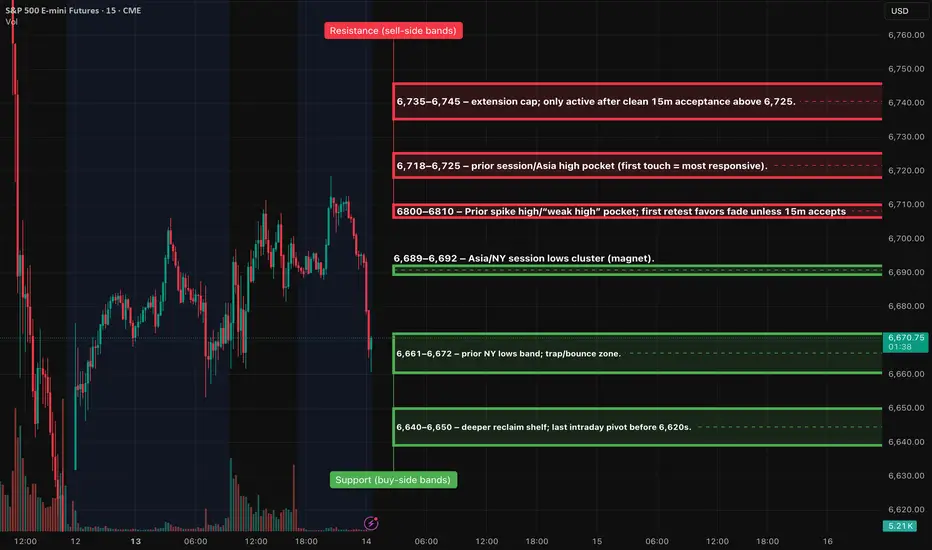
GOLD 1H CHART ROUTE MAP UPDATE & TRADING PLAN FOR THE WEEKHey Everyone,
Please see our updated 1h chart levels and targets for the coming week.
We are seeing price play between two weighted levels with a gap above at 4022 and a gap below at 3987. We will need to see ema5 cross and lock on either weighted level to determine the next range.
We will see levels tested side by side until one of the weighted levels break and lock to confirm direction for the next range.
We will keep the above in mind when taking buys from dips. Our updated levels and weighted levels will allow us to track the movement down and then catch bounces up.
We will continue to buy dips using our support levels taking 20 to 40 pips. As stated before each of our level structures give 20 to 40 pip bounces, which is enough for a nice entry and exit. If you back test the levels we shared every week for the past 24 months, you can see how effectively they were used to trade with or against short/mid term swings and trends.
The swing range give bigger bounces then our weighted levels that's the difference between weighted levels and swing ranges.
BULLISH TARGET
4022
EMA5 CROSS AND LOCK ABOVE 4022 WILL OPEN THE FOLLOWING BULLISH TARGETS
4049
EMA5 CROSS AND LOCK ABOVE 4049 WILL OPEN THE FOLLOWING BULLISH TARGET
4074
BEARISH TARGETS
3987
EMA5 CROSS AND LOCK BELOW 3987 WILL OPEN THE FOLLOWING BEARISH TARGET
3955
EMA5 CROSS AND LOCK BELOW 3955 WILL OPEN THE FOLLOWING BEARISH TARGET
3924
EMA5 CROSS AND LOCK BELOW 3924 WILL OPEN THE SWING RANGE
3883
3848
EMA5 CROSS AND LOCK BELOW 3848 WILL OPEN THE SECONDAARY SWING RANGE
3819
3775
As always, we will keep you all updated with regular updates throughout the week and how we manage the active ideas and setups. Thank you all for your likes, comments and follows, we really appreciate it!
Mr Gold
GoldViewFX