Tradingstrategies

SOL - Buying SignalBYBIT:SOLUSDT
1 Hour trend
-
SOL is forming a bullish flag and going to get rid of the downtrend which cause resistance for price.
If it can break out this line, trading strategy as below.
-
Targets:
1) 47.366
2) 49.47~50.32
3) 52.145
4) 55.1
Stop: 43.755
Reward/Risk: 2.22

AUDNZD Technical Chart Analysis.Price is moving in a FLAT CHANNEL and testing its Resistance area. We will be looking for a bearish correction in a lower timeframe for confirm entry.

7/16/22 EURUSD Daily chartWe can clearly see we have a big downtrend going on with EURUSD on daily and it's respecting the channel it has created making new lower low levels.
We have the supply area around the level of 1.03926 which from there we can see a big push towards the new lower level at 0.99545 and which we have been seeing a consolidation in the past week making it our support area.
The week ended with a good green candlestick engulfing the previous red one we had, making it a really good confirmation of a possible reversal towards the supply area.
We also have the indicator MACD which is confirming us that sellers are losing power giving it an extra boost for the pushback towards the supply area.

GoldViewFX - DAILY CHART UPDATED STRUCTUREHey Everyone,
We have updated the daily chart setup with the updated Goldturn trendline and the demand zone is potentially back in range. Should the price test the demand zone we should be able to catch a few buys off this level. Even if it fails, it normally pays a few times before it fails. We will determine this using our Goldturns.
EMA5 break below 1742 will potentially open the demand zone and a failure to break this level will see price test 1816 again. As we stand we are still within a daily chart range between 1816 - 1741. With the potential to open 1680 creating a new range of 1741 - 1680, should 1740 break.
We will keep a close eye on this and as always keep you all updated with any changes. Please don't forget to like, comment and follow to support us, we really appreciate it!
GoldViewFX
XAUUSD TOP AUTHOR

CRV - Selling SignalBYBIT:CRVUSDT
4 Hours trend chart
-
CRV cannot be supported from the uptrend anymore, also forms a small double top here.
We can plan a strategy to short at the broken candle, which closed point is 0.992, and set target/stop as below.
-
Targets:
1) $0.962~$0.953
2) $0.932
3) $0.9
Stop:
1) $1.034

In the past 10 years this is a good time to buyThe 30 moving average on this weekly chart has always been a very important support. Will it be this time too? We are at the beginning of the corporate earnings season, the job market looks strong and the Fed has taken a decisive direction. I cannot know if it is the beginning of a rise (have the lows of the decade been marked?) Or it will be just a rebound. We are watching

Deeper Network DPR Crypto Bearish MDeeper Network DPR Crypto breaking down from the Bearish M Pattern with a drop to .0186cents. It is starting to hit the first resistance line, we will see if it can break thru or get pushed back down.
Bullish News: Aug. 5 & 6, 2022 Deeper Network has an invitation to showcase at Sir Richard Branson’s Block Chain Summit on Necker Island at the Neckerverse Showcase for a chance to pitch to the Virgin Impact team and other global heavyweight investors.
Bearish News: Possible Token Crash Starting around September 6, 2022 thru the next 8 months, investors getting Deeper Chain DPR returned to them who bought in at .006cents to .02cents. Deeper is only allowing 750,000 DPR total perday from the miners and the invests to go over the bridge from Deeper Chain to the other two chains to get to an exchange and to sell. Some of the people have set up computer programs to keep dumping coins over the bridge first so they do not get locked out when the daily total of 750,000 is hit. There was 2Billion token allocated to sell but they only advertise 1Billion being sold. DPR given out already to the investors that crashed the coin the first time, there is an estimated amount of 3.3Million to 6.6Million Deeper Chain DPR being released each day to their investors for the next 8 months starting in September 2022 thru May 2023. Will Deeper fully open the bridge or will they try to control their investors cash out for a second time, well see what happens…….. How will the miners plan for this apocalyptic scenario of no longer being able to move Deeper Chain DPR across the bridge to get it on an exchange to pay for their expenses? I foresee another massive upset that Deeper Network will hush the investors by kicking people out of there Deeper Network community social groups when people complain and get upset like what happened when they lock up the investors DPR the first time without paying them back as was promised in their smart contract that had a hidden back door in the smart contract to reprogram it and to lock back up again. This is a lack of trust that I don’t think Deeper Network will every out live.
-Crypto Whale Information: See the Whale news on my channel for their Wallet address & Location, as you can track for yourself who is a true supporter and who is a dumper…… (AMA said Whales are allowed in the project now)
- Deeper Chain Community Governance - Currently being controlled directly by Deeper Network, not by the Community but thru a back door in the program (Verified on AMA)
- 7 Validator Nodes on Deeper Chain, 3 have been verified to be in control of by Deeper Network DEVs, apparently they can control votes on the Governance with their locked DPR rewards- Wallet Addresses 1st 5C4vNVT5pDroqufEtXKYp3RKrNXVTHk9yqTeNNUSnJ6EbGGY ; 2nd 5CJDFR5RCMxPwVdzgH6JA9D7M625FEFKrdsJG1JnQVQdQkH2 ; 3rd 5HCG6MvAhYgLZdPoD1BVHEjgKee9n4AhMLKfq64VLiM4znuU
-Deeper Chain DPR Crypto Burn Wallet #1: (Warning this is a subject Deeper does not like to talk about) There has not been a routine burn setup yet promised by Deeper to fight inflation . The only burning is est 21DPR perday equivalent to about .80cents per day!!! from the Validator transactions which they are calling a “Routine Burning or Every Gas Fee”. The old burning was every 7 days and burnt all the treasury wallet. Then they slowed it down to every 24 Days thru the Treasury and to burn only about 1% now. There is credit burning set up for the miners, which is false advertisement because they only burn 1% of the money paid to buy credit to increase mining rewards. The rest of the money is added to the treasury wallet for Deeper to pay their DEVs instead. Waiting for Deeper Network to provide Burn Wallet Address for all three Blockchains so the community can monitor what they are being told. Talking about this subject will get you band and removed from Deeper Network Social media accounts so be aware………… Deeper Network has responded to my concern about this saying "that 1% of the treasury wallet is burned each day" but I don't believe that's what happens, I believe that only 1% of each transaction that is transferred to the Treasury wallet is then sent into the burn wallet only during the transaction process, not that 1% of the treasury wallet total is burned. So once the funds go into the Treasury wallet once the 1% has been taken out, the remaining funds are no longer programed to be burned. (...to be determined) At the moment it is unknown how to see a total burn amount from this wallet but you can see how much DPR will be burned in the next 7 day burn period.
-Deeper Chain DPR Crypto Burn Wallet #2: Deeper Network has not provided the wallet address from the burning during the Pico sale so the community can monitor the wallet activity.
- Deeper Token ECR-20 Blockchain Ethereum Burn Wallet Address - Deeper Network has not provided the wallet address from the burning during the Pico sale so the community can monitor the wallet activity.
- Deeper Token BSC Binance Smart Chain Burn Wallet Address - Deeper Network has not provided the wallet address, nothing would be in the wallet address that i would be aware of if it exist yet
- Deeper Chain Treasury Wallet Address: 5EYCAe5ijiYfyeZ2JJCGq56LmPyNRAKzpG4QkoQkkQNB5e6Z (At the moment this is funded by the left over Validator Transactions & Burn DPR for Credit Score Increase, 1% of Transactions going into the wallet are Burned, this is confirmed)
- Polkadot Parachain for Deeper Chain – not yet, no future plans at the moment (Verified by Polkadot Support)
-10 Billion DPR Total: 6 Billion DPR will be mined within 25years (Verified on AMA); & 4 Billion DPR Belong to Deeper & Investors
-Location of Deeper Network servers where VPN data is stored: Unverified, Programmers working from China, ect. , Government Jurisdiction over VPN data information unknown, Privacy VPN info shows data is kept by Deeper Network, time period kept unknown.
- Deeper Network VPN / DPN equipment concerns: They say they do not keep logs of records of your internet access BUT!!!!! When you login to the device for the first time it makes you approve there two privacy agreements first. Terms and Condition of Use agreement under point Prohibited and restricted uses point #25 say : “We shall have the right… to monitor User Content”; The second agreement you must approve is the Deeper Network Privacy Policy under Data we Collect says “We may receive access to basic personal information from your social network accounts should you register or sign onto such services using Deeper Network Products or Services” (Why in the world is Deeper trying to collect your personal information?????????), then under section Data Retention it says “We will keep records containing personal data….. as maybe required by applicable laws (So then which governments laws are you under because there are countries that require no data collected) at the end of the day Deeper Network is not a Decentralized VPN because your data is collected in Deeper Networks Servers and Deeper Does not allow the Miners with the Exit Nodes for the VPN service to erase the VPN data on there own devices, even if their country allows for no logs to be collected. Will Deeper Network change their policy’s to be in harmony with what they told their community of NO LOGS/DATA KEEP BY DEEPER and ONLY DATA COLLECTED ON EACH EXIT NODE, apparently, they changed their minds……
Pico - At the moment the Pico is only good for mining with a Staked credit score, if the Pico has its own Public IP and is connected for months without being disconnected it will currently not get 10mb of traffic each day to get an increased organic credit score as an exit node, they network currently will choose a faster path out thru a Mini instead. So the Pico at the moment is not a good mining device if that's what you bought it for. This has been confirmed.
-Company Info:
-Deeper Network INC of the Marshal Islands (no office location there currently) Crypto Currency company that was set up as a shell company, filed on March 8, 2019 Entity number 100333 (Legal system mixed legal system of US and English common law, customary law, and local statutes; International law organization participation accepts compulsory ICJ jurisdiction with reservations; accepts ICCt jurisdiction)
-Deeper Network Inc of Delaware USA (no office location there currently) Software Developer/ VPN / DPN , Entity 201816910575 6/14/2018, EIN Tax ID# 841835438, State ID 04799167 This is the company that controls everything.
-Location Of Head Quartiers Office (5200 Great America Pkwy, Santa Clara, California, 95054) : The main temp office rental location no longer exists that is advertised and on Entity Documents the location is currently enmity and abandoned, supposedly working remotely from home and out of a shipping warehouse since the past two years or longer, unable to verify from the last trip to California. No new permanent office location currently that I am aware of that has been verified.
(A Few people have come and gone from the head ranks, not sure if currently accurate)
Chief Executive Officer: Hui (Russell) Liu; San Jose, California
Chief Technology Officer: Hui Liu/Chao Ma
Secretary/Chief Financial Officer: Xiaoshuai (Cheryl) Liu ; Maple Ridge, British Columbia, Canada
Corporate Officer: Adam Wolfe
Lei Chang; Saratoga, California
Chief Marketing Officer: Eric Ma (Thailand)
Chief Branding Officer: Yinan S.
Software Developer: Arturo Jimenez
Product manager: Kain Xu

BTC - Buying SignalCOINBASE:BTCUSD
4 Hours chart
-
BTC already broke out the downtrend and we've longed it there(~20800)
Next, it forms a double bottom here after taking out neckline(at 21866).
Therefore, we can add some more position around this level, and look forward to higher targets as below.
-
Targets:
1) 23035.21~23508.05
2) 24522.5
3) 26164.55
Stop:
1) 20773
RRR: 1.5

SAND - Buying SignalBYBIT:SANDUSDT
4 Hours time frame
-
SAND is showing a potential double bottom here
We can long it here with strategy as below.
-
Targets:
1) 1.3491
2) 1.5173~1.585
3) 1.6582
Stop:
1) 1.1507

SOL - Selling signalBYBIT:SOLUSDT
1H chart
-
SOL is forming a double top(bearish pattern) on 1H time frame.
$35.8 is a nice position to open short, and TP/SL as below.
-
Targets:
1) 35.12
2) 34.615~34.415
3) 33.975
Stop loss:
1) 36.265-----red horizontal ray

CRV - Buying SignalBYBIT:CRVUSDT
4 Hours chart
-
CRV is approaching the neckline of the potential double bottom.
We can gain a good risk to reward ratio(2.04) if long it here, targets and stop level as below.
-
Targets:
1) 0.963~1.0
2) 1.080
3) 1.209
Stop loss:
1) 0.809-----red horizontal ray

EHT - Selling strategyCOINBASE:ETHUSD
4 Hours trend
-
ETH/USD is forming a potential HS on 4H chart.
Also, it will build double top at first, so I use Fib with this pattern to set targets and stop level as below.
-
Targets:
1) 1026
2) 1001.7~991.93
3) 970.92
Stop loss:
1) 1090.6-----red horizontal ray

XAUUSD - KOG REPORT!03/06/22
KOG Report:
In last weeks KOG Report we said we would remain bearish on Gold and could see a turn being imminent after the range breaks. We suggested traders look at the immediate resistance levels above to target longs level to level and look for a rejection on price to short the market back down with the ultimate target being 1785! What a move we saw on Gold, meeting all our expectations that were not only mentioned in the KOG Report but also throughout the week in the daily briefs.
Furthermore, in Camelot, once we formed approached the low we suggested no more selling and to only look for long trades to carry the move back up into immediate resistance. Pip capture on Gold was well over 800pips through the week trading up level to level and down to complete the move.
So, what can we expect in the week ahead?
We would say the early sessions may give us some ranging price action with an immediate range of 1816 resistance and 1803-6 as support. We’re still not convinced this is the low for Gold so we’re suggesting caution for the early part of the week. We would like to see another tap into the 1780-85 price region and potentially a little lower to form support before we then attempt to go long again! The larger range stands at 1780-1835, these remain the levels that need to be broken and price needs to hold above to determine the next big move. We still have that level of 1865-70 that we feel the price will need to visit so this is a potential target for those who are bullish on Gold. For us, it will simply come down to what we get first to determine the long or short. Up into the extreme high and we’ll look for the short, down into the extreme low and we’ll look for the long. Until then we’ll trade it level to level making the most of what the market is giving us.
We will look at this with an overall view for the week and as always with two scenario’s in mind for the longer move. We update the intraday levels and potential movement so please look out for those charts during the course of the week as well.
Scenario 1:
We open and tap that 1816 region, we want to see a reaction in price here with possible rejection and confirmed resistance. IF we get that, we feel this would be the first opportunity to test the short trade back into the 1810, 1806 and below that 1795 price targets. If we break above the 1816 level the next level above is around 1820 and above that 1826. We want to see the price stay below the 1830-35 price zone to maintain the bearish view for the week. As long as we get the move down, we will be waiting around the 1780-85 and below that 1770-65 price zones to then take the long position to target the 1850 price region.
Scenario 2:
We open and come down straight away to into that 1800-1795 region. Here we will be looking for support to form and if confirmed we feel this level will represent a short-term opportunity to long the market back up into the 1816 and above that 1820-25 price regions. That 1825 level is where we want to see a reaction in price, do we break above and target 1830-35’s liquidity pool or do we get the short to target that potential double bottom left last week on the Daily into the 1790-80 price levels?
Hope this helps in preparation for the week ahead, we will update you as we go along as we usually do. Please do support us by hitting the like button, leaving a comment, and giving us a follow. We’ve been doing this for a long time now providing traders with in-depth free analysis on Gold, so your likes and comments are very much appreciated.
As always, trade safe.
KOG

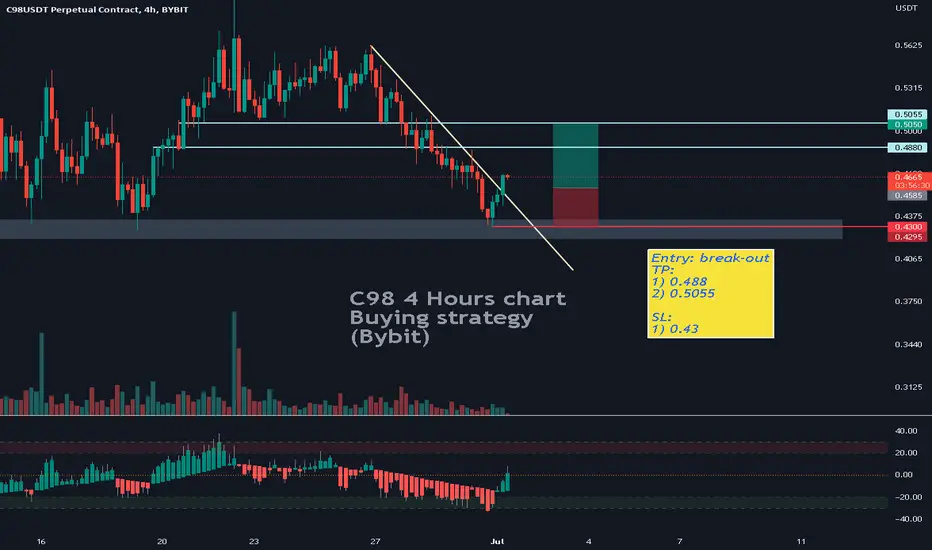
C98 - Buying signalBYBIT:C98USDT
4 Hours Time Frame
-
C98 broke out the downtrend on 4H
We can set a quick strategy with good risk to reward ratio here.
-
Targets:
1) 0.4880-----green horizontal ray
2) 0.5055-----green horizontal ray
Stop loss:
1) 0.43-----red horizontal ray
Nifty Options SellingAs nifty crossing to close above 15800 but not sustaining so booked some profit in Bull Put spread i.e arround arround Rs 275 but Shorted Puts of Strike Price 15300 (2 Lots), 15400 (7 Lots) and 15450 (3 Lots) and getting decent amont Rs 10000/- so weekly expiry proven to be good for me. Its not recomendation nor any kind of Tips do your analysis and make position according to your Risk to Reward.

AIAENG TGT ModifiedJust go through the analysis idea of AIAENG on 13th June. The Target revised for this stock this is infact a god Risk to Reward Trade if executes properly "What else anyone need".

Bear Call SpreadAs i discussed in my last post if Nifty reaches to my Reasistance zone I will create an Option Strategy so i did created "Bear Call Strategy" by selling a Call of 15700 and against that Anchor unit bought an offset uinit of call 15950 for perfet spread i want to buy 16000 CE but it was not liquid at that time and was available only for Intraday you can't convert it to Holdings. Here i want to state that both calls are of next expiry as a day after tommorow is expiry day and i didn't want that my options epires worthless. "TRADE RIGHT, SIT TIGHT"

Bouncing on 200ma ? Small tight stop loss huge reward. below to that last low
We need to close above 200ma to validate a bull signal.
Opportunities like this don't come very often.

XAUUSD - KOG REPORT!In last week’s KOG Report we said that if the price pushed up into the 1878-85 region, we would be looking for resistance around there to then take a short on Gold down into the 1860 and below that 1855 price points. During the course of the move, we updated followers saying we would not be going long on Gold at those support levels as we identified a structure on the charts which was telling us we will see another swoop of liquidity from below. This gave us move down into the 1805 region where we finally completed the move.
For this week we’re going to keep it short as again not much has changed! We’re still playing the 4H range and we’re still swinging up and down aggressively within it. We’re going to say expect more of this to come in the week ahead, the markets are extremely volatile and although we’re getting big moves on the swings, they’re making it difficult for traders to trade the complete move in one go.
So, what can we expect in the week ahead?
We’re still overall bearish on Gold so will stick with that view for now. We can see there being potential for a move to the upside which would be fantastic tapping into that 1860-75 price region where we can then see another aggressive price reaction. We have targets below but want to see how we start the week, focusing on the 4H chart structure and Excalibur to guide us. We’ll stick with longs level to level with the view to get another long-term short entry from the top. Whether we get it or not, remains to be seen!
So, we’ll trade it with two scenarios in mind based on how the market opens and where we go first.
Scenario 1:
Price opens and pushes down into the 1835-30 support region. This is where we will be looking for strong support and feel an opportunity to then go long could be on the table targeting the 1850 level first and above that 1860-65. We would then like to assess the price action at the above levels looking to take our short entry if we’re satisfied!
Scenario 2:
Price pushes up on opening, we will wait for the price to attack and try to break the 1850 level. If it does and 1845-50 support is confirmed, we will trade this level to level to the upside looking for the first target of 1865 and then above that 1875-80. Those higher resistance levels are where we will be waiting for confirmation of a reversal to then take the short entry back down targeting 1835 and below that 1810.
As we said, we’re going to keep it short this time. The markets are very volatile and aggressive, and it doesn’t look like they’re finished yet! We had another good week and don’t want to give anything back to the market so please trade carefully if you are going to trade.
Hope this helps in preparation for the week ahead, we will update you as we go along as we usually do.
Please do support us by hitting the like button, leaving a comment and giving us a follow. We’ve been doing this for a long time now providing traders with in-depth free analysis on Gold, so your likes and comments are very much appreciated.
As always, trade safe.
KOG

long TRX$TRX is bouncing off the support level. Bullish movement to resistance level at 0.0754$ is possible.

trading plan goldgold sell now at/below 1869 - 1871. good luck traders! salam profit. Disclaimer on !

Easy Trading Stradegy!Use a simple trend based fib extension and turn on the 50% level. Price will return to this level most often when trading in both directions (long or short) .
