Need to see if it can rise above 104463.99
Hello, fellow traders!
Please "Follow" to always get the latest information quickly.
Have a great day.
-------------------------------------
(BTCUSDT 1D chart)
The price declined from the DOM(-60) indicator level of 106431.68, but the DOM(-60) indicator is still forming at 106431.68.
Therefore, the 106431.68 level can be considered a low point.
Therefore, we need to observe how the price moves during this volatile period, around November 4th-9th (maximum November 3rd-10th).
Since it fell below the critical 104463.99-108353.0 level, if it fails to rise above this level, we should check for support near the next critical level of 89294.25.
At this point, the M-Siganl indicator on the 1M chart is passing through a critical zone, so it's expected to re-establish the trend once it meets the M-Siganl indicator on the 1M chart.
If the OBV indicator falls below the Low Line and fails to rise again, it's likely to touch EMA 3.
For the price to break above a critical point or zone and continue the uptrend,
1. The StochRSI indicator must be rising. Ideally, it should not be in an overbought zone.
2. The TC (Trend Check) indicator must be rising. Ideally, it should remain above the zero level.
3. The OBV indicator must be rising. Ideally, it should remain above the High Line.
If the above conditions are met, the upward trend is likely to continue after breaking above a critical point or zone.
Currently, the price is moving against the above conditions, so there's a possibility of further decline. However, given the volatility, it's better to wait and see rather than assume a decline.
-------------------------------------
I'm curious about what will happen next, but there's no way to know for sure.
However, as I've repeatedly mentioned, if you're trading according to a basic trading strategy that suits your investment style, I believe you'll be able to trade according to your strategy, whether the current decline continues or rebounds and rises.
As I mentioned in a previous idea,
- If a daily decline exceeds -10%, a rebound is highly likely,
- If a daily increase exceeds +10%, a reversal is highly likely.
Therefore, if you're familiar with scalping or day trading, you can profit from trading.
However, you must sell at that profit to lock in your profits.
The basic trading strategy I mentioned is to buy in the DOM(-60) ~ HA-Low range and sell in the HA-High ~ DOM(60) range.
Furthermore, we can respond based on the support and resistance levels identified on the 1M, 1W, and 1D charts, which are important areas.
Therefore, the current available support levels are the 104463.99-108.353.0 and 87814.27-93570.28 levels.
The remaining support and resistance levels can be used as trading opportunities.
In other words, these are points for securing profits.
-
Due to this decline, the HA-High indicator on the 1M chart is showing signs of forming at the 110105.69 level.
Therefore, if there is a rebound, the 110105.69 level could potentially serve as resistance.
However, as the price rises, the HA-High indicator on the 1M chart could return to its previous HA-High level.
Therefore, we need to determine if support is found in the 104463.99-108353.0 range and consider a response plan accordingly.
-
If the price falls below the M-Signal indicator on the 1M chart and remains there, there's a possibility of a downtrend, so we should also consider a response plan.
The coin market operates in decimals, allowing for more flexible trading than the stock market.
This means that by trading at a buy price, you can profit even if you're losing money and increase your coin (token) holdings.
For example, if you bought $100 at $101,000, you could sell $100 (including transaction fees) when the price rises, increasing your profit.
By increasing your profit, you can quickly turn a loss into a profit.
If you bought $100 at 101,000 and only had 0.1 coins (tokens), you could sell those 0.1 coins and generate a cash profit if the price rises and you're making a profit.
However, this method is only applicable if you won't be trading that coin (token) again.
In other words, if you sell 100% of your holdings, you'll need to wait until the next price fluctuation, or you could end up making a worse trade.
Therefore, if possible, it's best to trade with the same amount you bought, increasing the number of coins (tokens) that represent your profit.
Don't think you should just leave the coin (token) you're losing and trade another coin (token) to make a profit.
This could actually lead to further losses.
-
Thank you for reading to the end.
I wish you successful trading.
--------------------------------------------------
- This explains the big picture.
(3-year bull market, 1-year bear market pattern)
I will explain in more detail when the bear market begins.
------------------------------------------------------
Tradingstrategy

ES (SPX, SPY) Analysis, Levels, Setups for Wed (Nov 5th)News & timing (ET): ADP 8:15; ISM Services PMI 10:00; EIA Crude 10:30. Release status: all three are scheduled to run (not shutdown-affected).
Bias & context: Short-term trend remains lower after a sequence of 15m lower-highs/lows and failure to hold 6,793–6,805. Expect dip-buys to be sold unless 6,860+ is reclaimed and defended.
Overnight → NY forecast:
Base path: probe 6,748–6,756 into Asia/London, bounce to 6,793–6,805, then decide at NY open. Lose 6,748 on momentum and the magnet becomes 6,713–6,725.
Alt squeeze: reclaim and hold above 6,852–6,860, push to the 6,900–6,906 “gate”, then 6,940–6,955. Only above 6,955 can 6,968–6,985 and 7,020–7,052 come into play.
Bear extension: clean break and 15m body acceptance below 6,713–6,725 opens 6,660s (deeper extension) before any meaningful bounce.
Key-Zones
Resistance (top→bottom):
7,020–7,052 premium band (W3 major; first touch favors profit-taking)
6,968–6,985 measured-extension / weak-high pocket (W2)
6,940–6,955 prior distribution top / supply shelf (W2)
6,900–6,906 immediate ceiling “gate” (W2 pivotal)
Support (top→bottom):
6,852–6,860 defended floor / quick-reclaim bounce zone (W2)
6,793–6,805 swing-equilibrium magnet (W2)
6,748–6,756 next demand shelf / measured support (W2)
6,713–6,725 extension target and last strong shelf before deeper repricing (W3)
Setups (Level-KZ Protocol 15/5/1)
Rejection Fade (short): sell 6,852–6,860 or 6,900–6,906 after a 15m rejection close back inside → 5m re-close in your favor; use the 15m wick +0.25–0.50 pts as hard SL. TP1 = next opposing MAJOR level (e.g., 6,805 then 6,756).
Acceptance Continuation (long): only after a full-body 15m close above 6,860 and a 5m pullback that holds; target 6,900–6,906 → 6,940–6,955; invalidate on a 15m close back below 6,852.
Quick-Reclaim Bounce (Tier-2): flush into 6,748–6,756, instant reclaim on 1–5m, enter on first HL; TP1 = 6,793–6,805; invalidate on a 15m close back below the shelf.
Exhaustion Flush (Tier-3): if 6,748 breaks with force and a 15m body holds below, sell the first 1–5m LH; TP1 = 6,713–6,725; runner eyes 6,660s if momentum persists.
Risk & management (use consistently):
Instructions: only take a setup if TP1 ≥ 2.0R using the 15m-wick SL.
At TP1: close 70%, set 30% runner to BE; runner aims TP2 at the next major level.
No trailing before TP2. Time-stop 45–60m if neither TP1 nor SL hits. Max 2 attempts per level per session.
Kill-zones (ET): London 02:00–05:00 (optional ½–¾ size); NY AM 09:30–11:00 (primary); NY PM 13:30–16:00 (primary). Manage only 12:00–13:00.
What flips decision:
Bullish: sustained 15m acceptance above 6,860 then above 6,906 turns path toward 6,940–6,955 → 6,968–6,985.
Bearish: 15m acceptance below 6,748 invites 6,713–6,725; losing that level opens 6,660s before any notable bounce.

Example of a Trading Style
Hello?
Hello, fellow traders.
Follow me to get the latest information quickly.
Have a great day.
-------------------------------------
While it's ideal to always close a trade in profit, this isn't always the case.
Therefore, you should maintain your trade by locking in profits through fractional trading.
Based on the trading information provided by the exchange, once a trade has turned into a loss, it's likely to take a considerable amount of time to turn into a profit again.
Therefore, you should trade at different buy and sell prices.
However, this is a rather tedious process, so it's not usually done that way.
-
If you were to buy near the area shown on the chart, the estimated average purchase price would be significantly higher than the current price.
Therefore, you wouldn't be able to proceed with the trade.
Therefore, we must trade by purchase price.
The purchase prices for positions 1 and 2 are quite high, so we don't pay attention to them.
Since the current price is near the purchase price for position 3, if it turns into a profit, you can sell the amount you purchased near position 3 to lock in the profit.
By subtracting this profit from the purchase price for positions 1 and 2, you can minimize your losses.
This trading method is possible because the coin market allows trading in decimals.
The key here is to trade by purchase price.
You should not trade in units of the number of coins you purchased.
For example, if you purchased $100 at point 3 (106431.68), you should sell $100 when the price rises.
Trading this way will allow you to quickly recover from losses and even generate profits even during losses.
-
You can profit whenever volatility occurs, regardless of whether the asset (coin or token) you're trading is in a loss or a profit.
You should avoid increasing the number of assets (coins or tokens) you're trading without managing them.
------------------------------------------------
To do this,
1. Mark support and resistance points on the 1M, 1W, and 1D charts.
2. Develop a basic trading strategy using these support and resistance points.
3. Avoid greed and execute split trades according to your trading strategy.
-
Thank you for reading to the end. I wish you successful trading.
--------------------------------------------------

Volatility Period: Up to November 10th
Hello, traders!
Follow us to get the latest information quickly.
Have a great day!
-------------------------------------
(BTCUSDT 1D chart)
This volatility period is expected to last from November 3rd to 9th.
First, we need to check the movement between November 3rd and 5th.
While the key question is whether the price can rise after finding support at the important support and resistance level of 104463.99-108353.0, it's crucial to check for support around 106431.68 within that range.
This is because the 106431.68 point is the DOM(-60) level.
-
The DOM indicator is a comprehensive evaluation of the DMI, OBV, and MOMENTUM indicators.
DOM(-60) indicates that all three indicators have reached their lows.
Therefore, support is necessary to confirm the possibility of a bullish reversal.
If the price rises after the DOM(-60) indicator first appears and then touches the DOM(-60) indicator again, it is highly likely that the price will fall without finding support.
If the price rises after finding support at the DOM(-60) indicator, it should follow a period of sideways movement to confirm support.
-
Therefore, what we can do now is take the time to determine which direction the price deviates from the 106431.68-108353.0 range and where it encounters support and resistance.
You need your own basic trading strategy to execute your trades.
No one else can do this for you.
This is because you need to tailor your trading strategy to your investment style to avoid regrets.
My basic trading strategy is to buy in the DOM(-60) ~ HA-Low range and sell in the HA-High ~ DOM(60) range.
However, if the price rises in the HA-High ~ DOM(60) range, a step-up trend is likely, while if the price falls in the DOM(-60) ~ HA-Low range, a step-down trend is likely.
Therefore, a split trading strategy is required.
-
The formation of the DOM(-60) indicator indicates a buying opportunity. However, as previously mentioned, this is the second time the indicator has fallen below the DOM(-60) level since its formation, increasing the likelihood of further declines.
If the price falls below 104463.99 and continues to decline, it is expected to meet the M-Signal indicator on the 1M chart and re-establish the trend.
At this point, the key area to consider is support, particularly around the left Fibonacci level of 2.618 (87814.27) to the left Fibonacci level of 3.14 (93570.28).
If the price declines and a new HA-Low indicator is formed, support around that level is crucial.
-
You can profit by trading whether the price is in an uptrend or a downtrend.
However, the trading period may vary depending on the trend.
Therefore, you should check the flow of funds and determine whether trading is possible based on the support and resistance levels currently established.
To continue the uptrend by breaking above a key point or range,
1. The StochRSI indicator must be trending upward. If possible, it should not have entered an overbought zone.
2. The TC (Trend Check) indicator must be trending upward. If possible, it should remain above the zero level.
3. The On-By-Sign-Operative (OBV) indicator must be trending upward. If possible, it should remain above the High Line.
When all three indicators above are met, an uptrend is highly likely.
Currently, the On-By-Sign-Operative (OBV) indicator is located near the Low Line, following the EMA 3 > EMA 2 > EMA 1 > OBV.
Therefore, we can see that selling pressure is dominant.
However, since it's located near the HA-Low indicator, you should pay close attention to the situation.
If it finds support in the DOM(-60) ~ HA-Low range according to the basic trading strategy, it's a good time to buy.
-
Thank you for reading to the end.
I wish you successful trading.
--------------------------------------------------
- Here's an explanation of the big picture.
(3-year bull market, 1-year bear market pattern)
I'll explain more in detail when the bear market begins.
------------------------------------------------------

Emotional Discipline and Risk Control in Trading🧠 1. Why Emotional Discipline Matters
Emotional discipline means sticking to your plan regardless of fear or greed.
Markets are designed to test your patience, confidence, and decision-making. Every losing trade tempts you to change your system — but consistency wins.
✅ Key habits of emotionally disciplined traders:
They accept losses without revenge trading.
They follow rules, not impulses.
They manage expectations — no trade will make them rich overnight.
💰 2. Risk Control — Protect Before You Profit
Your risk management defines your survival. Successful traders think in probabilities, not certainties. They never risk too much on one idea.
📏 Golden Rules of Risk Control:
Risk 1–2% of your capital per trade.
Always use a stop-loss, never a “mental” one.
Define your R:R ratio (minimum 1:2 or better).
Never add to a losing position — only to confirmed winners.
Risk control is not about avoiding losses — it’s about limiting damage and staying consistent over time.
🧩 3. How to Strengthen Emotional Discipline
Like a muscle, discipline grows with routine. Try this daily:
Pre-trade routine – review your plan before every session.
Post-trade journal – log your emotions, not just results.
Take breaks – emotional fatigue leads to poor judgment.
Detach from outcomes – focus on process, not profit.
💡 Tip: When you reduce emotional pressure, your clarity and accuracy both improve.
⚙️ 4. Professional Mindset Shift
Amateurs chase profit; professionals protect capital.
Each trade is just one data point — not a reflection of your worth. Once you start thinking like a risk manager first, your results change naturally.
🗣️ “Discipline is choosing what you want most over what you want now.”
📊 Conclusion
To grow as a trader, focus on controlling yourself before controlling the market.
Emotional stability + strict risk control = long-term success.
Be the trader who executes with logic, not emotion. 🧘♂️

USDJPY Eyes 153.20 Support as Fed Signals Patience on Rate CutsHey Traders,
In today’s trading session, we’re monitoring USDJPY for a buying opportunity around the 153.200 zone. The pair remains in a broader uptrend and is currently in a correction phase, approaching a key support and resistance area aligned with the ascending trendline.
Structure: USDJPY continues to print higher highs and higher lows, maintaining strong bullish momentum. The 153.200 level serves as a critical zone of confluence where buyers have historically stepped in.
Fundamentals:
Recent Fed commentary emphasized patience before cutting rates, citing the need for more evidence of cooling inflation. This reinforces a hawkish tone, supporting the Dollar
Trade safe, Joe.

Why Traders Lose Focus After Winning StreaksWinning streaks are dangerous.
They make you feel in control.
You stop thinking in probabilities and start thinking in outcomes.
That shift ends most profitable runs.
After several wins, your brain links confidence with success.
You assume the next trade will also work.
You increase risk, ignore signals, and force setups that do not fit your plan.
This is not trading. It is gambling with momentum.
Your goal is not to feel good.
Your goal is to execute a repeatable process.
Follow these steps:
• Keep your position size fixed for a set number of trades. This prevents emotional scaling.
• Log every trade with entry, exit, and reason. Review data, not emotions.
• Take one day off after three or more wins. It resets focus and stops greed loops.
• Set rules for re-entry after a big win. Do not revenge trade the market in reverse.
• Use alerts instead of constant chart watching. It reduces impulsive entries.
Example:
A trader wins five trades in a row. Balance rises from $10,000 to $11,500.
He increases size from $1,000 per trade to $2,000.
The next trade hits stop loss. He loses $400 instead of $200.
Confidence drops, he forces a recovery trade, loses again.
The account returns to $10,700. Three days of progress lost to one emotional decision.
The fix is mechanical execution.
Do not scale until data shows consistency across at least 30 trades.
Use statistics to guide size, not emotion.
Focus on staying neutral.
Your job is to follow process under pressure.
Discipline after wins separates traders from gamblers.

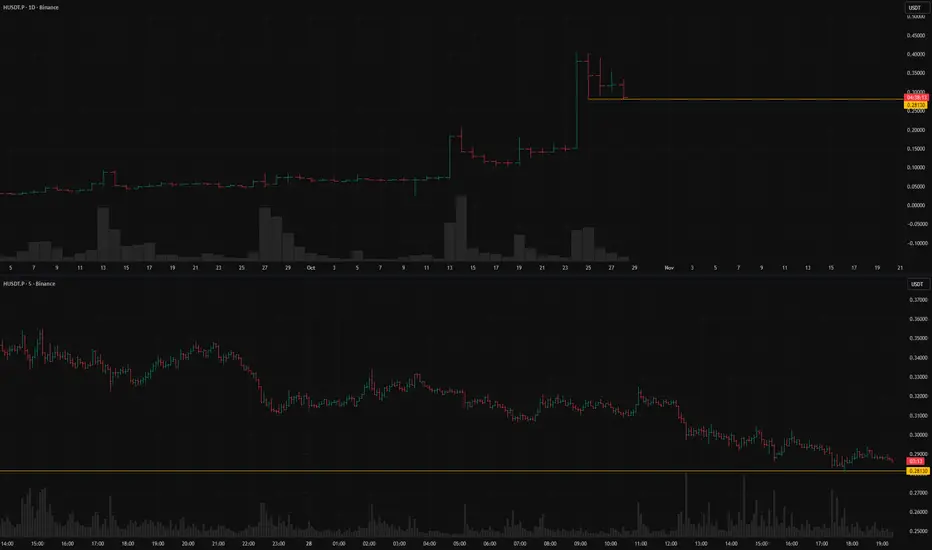
HUSDT.P: short setup from daily support at 0.28130BINANCE:HUSDT.P confirmed the level today with a precise touch. What stands out is the lack of a corrective move after confirming the level formed three days ago — the price has effectively “stuck” to the level, forming a pre-breakout base. This kind of behavior often indicates potential readiness for a breakout.
Key factors for this scenario:
Price void / low liquidity zone beyond level
Volatility contraction on approach
Immediate retest
No reaction after a false break
Was this analysis helpful? Leave your thoughts in the comments and follow to see more.
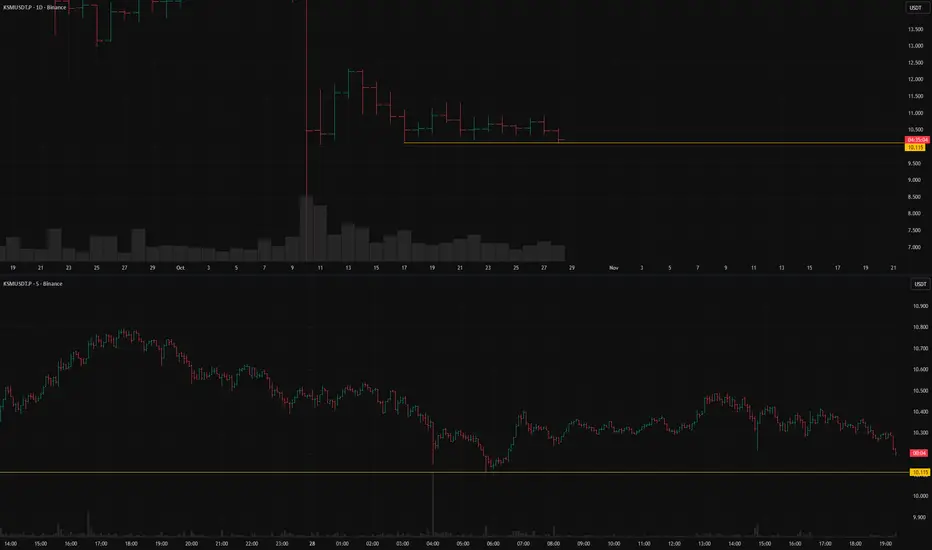
KSMUSDT.P: short setup from daily support at 10.115BINANCE:KSMUSDT.P remains in consolidation, clearly confirming the level — no false breakouts or sweeps, just consistent touches and short pullbacks. The asset has held this structure for nearly two weeks and will eventually break out. In my view, the likely scenario is a short below 10.115.
Today, the asset has already tested the level once and is gradually approaching it again. Maintaining low volatility during this approach will be important.
Key factors for this scenario:
Global & local trend alignment
Volatility contraction on approach
Prolonged consolidation
Was this analysis helpful? Leave your thoughts in the comments and follow to see more.
Trust and Release – 4 Times to LET Your Trade GoEvery trader knows the feeling.
You’ve done all the homework, lined up every signal, and double-checked your risk. It’s like preparing to jump out of a plane with your parachute strapped on – exhilarating, but just a little nerve-wracking.
When you’ve put in the work, planned the trade, and set it in motion, there’s only one thing left to do:
Let it go.
Trust the process and release the trade.
Here are four clear-cut signs it’s time to step back and trust your strategy.
SIGN #1: The System Lined Up Perfectly
You’ve got a strategy for a reason.
You trust it, you’ve backtested it, and it’s made it through countless simulations and reviews.
Whether you’re trading Forex, JSE Top 40 or even the Dow Jones Index.
When all the indicators in your system align, it’s time to act, not hesitate.
Remember, the market rewards action, not perfection.
If your system says “go,” then go. No second-guessing.
J.T.T.T – Just Take The Trade
SIGN #2: Your Entry Orders Are All in Place
You’ve placed your entry orders and planned each move with the same precision as a grandmaster in chess.
So why keep checking every tick?
If you’ve calculated your entry points and set them with intention, then you’ve done your job.
This is your chance to let the market do the rest.
Obsessing over every micro-move will only drag you into a rabbit hole of doubt.
Set it and step away.
SIGN #3: It Matches Your Risk & Reward Criteria
Your trade has a purpose, and you’ve defined it by setting your risk and reward limits.
When your setup meets these criteria, there’s no reason to stick around second-guessing the play.
You know your max loss, and you know your target profit. You’ve thought it through rationally, and now it’s time to trust that process.
You’re here to be a professional, not a perfectionist.
SIGN #4: You’ve Nailed Down Your Trade Size
Position sizing is a science in itself, and you’ve already done the math.
You’re not risking more than you’re willing to lose, and you’re confident in the upside.
If you’ve set your trade size according to your plan, you’ve already protected your capital.
The last thing you need is to add or subtract impulsively. Let the size stay as it is and let the market move.
Conclusion: Trust and Release
Trading is as much about discipline as it is about analysis.
If you’ve done the work, checked off every box, and know your limits, the best thing you can do is walk away and let your trade breathe.
Micromanaging won’t make you money; it’ll just wear you out.
The market is like a river – you can’t force it to flow your way. You can only guide your boat down the path you’ve chosen and let the current do its thing.
When you’ve planned the trade, trust yourself enough to leave it alone.
So let’s sum up the FOUR signs to let your trade go.
SIGN #1: The System Lined Up Perfectly
SIGN #2: Your Entry Orders Are All in Place
SIGN #3: It Matches Your Risk & Reward Criteria
SIGN #4: You’ve Nailed Down Your Trade Size

Next Volatility Period: Around November 5th
Hello, fellow traders!
Follow us to get the latest updates quickly.
Have a great day!
-------------------------------------
(INTC 1M Chart)
The price has broken above the 28.93 level, indicating a long-term uptrend.
The basic trading strategy is to buy in the DOM(-60) ~ HA-Low range and sell in the HA-High ~ DOM(60) range.
Accordingly, the resistance zones are 47.33-49.82 and 55.20-56.48.
The 47.33-49.82 range corresponds to the HA-High ~ DOM(60) range formed on the 12M chart.
Therefore, we should consider the overall resistance zone to be 47.33-56.48 and develop a response strategy.
-
(1W chart)
We should examine whether the price can sustain above the downtrend line (1) and rise along the uptrend line (2).
Since the HA-High indicator on the 1W chart is formed at 45.36, the key question is whether the price can rise above 45.36 and maintain its position.
-
(1D chart)
If the upward trend fails along the uptrend line (2), we should check for support near 36.92.
If not, there's a chance the M-Signal indicator on the 1W chart will touch it.
If the price remains above the HA-High ~ DOM (60) range (35.50-36.92) on the 1D chart, a stepwise uptrend is likely.
However, the price must break above the HA-High ~ DOM (60) range on the 1W and 1M charts.
Therefore, the first hurdle is whether the price can rise above 45.36 and maintain its position.
The next period of volatility will be around November 5th.
After this period of volatility, we need to see if the price stays above the downtrend line (1) and rises along the uptrend line.
-
Thank you for reading.
We wish you successful trading.
--------------------------------------------------

Why Most Traders Exit Too Early — Psychology of Taking Profits1. Introduction
Most traders obsess over finding the perfect entry.
But what really separates professionals from everyone else is how they exit.
Closing trades too early kills more profits than bad setups ever will.
The problem might be one's psychology.
2. The Two Fears That Control Exits
When managing profits, every trader battles two emotions:
Fear of Loss – “ What if the PRICE reverses?”
Fear of Regret – “What if it keeps running after I close?”
Both pull you in opposite directions. One makes you take profit too soon; the other makes you hold too long.
The balance between them defines your discipline.
3. Why Most Traders Close Too Early
After entering a good trade, emotions rise. As profit builds, so does anxiety.
Instead of trusting their plan, traders imagine losing what they’ve just gained, so they close the trade prematurely.
In doing so, they trade emotion, not logic.
It feels safe in the moment, but long term it destroys reward-to-risk consistency.
4. The Solution: Predefine the Exit
The only way to remove hesitation is to plan exits before entering.
Decide in advance:
– Target levels based on structure or risk-reward.
– Conditions that justify partial profits.
– Situations that allow for trailing stops.
When these decisions are made beforehand, emotions can’t interfere mid-trade.
You act according to a plan, not a feeling.
Visual idea: Screenshot-style mockup of trade plan with marked “Entry,” “Partial,” “Final Target.”
5. The Real Lesson
Profit-taking should be systematic, not emotional.
Your job isn’t to catch every little move, it’s to execute your plan without hesitation.

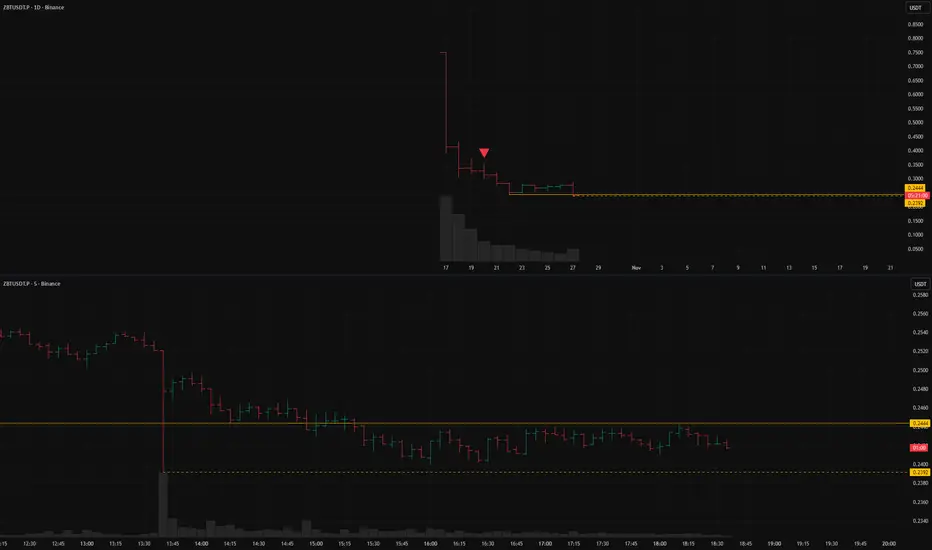
ZBTUSDT.P: short setup from daily support at 0.2444BINANCE:ZBTUSDT.P recently broke through the only support level it had been consolidating above for five days. This indicates accumulated momentum for a further move. The lack of reaction to the breakout also supports a short-side scenario.
I’m watching to ensure volatility doesn’t spike during a potential retest of the level — if it remains stable, the setup could turn into a strong short opportunity.
Key factors for this scenario:
Global & local trend alignment
Price void / low liquidity zone beyond level
Asset decoupled from the market (relative strength/weakness vs. BTC)
Volatility contraction on approach
Immediate retest
Prolonged consolidation
No reaction after a false break
Was this analysis helpful? Leave your thoughts in the comments and follow to see more.
Examples of Chart Interpretation Methods
Hello, fellow traders!
Follow us to get the latest information quickly.
Have a great day!
-------------------------------------
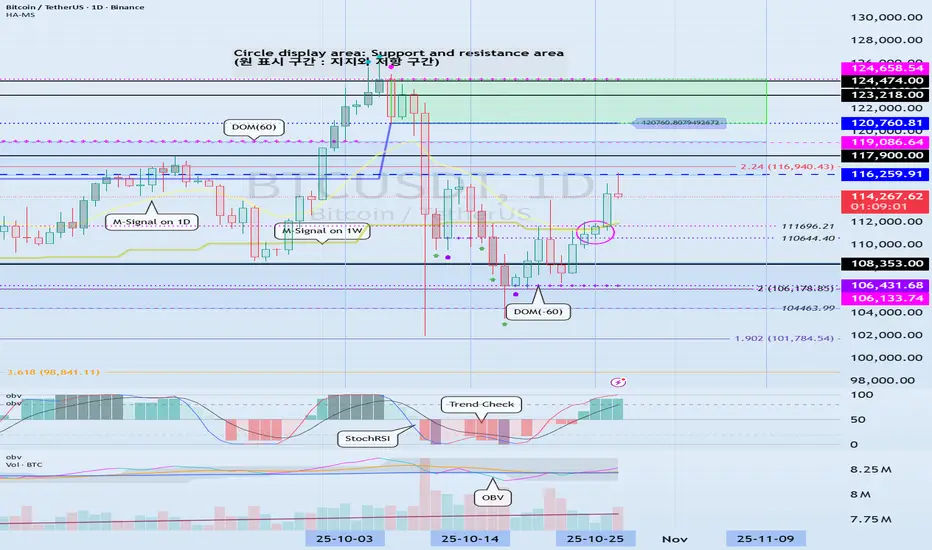
#BTCUSDT
To break above a key point or range and continue the uptrend,
1. The StochRSI indicator must be trending upward. Ideally, it should not enter the overbought zone. 2. The On-By-Signal (OBV) indicator must show an upward trend. If possible, it should remain above the High Line.
3. The TC (Trend Check) indicator must show an upward trend. If possible, it should remain above the 0 level.
Currently, only the TC indicator satisfies the above conditions.
Therefore, if the price remains above the 110644.40-111696.21 range and the above conditions are met, we should see if the price rises above 116259.91 and remains there.
If the On-By-Signal (OBV) indicator remains above EMA 1 and EMA 2 and rises above the High Line, further upside is likely.
However, if the K indicator of the StochRSI indicator enters the overbought zone and the slope changes, the upside may be limited.
When the TC (Trend Check) indicator touches its highest point, there's a high probability of forming a new high, so you should consider a response plan.
Summary of the above:
Support Zone: 110644.40-111696.21
Resistance Zone: 116259.91-119086.64 (up to 124658.54)
------------------------------------
#ETHUSDT
As mentioned in the BTC chart description, ETH is also showing similar movements.
However, the OBV indicator is just about to break above EMA 1 and EMA 2, so if it finds support near 4109.80, there's a possibility of further upside.
-------------------------------------
#ZECUSDT
Based on the BTC chart description, ZEC is likely to continue its upward trend.
The chart is broken due to the sudden surge, making it difficult to determine the duration of volatility.
--------------------------------------------
#XRPUSDT
The key is whether the price can find support at key support and resistance levels and rise above 2.9092.
------------------------------------------
Ultimately, trading will be based on the support and resistance levels drawn on the 1M, 1W, and 1D charts.
However, it is recommended to use auxiliary indicators to confirm whether to initiate a trade.
The basic trading strategy is to buy in the DOM(-60) ~ HA-Low range and sell in the HA-High ~ DOM(60) range.
However, if the price rises in the HA-High ~ DOM(60) range, a step-up trend is likely, while if the price falls in the DOM(-60) ~ HA-Low range, a step-down trend is likely.
Therefore, a fractional trading strategy is recommended.
In this context, the coin (token) currently closest to buying is XRP.
-
Thank you for reading to the end.
I wish you successful trading.
--------------------------------------------------
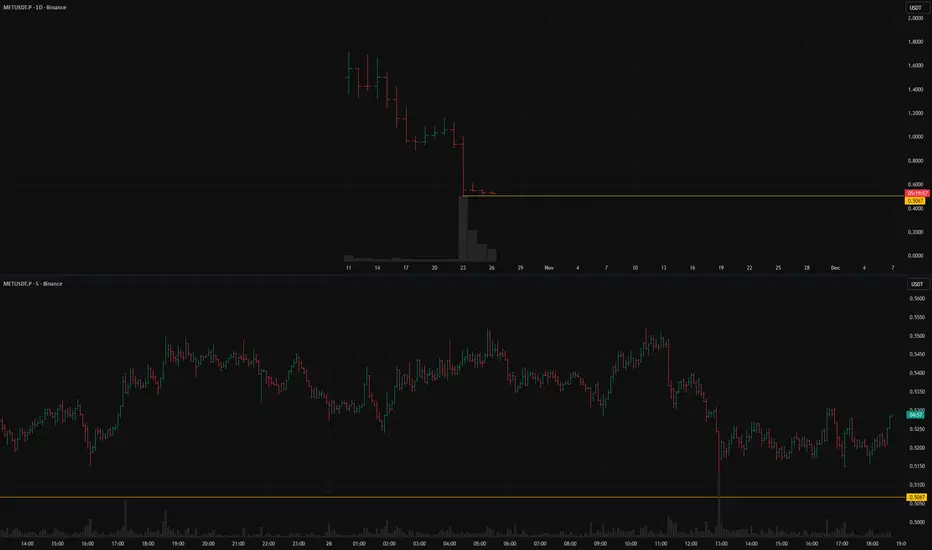
METUSDT: short setup from daily support at 0.5067BINANCE:METUSDT.P is consolidating near its lowest price point. Buyers show no attempt to absorb the decline, indicating weak demand. A continuation of the downward move is likely. The key reference level is 0.5067. Low volatility before the breakout remains an essential condition.
Key factors for this scenario:
Global & local trend alignment
Price void / low liquidity zone beyond level
Asset decoupled from the market
Volatility contraction on approach
Immediate retest
Prolonged consolidation
Consolidation with price compression (squeeze)
Closing near the level
No reaction after a false break
Was this analysis helpful? Leave your thoughts in the comments and follow to see more.
The key is whether it can rise above 4403.87
Hello, traders.
Follow us to get the latest information quickly.
Have a great day.
-------------------------------------
(ETHUSDT 1W chart)
The formation of an upward trend line (A) created an upward channel from (A) to (B).
Therefore, the key is whether it can continue to rise along this upward trend line.
If the upward movement fails, we need to check whether the price rises along the rising trend lines (1) and (2).
Therefore, the 3900.73-4107.80 range is a crucial area for sustaining the upward trend.
In this context, we expect a significant period of volatility to begin around the week of November 24th.
This period of volatility could continue until around the week of January 12th, 2026.
-
(1M Chart)
If this month closes with a bearish candle, forming an upward trend line (a), the key question is whether the price can rise along trend line (a).
If not, there's a possibility of touching the upward trend line (2), so we need to consider a response plan.
-
(1D Chart)
The key is whether the price can sustain above the uptrend line (1) and rise above 4403.87.
To do this, we need to see if it can break above the downward channel created on the 1D chart.
Therefore, we need to observe how the price moves after the volatility period around November 5th.
The HA-High ~ DOM(60) section (4393.04-4780.15) on the 1W chart overlaps with the HA-High ~ DOM(60) section (4403.87-4749.30) on the 1D chart, so it's likely to act as resistance.
------------------------------------
The basic trading strategy is to buy in the DOM(-60) ~ HA-Low section and sell in the HA-High ~ DOM(60) section.
However, if the price rises from the HA-High to DOM(60) range, a step-like uptrend is likely, while if it falls from the DOM(-60) to HA-Low range, a step-like downtrend is likely.
Therefore, a split trading strategy is recommended.
To maintain a step-like uptrend in the DOM(-60) to HA-Low range,
1. The StochRSI indicator must be rising. If possible, it should not enter the overbought zone.
2. The On-By-Value (OBV) indicator must be rising. If possible, it should remain above the High Line.
3. The TC (Trend Check) indicator must be rising. If possible, it should remain above the 0 level.
If the above conditions are met, the uptrend is likely to continue.
If not, a high point is likely to form, so you should consider a countermeasure.
-
Thank you for reading to the end.
I wish you successful trading.
--------------------------------------------------

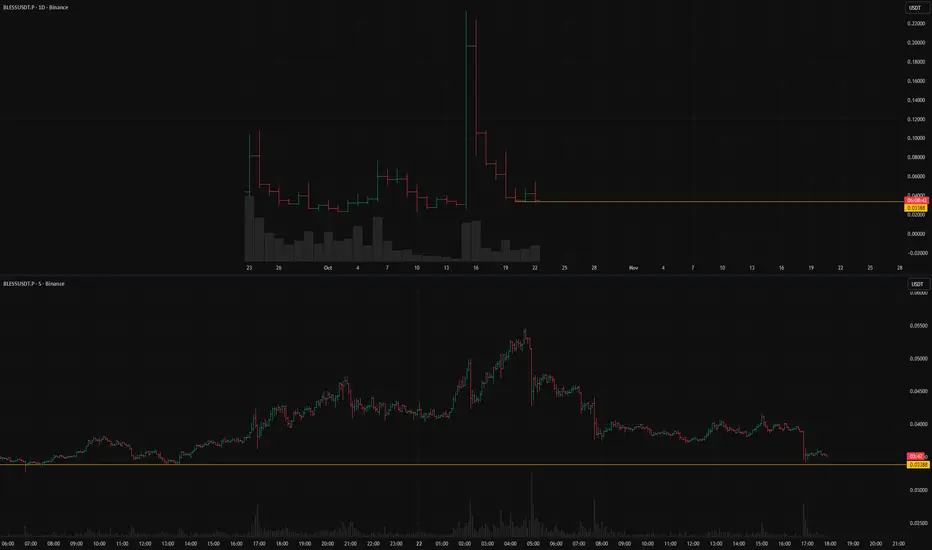
BLESSUSDT.Pshort setup from daily support at 0.03388BINANCE:BLESSUSDT.P is likely to continue moving within the short trend. The asset dropped sharply and stopped right before the key level, now remaining in a narrow consolidation range. The key factor here is the absence of a corrective rebound.
Key factors for this scenario:
Global & local trend alignment
Correlation with the market
Liquidity grab (false move against the trend)
Momentum stall at the level
Immediate retest
Factors that contradict this scenario:
Closing far from the level
Was this analysis helpful? Leave your thoughts in the comments and follow to see more.
5 Essentials of Trading Success
Trading is the greatest roller coaster you’ll ever ride.
Trading has its thrills, challenges, and endless potential for growth.
But, before you hit “Buy” or “Sell,” it’s crucial to lay down a solid foundation.
Too many traders jump in without preparation, and without knowing the real life variables.
When things go great, they feel normal and you feel in charge.
When things go bad, you feel it’s the end of the world.
So you need to learn to harness each of the 5 essentials to trading success.
Essential #1: Build a Solid Foundation of Knowledge
You wouldn’t drive a car without knowing the rules of the road, right?
Trading is no different.
Before placing your first trade, you’ll need to understand the key concepts and market basics that will serve as your roadmap.
Key areas to cover include:
Market types:
Know the difference between stocks, forex, commodities, and cryptocurrencies. Know which is the best stock screener. Also you need to know which markets will work for you and your trading personality.
Trading terminology:
Terms like “bearish,” “bullish,” “short-selling,” “leverage,” and “margin” might sound like jargon now, but they’ll soon become your everyday vocabulary.
Order types:
Limit orders, market orders, stop-loss, take-profit. Each of these orders serves a specific purpose. Mastering them is essential for making controlled and effective trades.
Essential #2: Select what you want to trade first: The Art of Asset Allocation
Trading is thrilling, but let’s face it.
No one knows what the market will do tomorrow.
That’s why choosing the right mix of assets—and learning the art of asset allocation—is crucial for long-term success.
What does asset allocation mean in practice?
Diversify your portfolio: Don’t put all your eggs in one basket. Invest and trade across different asset classes to spread out risk.
It’s better to trade different portfolios with stocks, Forex, indices and even commodities.
Successful trading isn’t about picking one “winning” asset.
It’s about managing risk and creating a balanced portfolio that can weather market storms.
Diversification is KEY!
Essential #3: Risk Management: Strategies to Protect Your Capital
If you only remember one thing from this article, let it be this:
Risk management is your best friend in trading.
Not only do you learn how to be a trader, but also a risk portfolio manager.
A smart trader doesn’t only think about potential gains—they think about how to protect their capital when things don’t go as planned.
Simple, powerful ways to manage risk include:
Set stop-loss orders: Automatically sell a position when it drops to a certain price to minimize losses.
Use position sizing: Avoid putting too much of your capital into a single trade. Limit each trade to a small percentage of your total funds—usually no more than 0.5%-2%.
Apply the “2% rule”: Never risk more than 2% of your capital on a single trade. This can help prevent one loss from wiping out your progress.
Remember, every trader has losses; it’s part of the game.
But with a solid risk management strategy, those losses won’t be catastrophic.
Essential #4: Charting the Path: Introduction to Technical Analysis
Charts are a trader’s treasure map. Learn to interpret them, and you’ll have insights into market trends, price movements, and potential buy/sell signals. Technical analysis allows traders to make data-driven decisions rather than relying on gut feelings.
Key tools for technical analysis:
Candlestick patterns: These can show trends, reversals, and market sentiment. Patterns like “doji,” “hammer,” and “engulfing” candles can offer powerful insights.
Indicators: Tools like moving averages, RSI (Relative Strength Index), and MACD (Moving Average Convergence Divergence) help you assess price momentum and potential reversal points.
As you might know by now. I like to stick to three indicators: Breakout patterns, 2 Moving Averages and Trend lines.
We need to learn to simplify our strategy because we will be following it over our entire trading career.
Trendlines: Drawn on charts, trendlines reveal price direction and potential breakout or breakdown levels.
Essential #5: The Psychology of Success: Developing a Trader’s Mindset
Trading isn’t just about strategies and technical skills; it’s also a mental game.
Emotions—fear, greed, EGO, frustration — can interfere with sound decision-making.
If you can’t manage your mind, you can’t manage your portfolio.
And that’s why it’s essential to develop a mechanical, professional and calm mind when trading.
Developing a disciplined mindset is what separates successful traders from those who burn out.
Conclusion
Let’s sum up the 5 ESSENTIALS to trading success.
Essential #1: Knowledge First: Understand trading terminology, market types, and order types.
Essential #2: Asset Allocation: Diversify your portfolio based on your risk profile.
Essential #3: Risk Management: Protect your capital with stop-losses, position sizing, and the 2% rule.
Essential #4: Technical Analysis: Learn chart patterns, indicators, and trendlines to guide decisions.
Essential #5: Trader’s Mindset: Control emotions, maintain discipline, and focus on long-term success.
Trading isn’t just a skill—it’s an adventure that rewards preparation, patience, and resilience.
Keep learning, stay focused, and remember: your success is built one trade at a time.
REVEALED: What REAL Trading isWhat is Financial Trading in a nutshell?
For the last 20 years I’ve summed up trading as just ONE BIG AUCTION.
It sounds like a fast-paced, high-risk, Wall Street movie scene with shouting brokers and skyrocketing graphs.
But, here’s the truth:
Trading is the most relaxing thing – when done right!
It’s a lifestyle, a process, and a mindset.
It’s one thing where YOU can take your finances on an exciting adventure — if you do it right.
Whether you’re a complete newbie or a seasoned trader, here is a refresher to dive into what trading really is.
Trading Is More Than Just an Auction of buying or selling…
Let’s clear up one thing first.
For the last 20 years I’ve summed up trading as just ONE BIG AUCTION.
And yes it is one big market of buying and selling – but that’s only part of it.
TRADING is all about solving a puzzle of analyzing probabilities, managing risks, and navigating uncertainty.
Every time you enter a trade (buy or sell), you’re making an educated guess on where the market is LIKELY to go next.
And you’re placing a bet on human behavior — how millions of people around the world (with their emotions, news reactions, and strategies) will affect the price of an asset.
That’s the technical side of trading. Here’s where I want you to integrate trading into your life…
Trading Is A Lifestyle
It’s not just about making money — it’s about integrating trading into your lifestyle.
You need to find the right markets, time, time frame, styles, strategy and approach.
Trading is like hitting the gym; it requires discipline, consistency, and a whole lot of sweat equity.
And just like you don’t get a six-pack or lose weight after ONE workout.
You shouldn’t expect to master trading overnight.
It’s a routine you build day by day.
A typical trading day might include:
Pre-market analysis (Weekly bias):
You need to check what’s happening in the world with other markets with both Asian, American, European and even London session.
You also need to look at the US Economic Calendar to see what news is arising for the week.
Analyse and Execute trades:
Once done the pre analysis, you need to do the actual analysis. See what trades are lining up according to your proven strategy. And if anything looks good to go EXECUTE.
Review and track your trades:
This is where you will reflect on what went right and what went wrong. This is where you’ll track and review your trades that lined up to add to your journal.
The key takeaway: Trading isn’t just what you do; it’s who you become.
Trading Is a Forever Game
When it comes to trading, think long-term.
Like, REALLY long-term. Because trading is a forever game.
Unlike sports with seasons or video games with levels, trading doesn’t end.
The markets will be there tomorrow, next week, and 100 years from now.
And as a trader, your mission is to stay in the game for the long haul.
That means managing your risk, protecting your capital, and always looking to improve your skills.
Trading Is A Business Where YOU Are The Boss
The beauty of trading?
You’re in control.
Trading is a business, and you are the CEO.
You call the shots, decide when to enter and exit trades, and ultimately, you take control of your financial destiny.
Like any business, trading requires:
Planning and strategy:
Risk and reward management:
Tracking performance and improving:
And, just like in any business, you’ll make mistakes.
But those mistakes are not failures; they’re lessons.
You learn from them, adapt, and get better. That’s what makes trading such an empowering journey.
Final Words:
Financial trading is more than a job, a hobby, or a side hustle.
It’s a process-driven approach to decision-making, a lifestyle to live, a forever game to play, and a business where you’re in charge.
If done right, trading can be one of the most rewarding pursuits you’ll ever undertake.
Key Takeaways
Trading is a process: Follow a set strategy, criteria, and rules for success.
Trading is a lifestyle: Incorporate trading into your daily routine and stick with it consistently.
Trading is a forever game: It’s not a one-time event; it’s a lifelong pursuit.
Trading is a business: You’re the CEO — plan your moves, manage your risk, and take charge of your financial destiny.

The Real 3 Thrills of Trading: (Hint: It’s Not When You Think)Trading.
It’s a game.
A challenge.
A journey.
It’s a lifestyle.
And yes having a passion to trade is half the battle won.
But it’s not just about winning.
If you feel thrill when you win a trade. Then you’re enjoying the wrong parts of successful trading.
If you’re in a winning streak and feel thrill – Same story.
Because you know the losses are inevitable.
And you know the drawdown is coming too.
So that’s why you need to enjoy the FULL journey…
And here’s where you should feel the THRILL for trading.
THRILL #1: When you survive the drawdown
Like I said earlier, your next drawdown is coming.
Your BIGGEST drawdown is coming.
So you need to embrace and prepare for these times.
I have gone through more drawdowns than you can imagine.
And yet my portfolio keeps heading to all time highs.
HOW?
Well you need to endure the drawdown.
You need to keep following your rules and strategy.
And when the market environment is more favourable, your portfolio will turn from down to up.
And it will continue to go up until you not only recover – but your portfolio breaks to all time highs.
And when you survive the drawdown – FEEL THRILL!
THRILL #2: Knowing your strategy works (through the good and bad)
The markets are like an ocean.
Waves come and go, the tide shifts, and sometimes there’s a storm.
If you go look at the US Economic Calendar you’ll know the market is about to swivel in ways you can’t even imagine!
The thrill doesn’t come from riding one good wave (winner).
It should come from taking every trade that lines up perfectly with the strategy.
If you followed your rule and criteria to a T – Feel THRILL that you are on the right path to success.
Regardless of whether the trade is a winner or a loser.
See the bigger picture and what it can do for you!
THRILL #3: The Love for the Game and the benefits of trading
Remember I said trading is more than just money.
Trading helps with everything in your life!
It teaches you to be a risk manager.
It teaches you how to toughen your mind.
It teaches you how to be disciplined, consistent.
And it teaches you how you can CREATE your own wealth without depending on a BOSS.
The Challenge, the Mental Toughness, and the Growth
And the thrill?
FINAL WORDS – Celebrate the Right Thrills
The thrill of trading isn’t about the quick wins, the big gains, or riding the market waves.
It’s about resilience. Mastery. Passion. Patience. And growth.
Well fall in love with what trading has offered and taught you, other than the money aspect.
It’s not just about making money; it’s about becoming better. Sharper. Wiser.
Every trade you take is a lesson.
Every loss is a learning opportunity.
And every time you wake up excited to face the market, that’s the thrill of passion.
Because trading isn’t just a job.
It’s a craft.
A skill.
A calling.
If you find yourself waking up early, excited to start your day, knowing full well there’s a challenge waiting for you—you’ve found the thrill.
If you find weekends are not ending early enough because you want to trade – that’s a thrill!
Let’s sum up some reasons to feel THRILL when trading.
THRILL #1: When you survive the drawdown
THRILL #2: Knowing your strategy works (through the good and bad)
THRILL #3: The Love for the Game and the benefits of trading
Do you agree and how has trading changed your life?
WHY Financial Markets Will Always ChangeChange is the only constant in the financial markets.
And that’s why it’s important to stay humble and grounded because everyday is a UNIQUE day to the markets and the pre market movers.
No matter how much experience you have, you can’t get too comfortable with the way things are.
Because we know they won’t stay that way for long.
The markets are like a living, breathing entity—constantly shifting, evolving, and transforming.
And now I want to explain why I believe the markets are ALWAYS changing.
REASON #1: The Fresh Faces of Trading
Continuous flow of new and old traders.
Every day, new traders enter the game while seasoned veterans continue to play.
This constant influx of fresh perspectives creates a dynamic market environment.
New traders bring innovative strategies, emotions, and decision-making processes into the market, while the veterans tweak their systems to keep up with ever-evolving trends.
And so the demand and supply is constantly shifting in new ways – which changes the markets style, moves and algorithms.
End of the day, the market is one big AUCTION as I have told my members for the last 15 years.
They’re influenced by the people who trade in them.
REASON #2: The Never-Ending Stream of New Information
New information – shining on the market
Here’s the thing: the financial markets thrive on information.
New data points, news reports, earnings releases, and economic indicators flow in non-stop, impacting prices and trends at every turn.
Sometimes there is good days with amazing news coming out.
Other days there is catastrophic news.
And then you get the mundane boring days with no reaction.
If a central bank announces an unexpected interest rate cut, or if a company releases disappointing earnings, the market is going to react swiftly.
Even geopolitical events and natural disasters play their part in shaping the direction of markets.
So no matter how much analysis you’ve done, be prepared for the fact that new info can change the game in an instant.
REASON #3: Micro, Macro, and Inner Fundamentals
New micro, macro and inner fundamentals
The fundamentals that underpin market movements are far from static.
On the micro level, individual companies are constantly evolving.
New product launches
Mergers and acquisitions
News and earning reports
Prospects
Leadership changes can all affect a stock’s price.
Zoom out a little, and you’ve got macro fundamentals.
These show the big-picture factors like:
Interest rates
inflation, and
unemployment rates,
All of which influence the broader economy.
REASON #4: Global Economies and World Events
World info from the economies
The financial markets are more interconnected than ever.
What happens in one part of the world now ripples through the rest of the global economy in minutes, not weeks.
A change in China’s trade policy can directly impact European markets.
An unexpected election result in America could influence the South African or UK equities.
REASON #5: The Endless Actions of Traders
Constant actions of traders around the world
Then, of course, we have the daily actions of traders around the world.
Every time a buy or sell order is placed, the market shifts.
I like to think of it as the Stock Market’s Butterfly-Effect.
These actions are a direct result of human behavior—our emotions, analysis, strategies, and even fear and greed.
When traders believe in a trend, they pile on, creating momentum.
But when panic strikes, markets can spiral down in a blink of an eye.
Since traders are constantly reacting to new information, the market flows like an ever-shifting river.
Conclusion
The financial markets are in a constant state of flux.
They will forever change and we need to learn how to evolve, adapt or die trying.
But there is one thing that is inevitable.
The markets will KEEP moving and trending. And for that, we will always be profiting in the medium to long term.
Let’s sum up why the markets will always change…
REASON #1: The Fresh Faces of Trading
Continuous flow of new and old traders.
REASON #2: The Never-Ending Stream of New Information
New information – shining on the market
REASON #3: Micro, Macro, and Inner Fundamentals
New micro, macro and inner fundamentals
REASON #4: Global Economies and World Events
World info from the economies
REASON #5: The Endless Actions of Traders
Constant actions of traders around the world

POWERFUL Quote about TradingHere is a quote I want you to write down and hold close to your heart.
Trading is a Game of Focus, Sheer Will, and Unstoppable Determination
Trading is not for the faint-hearted.
It’s a game of focus, sheer will, and the kind of determination that doesn’t back down when the market throws punches.
If you’ve been in the trading world long enough, you know it’s not about making a quick buck.
It’s about holding your ground when the waves get rough and staying in the game even when the winds are blowing against you.
Let’s break this down…
Focus Is Your Superpower
To succeed, you need to zero in on your strategy and trust the process, no matter how loud the noise around you gets.
Focus is what separates a good trader from a great one.
It’s about staying laser-focused on your plan.
Do not get rattled when the market throws a curveball.
If you’re jumping from one strategy to another or chasing every shiny new stock, you’re spreading your energy too thin.
And in trading, scattered focus equals scattered results.
How to Strengthen Your Focus:
Create a daily routine and stick to it. Consistency fuels discipline.
Set specific trading goals for each session.
Block out distractions. Social media can wait.
Review your trades regularly to keep your mind sharp.
Sheer Will Gets You Through the Tough Times
Let’s not sugarcoat it:
There will be rough patches.
Trading will test you.
Your willpower will be stretched like a rubber band, and sometimes it might snap.
But those who make it are the ones who refuse to quit.
There’s a misconception that the best traders are the ones who never lose. Wrong.
The best traders are the ones who keep getting back up.
You will lose trades.
It’s part of the game.
But if you have the will to persist, those losses become your greatest teachers.
Ways to Build Your Willpower:
Start small. Set short-term, achievable goals to build momentum.
Learn from each mistake. Losses are part of the learning curve.
Celebrate your progress, even if it’s slow.
Stay connected with other traders to keep motivated.
Determination is Your Guiding Force
What makes a trader stick to their plan even when everything seems to be going wrong?
Determination.
It’s that relentless drive to keep going no matter what.
It’s about having a clear vision of where you’re headed and refusing to let setbacks derail you.
Determination means playing the long game.
It’s easy to get discouraged after a few losses or slow weeks, but successful traders know that big wins take time.
You’ve got to be in it for the long haul.
Strengthening Your Determination:
Write down your trading goals and review them daily.
Make sure you have checked the US Economic calendar with your trading strat.
Remind yourself of why you started trading in the first place.
Don’t let a losing streak shake your confidence—adjust, don’t abandon.
Stay flexible but committed to your strategy.
Conclusion: Keep Grinding, Keep Growing
Trading is a game of focus, sheer will, and relentless determination.
It’s not easy, but if you can master these qualities, you’ll find yourself ahead of the pack.
Success in trading doesn’t come from luck or overnight gains.
It comes from grinding it out, day after day, with a sharp mind and an unbreakable spirit.
Remember, the markets will test you.
They’ll try to break your focus, test your will, and challenge your determination.
But if you stay committed, keep your focus razor-sharp, and push through the tough times, you’ll come out stronger, smarter, and more successful.
So, what are you waiting for?
Tighten up your focus, flex that willpower, and get ready to tackle the markets with unstoppable determination.

See if it can rise above 110644.40-111696.21
Hello, fellow traders!
Please "Follow" to always get the latest information quickly.
Have a great day.
-------------------------------------
(BTCUSDT 1W Chart)
Support levels for maintaining an uptrend are:
1st: 104463.99-108353.0
2nd: 87814.27-93570.28
Support must be found within the first and second levels above.
To rise above the right Fibonacci ratio of 2.618 (133889.92), which is my target level, the price must rise above the uptrend line (1) and maintain its position.
In other words, the price must rise above the HA-High indicator level of 116259.91 on the 1W chart and maintain its position.
-
(1D Chart)
The key is whether the price can find support near 10443.99-108353.0 and rise above the 110644.40-111696.21 range.
If the price fails to rise, it is highly likely to fall further, so we need to consider countermeasures.
Since the M-Signal indicator on the 1W and 1D charts is passing near the 110644.40-111696.21 range, I believe the trend will likely be determined by the presence of support.
The HA-High ~ DOM(60) range on the 1W chart is formed within the 116,259.91-119,086.64 range, while the HA-High ~ DOM(60) range on the 1D chart is formed within the 120,760.81-124,658.54 range.
Therefore, the 116,259.91-124,658.54 range is likely to act as resistance.
Therefore, I believe a surge in capital is needed to break above this range.
-
Therefore, I believe BTC dominance should rise while USDT dominance should decline.
If BTC dominance rises, most altcoins are likely to move sideways or decline, so altcoin trading requires a strategy to counter this.
BTC dominance is likely to rise to around 61.73,
USDT dominance is expected to fall below 4.55 and break above the resistance level.
-
If both BTC and USDT dominance decline simultaneously, an altcoin bull market could begin.
However, BTC dominance must decline below 55.01, and USDT dominance must also decline below 4.91.
The next period of volatility is expected to occur around October 25th (October 24th-26th).
-
Thank you for reading.
We wish you successful trading.
--------------------------------------------------
- This is an explanation of the big picture.
(3-year bull market, 1-year bear market pattern)
I will explain in more detail when the bear market begins.
------------------------------------------------------
