Check for support near 4302.41-4372.72
Hello, traders!
Follow us to get the latest updates quickly.
Have a great day!
-------------------------------------
(BTC.D 1M chart)
For an altcoin bull market to begin, the price must either fall below 55.01 and hold or continue its downward trend.
(USDT.D 1M chart)
I believe that USDT dominance must remain below 4.91 or continue its downward trend for the coin market to continue its upward trend.
The maximum decline in 2025 is expected to be around 2.84-3.42.
After that, the coin market is expected to enter a bear market with an upward trend.
------------------------------------
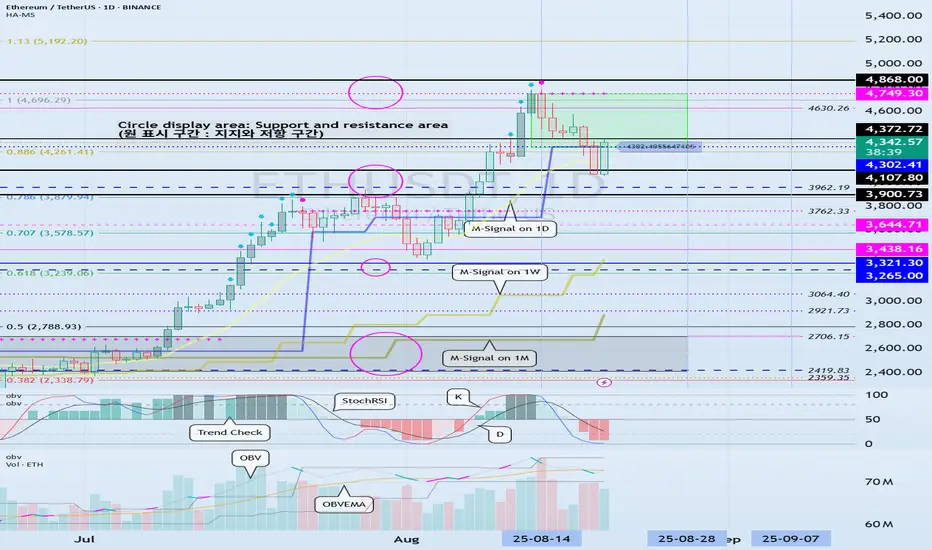
(ETHUSDT 1D chart)
It touched the previous all-time high (ATH) range of 3900.73-4107.80 and is showing an upward trend above 4302.41.
Therefore, we need to check whether it can find support around 4302.41-4372.72.
To continue the step-up trend, it's expected to rise above 4749.30.
-
When a new candlestick is formed, a low trend line is expected to form, consolidating the trend line as shown below.
Therefore, the key question is whether the price can rise along the rising channel after the volatility period around August 28 (August 27-29).
-
The 4302.41-4749.30 range represents a high-boundary zone, requiring a short and quick response when trading.
Therefore, if the price finds support near 4302.41 and rises, it would be wise to develop a trading strategy based on the assumption that the first sell-off will occur around 4749.30.
For the uptrend to continue, rising above 4749.30,
- the StochRSI indicator must remain upward with K > D,
- the OBV must rise above the High Line and remain upward,
- the TC (Trend Check) indicator must remain upward. (Preferably, it should show an upward trend above 0.)
If the above conditions are met, I believe the uptrend is likely to continue.
-
If the price falls below 4302.41,
1st: 3900.73-4107.80
2nd: M-Signal on the 1W chart
We need to check for support near the 1st and 2nd levels above.
-
The basic trading strategy is to buy in the HA-Low ~ DOM (-60) range and sell in the HA-High ~ DOM (60) range.
However, if the price rises from the HA-High to DOM(60) range, it is likely to exhibit a step-like upward trend, while if it falls from the HA-Low to DOM(-60) range, it is likely to exhibit a step-like downward trend.
Therefore, the basic trading strategy should be a segmented trading strategy.
If you purchase a new position because the price appears to be supporting the HA-High to DOM(60) range, you should execute the trade quickly and with short-term responses.
Otherwise, if the price falls below the HA-High indicator, it is likely to decline until it meets the HA-Low or DOM(-60) indicator.
-
Thank you for reading to the end.
I wish you successful trading.
--------------------------------------------------
- This is an explanation of the big picture.
(3-year bull market, 1-year bear market pattern)
I will explain in more detail when the bear market begins.
------------------------------------------------------
Tradingstrategy
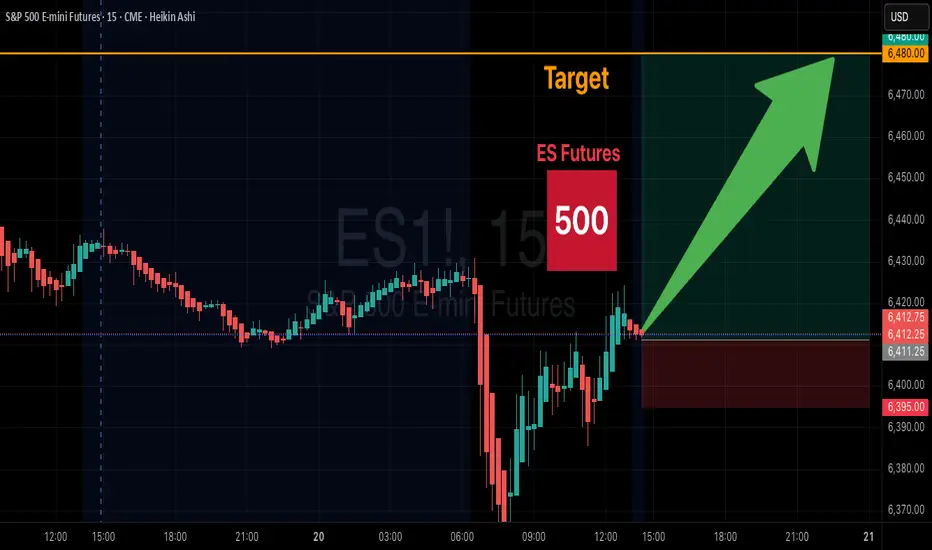
ES Futures Trade Setup – Long Opportunity
🎯 **ES Futures Trade Setup – Long Opportunity**
📌 **Instrument:** ES
📈 **Direction:** LONG
💰 **Entry Price:** 6415.50
🛑 **Stop Loss:** 6353.98 (1 ATR below entry)
🏹 **Take Profit:** 6480.00 (\~64.5 points)
📏 **Position Size:** 3 contracts
💪 **Confidence:** 65%
⏰ **Timing:** Enter at market open
⚠️ **Key Risks:** Mixed short-term signals may cause volatility. Move below 6400 could invalidate trade.
✅ **Rationale:** Long-term bullish trend remains intact; favorable risk-reward despite short-term bearish momentum.
is BTC going TOP again? Road To 138,000?~ In this trading idea, here is showed how well and nice this wave works.
In first example we got nice uptrend so I'm expecting that we will see something similar in a few days!
~ My prediction is to be ready strong uptrend again.
Like this idea if you see it's useful.
Make comment about your opinions too. <3
Nika. :)

Gold – US Session Trend UpdateGold – US Session Trend Update
During today’s US session, gold once again rejected selling pressure around the 3326 zone. This is the third time price has bounced from this level, and once again it quickly recovered, gaining more than 10 dollars after failing to confirm a bearish continuation.
From a trendline perspective, the price is consolidating within a narrowing channel. This typically signals that a stronger move is approaching once the market breaks out of the channel. While a breakout may not happen immediately today, this setup provides a clear framework for entering trades once confirmation comes, regardless of timing.
The key resistance to watch sits at 3345. A strong H1 close above this level would confirm renewed bullish momentum and open the way for further upside. On the other hand, if 3326 is broken decisively, especially after holding three times, the market could see a sharp downward continuation in line with Dow Theory.
At the moment, traders may consider short-term opportunities within the 3326–3345 range, particularly on lower intraday timeframes like M5, to capture quick profits. Once price breaks decisively out of the channel, swing entries in the direction of the breakout become more favourable.
Successful setups often come from patience. Waiting for the market to confirm direction before committing to larger positions will always provide better odds in the long run.
#XAUUSD #Gold #TechnicalAnalysis #PriceAction #Trendline #Forex #UKTrading #SwingTrading #Scalping

Why You Need LASER Focus When You Trade – 4 ReasonsTrading is not just crunching numbers.
It’s also about precision, timing, and strategy.
You need to be a perfectionist when you trade.
Because every action you take will determine where you get in and out.
Every action will determine what possible amount you can lose and what you can win.
Every action will determine whether you will add it to your track record or now.
So, I’m going to help you to develop laser focus when you trade.
NO LASER FOCUS AND
You Might MISS a GREAT Probability Trading SETUP
Picture this…
You’ve been tracking a market for days.
The setup you’ve been waiting for finally emerges.
But you’re distracted. From your job, from an email, from the family, from your mindset or even a social media notification.
Or you have missed an important economic news calender event.
And by the time you refocus, the opportunity has slipped through your fingers.
Trading needs your undivided attention.
Each setup is like a rare gem, and you need to be sharp-eyed to spot it.
Missing out isn’t just about lost potential profit; it’s about missing the chance to execute your well-crafted strategy.
NO LASER FOCUS AND
You Might Type in the WRONG Trading Levels
You have your setup, charts and trading platform all ready.
You’ve analyzed everything perfectly, and have your levels.
But one moment of distraction and you might type in an extra 0 or type in the wrong number.
This can lead to larger losses or even not being able to enter your trade.
Here’s an idea.
Pretend that the trade you are taking is NOT for you but rather for a big client with millions that you need to execute.
Now you will feel more obliged to execute correctly and with laser focus right?
Precision is key.
NO LASER FOCUS AND
You Might Type in the WRONG Volume
Volume is crucial.
It’s the engine behind your trades.
It’s the amount that will determine your potential gain or loss.
If you get in with the wrong volume, it could disrupt your entire plan.
You smirk, but it’s more common than you think.
You need to look at the MINIMUM contract you can trade.
You need to work out the position size with the Position Size Calculator.
Incorrect volumes can inflate risks and distort your position size.
You can’t afford to risk more than you can financially and emotionally handle.
Be more accurate with your position sizing and your portfolio will thank you.
NO LASER FOCUS AND
You Might MISS Adjusting Profit or Stop Loss Levels
It’s common to get into a trade because the market is running away.
But then, you might forgot to put in your stop loss and take profit levels.
This can be dangerous!
Especially if you hold overnight and you aren’t awake to monitor and protect your position.
Especially, when the market gaps and you have no choice but to close your trade.
Profit and stop loss levels are like the safety net and trampoline of your trading strategy.
Keep a close eye on your trades and levels please.
Final words.
Laser focus in trading is CRUCIAL.
You are the boss of your own portfolio, financial situation and strategy.
So act like the boss with precision, accuracy and laser focus.
Let’s sum up why you need to have Laser Focus…
NO LASER FOCUS AND
~ You Might MISS a GREAT Probability Trading SETUP
~ You Might Type in the WRONG Trading Levels
~ You Might Type in the WRONG Volume
~ You Might MISS Adjusting Profit or Stop Loss Levels

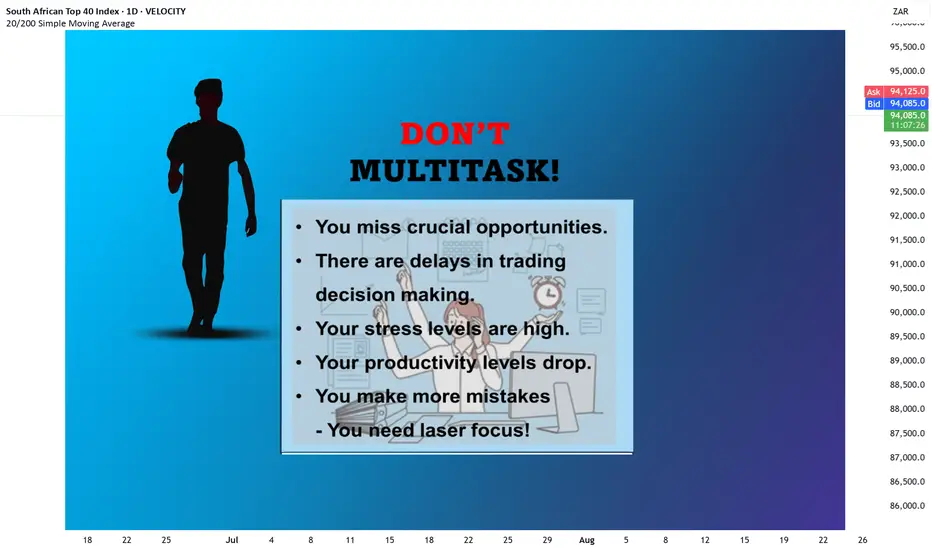
Why You Must NOT Multi-Task When Trading – 4 ReasonsWhy You Must NOT Multi-Task When Trading
We are taught to multi-task through life.
To be a jack of all trades.
With trading, it’s a golden rule to NOT multi task.
Your focus diminishes.
Your productivity slows down.
And your confusion goes up.
So we need to instead focus on ONE thing at a time.
Here’s why…
🔍 #1: You Miss Crucial Opportunities
Picture this: you’re juggling several tasks at once.
You’re looking at hundreds of markets.
You’re monitoring all the news events.
Your charts look like a Christmas treed.
You’re looking at social media and emails.
And then what happens?
You miss the important trade line ups.
A slight delay in executing a trade can mean the difference between a profit and a loss.
You see, when you multi-task – your attention is divided.
And great opportunities can slip right through your fingers.
Stay focused. Stay vigilant. That one trade might be your ticket to your next winning streak.
⏱️#2: There Are Delays in Trading Decision Making
Speed is of the essence in trading.
The markets move fast, and so should you.
But when you’re multi-tasking, your decision-making process slows down.
You find yourself second-guessing every move, doubting your strategies, and hesitating just when you need to act.
This delay can be costly.
A missed opportunity, a wrong move, or a delayed reaction can lead to nothing happening when it should.
😵💫 #3: Your Stress Levels Are High
Trading alone is stressful.
The constant flux of the market, the pressure to make the right decisions, and the potential financial stakes are enough to keep anyone on edge.
Now, add multi-tasking to the mix, and you’re looking at a recipe for burnout.
Your brain is not wired to handle multiple complex tasks simultaneously.
This overload increases your stress levels, affecting your mental clarity and emotional stability.
Lower your stress and focus on one task at a time.
Your mind will thank you, and your trading performance will improve.
🎯 #4: You Make More Mistakes – You Need Laser Focus!
I’ve professed the idea of LASER your trades.
Look, Analyse, Setup, Execute and Record.
Focus on one part of your trading at a time and you’ll see better performance.
✅ Summary of Key Points:
#1: You Miss Crucial Opportunities
#2: There Are Delays in Trading Decision Making
#3: Your Stress Levels Are High
#4: You Make More Mistakes – You Need Laser Focus!
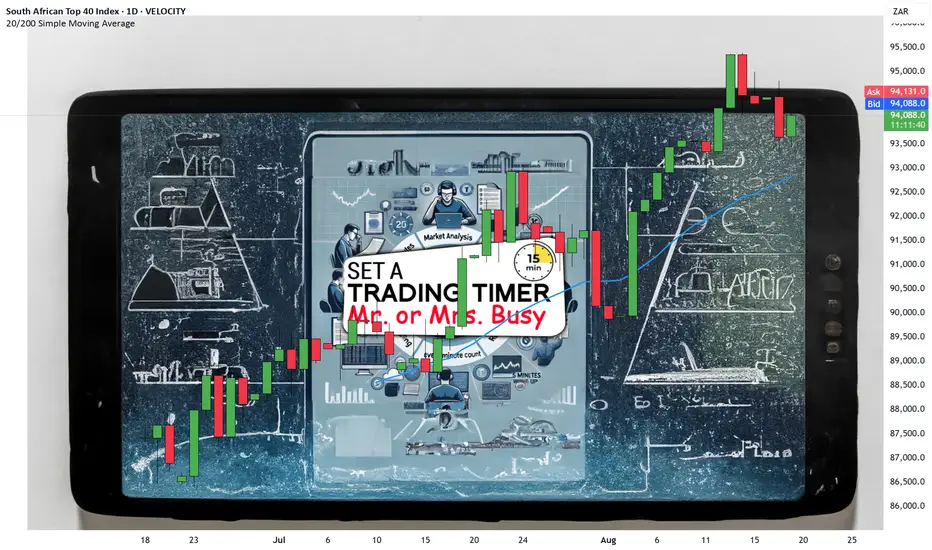
Set a Trading TIMER – Mr or Mrs Busy!Hey, Mr. or Mrs. busy!
I get it. Finding time to trade in this busy life, is tough.
But as I like to say.
If you have time to have coffee, go to the bathroom or binge Netflix – you have time to build your financial career.
However, if you find it difficult to be disciplined with your trading.
Thern I have a simple trick for you.
🕒SET A TIMER!
Yes, you read it right. Set a TIMER!
If you’ve got just 15 minutes or up to one hour, make it count.
Let’s dive into how you can master the timer when you trade.
💡REASON #1: Remember Parkinson’s Law
Ever heard of Parkinson’s Law?
It states that work expands to fill the time available for its completion.
In simpler terms, if you give yourself all day to analyze trades, you’ll take all day.
But if you limit yourself to an hour, you’ll focus and give all the attention in just one hour.
You’ll be surprised how much you can achieve.
You see, when you set a timer – it creates a sense of urgency. And it helps ensure you stay on task and get the job done.
🎯REASON #2: The Power of Focused Trading
When the timer is ticking, distractions don’t stand a chance.
You’ll notice your brain kicks into high gear, almost with adrenaline.
And you’ll be able to prioritise the tasks and filter out the noise.
This focused trading approach will help you make quick, effective decisions.
That’s the power of a ticking clock.
📝HOW TO Craft Your Perfect 15 Minutes Trading Plan
Alright, let’s break it down.
How should you structure this golden hour of trading?
5 Minutes: Market Analysis – Start by analyzing the market.
Choose the one watch list and go through it attentively.
5 Minutes: Strategy line-up – Prepare your trades
This is where you’ll go through your watch list again – but set up your potential trades lining up according to your strategy.
This is where you’ll jot down your levels (Entry, Stop loss and take profit).
Maybe you’ll write down some notes on why it lined up and whether it’s a high or medium probability trade.
5 Minutes: Execution – Just take the trades
Now if three or four trades have lined up.
Calculate your position sizes and execute your trades that line up perfectly to the strategy.
That’s it…
Now obviously, if you’re following a trading mentor’s style, trades etc… You’ll need less time.
But you’ll need a strategy to follow whenever a trading idea comes out including:
Having your trading platform opened on your devices
Having your position sizes calculated already according to what your portfolio is
Knowing when to expect trades by going to the charts and preparing for the day as you’ll have an idea on what your mentor is showing you.
🏋️NEXT: Staying Disciplined with Your Trading Timer
The hardest part?
Sticking to the timer.
When it says start, you start.
When it says stop, you stop.
If you need more time than 15 minutes – then CHOOSE the time that works best.
This habit builds consistency and prevents burnout.
It’s tempting to extend your trading time, especially when you’re in the zone.
But discipline is key.
At the start you might need the timer for the first few weeks. But then the motivation turns into discipline.
And when the discipline turns into integration – you’ll be able to trade without the timer and without any effort.
🚀 It’s more than just a trading timer
Setting a timer doesn’t just help with trading.
It helps you with other areas of life.
You’ll find yourself more organized, efficient, and in control.
Whether it’s a work project or a personal task, this technique can transform your productivity.
Plus, it teaches you to value your time—a priceless lesson in today’s fast-paced world.
🏆FINAL WORDS: Make Every Minute Count
So, next time you’re about to trade, set that trading timer.
Think of FED – Focus, efficiency, and discipline are your new best friends.
Let’s sum up what we covered today.
SET A TIMER!
REASON #1: Remember Parkinson’s Law
REASON #2: The Power of Focused Trading
HOW TO Craft Your Perfect 15 Minutes Trading Plan
NEXT: Staying Disciplined with Your Trading Timer
It’s more than just a trading timer
The Complete Guide to Stop Trading Procrastination – 8 Actions👋 Hey
Ever found yourself staring at your trading platform?
Your finger can either be 1 mm away from the buy button…
Or feel like it’s the distance of the Great Wall of China.
And you’re still not pressing it.
🎉 Welcome to the Procrastinator’s Club!
Don’t worry—you’re not alone.
Many traders struggle with procrastination.
The good news? It’s totally beatable.
Let’s dive into why we procrastinate and, more importantly, how to crush it and become the trader you’ve always wanted to be.
❓ Why Do We Procrastinate?
🤔 Doubt Your Trades?
Doubt is a confidence killer.
You’re doubting yourself.
Your system.
The markets.
Even trading as a whole.
This leads to hesitation… and missed opportunities.
🗓️ Skip a Trading Day?
Skipping even one trading day can cost you.
Markets don’t wait.
If you’re not in the game—you can’t score.
Even checking from your phone could make all the difference!
📉 Don’t Monitor Your Results?
If you’re not tracking, you’re guessing.
Are you improving?
Is the market environment helping or hurting you?
Without tracking, you’re flying blind.
💥 6 Ways to Beat Trading Procrastination
✅ #1: Choose Your Trading Days
Pick 3–4 specific days to focus on trading.
Avoid unfavourable times (like low volatility Mondays or dead hours in Gold).
Structure = consistency = confidence.
📋 #2: Set Smaller Tasks
Break your workload into bite-size pieces.
One day: analyse EUR/USD.
Next day: track performance.
Next day: update journal.
Small wins add up!
📊 #3: Track Results on a Specific Day
Pick a review day weekly.
Don’t obsess daily.
Your portfolio’s like your weight—it’ll fluctuate!
Track over time, not minute-by-minute
⏱️ #4: Set a Timer
Got 1 hour? Or just 15 minutes?
Set a timer, remove distractions, and lock in.
Even a focused short session can yield powerful results.
🧠 #5: Self-Talk
Talk yourself into trading—not out of it.
“I’ve got this.”
“I know my system.”
“I’m the boss.”
Say it. Mean it. Do it.
🎁 #6: Reward Yourself
Win or lose—if you followed your strategy, celebrate.
A treat.
A break.
Something fun.
This builds discipline + motivation.
🏁 Final Words
Procrastination is a habit.
But so is discipline.
You now have a toolkit.
So…
When are you taking action?
Tomorrow? That’s procrastination.
Today? That’s progress.
Start small. Just start.
🔥 How to Stop Procrastinating:
Remove distractions
Positive self-talk
Reward yourself
👉 Your future trader-self is already thanking you.
A rise above 3.725 could start a new bullish wave
Hello, fellow traders!
Follow me to get the latest information quickly.
Have a great day.
-------------------------------------
The original TON coin (token) failed, and this is the TON coin that was acquired and rebuilt.
Therefore, there are currently two TON coins, so it's recommended to verify them before trading.
This TON coin was acquired and rebuilt by Coinbase Ventures.
-
(TONUSDT 1D chart)
If the price holds above 3.725, there's a possibility of an upward trend as it breaks above the 4.059-4.668 range.
Therefore, the key question is whether it can find support at 3.440-3.725 and continue upward.
If not,
1st: 3.161
2nd: 2.641-2.900
Check for support near the 1st and 2nd levels above.
If possible, it's best to confirm that the price holds above the M-Signal indicator on the 1W chart before entering a trade.
-
(1W chart)
If the price rises above 3.725, there's a possibility of a sharp rise as there are no support or resistance levels.
Currently, the volume profile is forming in the 5.770-6.391 range, so there's a possibility that it will rise to that level.
-
Thank you for reading.
I wish you successful trading.
--------------------------------------------------
- Here's an explanation of the big picture.
(3-year bull market, 1-year bear market pattern)
I'll explain more in detail when the bear market begins.
------------------------------------------------------

Important range: 10.626-12.130
Hello, traders!
Follow us to get the latest information quickly.
Have a great day!
-------------------------------------
Uniswap (UNI) is used on DEX exchanges.
This makes it connected to many ecosystems.
However, it's worth considering whether this coin (token) is worth holding in the medium to long term.
This is because if the DEX exchange fails to activate and fails, it could disappear completely.
Therefore, to trade this coin (token), I recommend holding it by gradually increasing the amount of coins (tokens) that represent profits.
-
(UNIUSDT 1M chart)
The key is whether it can break above the formed channel.
-
(1W chart)
The key is whether it can find support around 10.626 and rise above 14.233-17.073.
If it declines below 10.626, it should check for support around 5.448-6.940.
Therefore, if it falls below the M-Signal indicator on the 1M chart, trading should be halted and the situation should be assessed.
-
(1D Chart)
The key is whether the price can maintain support above 14.233, with support found around 10.626-12.130.
If the price fails to rise, we should check for support around 9.080.
If not, a decline to 6.940 is possible.
Since a short-term upward channel has formed, we should examine whether the price can rise along this channel.
--------------------------------------------------
Increasing the number of coins (tokens) for profit involves selling the original purchase price (+ transaction fees) to retain the coins (tokens) corresponding to the profit.
This increases the number of coins (tokens) with an average purchase price of 0, making it possible to hold them for the medium to long term.
This strategy is more effective in a downtrend than in an uptrend.
-
Thank you for reading to the end.
I wish you successful trading.
--------------------------------------------------
- Here's an explanation of the big picture.
(3-year bull market, 1-year bear market pattern)
I'll explain more in detail when the bear market begins.
------------------------------------------------------

Check if it finds support around 23.98-25.17 and rises
Hello, fellow traders!
Follow us to get the latest information quickly.
Have a great day.
-------------------------------------
Chainlink is one of the coins connected to many ecosystems.
Therefore, I believe it's worth holding for the medium to long term.
(LINKUSDT 1M chart)
The key is whether the price can find support around 23.98-25.17 and rise along the uptrend line.
If not, caution is advised as it may touch the lower uptrend line.
-
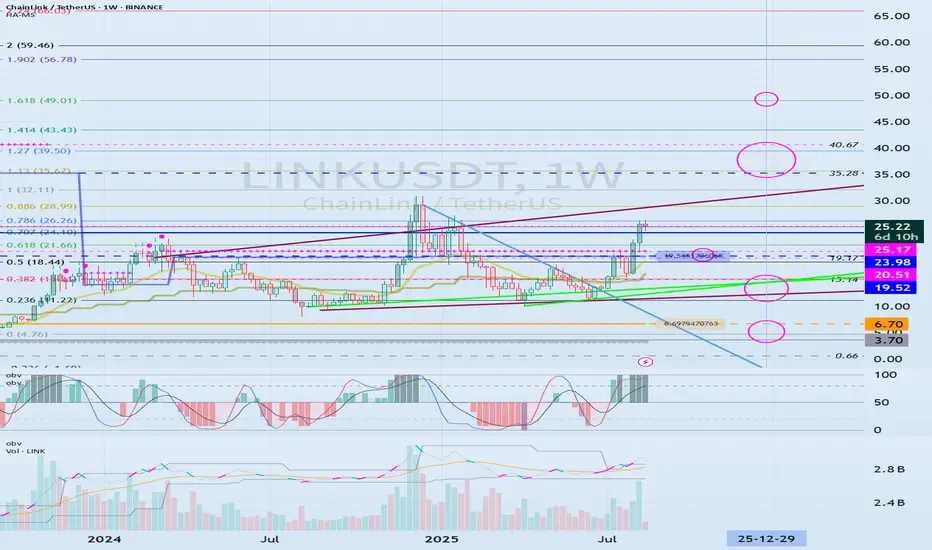
(1W chart)
If the price finds support around 23.98-25.17 and rises,
1st: 35.28-40.67
2nd: Fibonacci ratio 1.618 (49.01)
It is expected to rise to the 1st and 2nd levels above.
After that, a bearish turn appears likely.
Based on the current price, if it falls below the 19.52-20.51 range, it is recommended to stop trading and wait and see how the situation develops.
-
(1D chart)
Ultimately, the key is whether the price can break above the uptrend line (1).
If not, you should check for support within the circled area marked on the chart.
However, if the price falls below the M-Signal indicator on the 1M chart, you should stop trading and wait and see how things turn out.
-
Thank you for reading.
I wish you successful trading.
--------------------------------------------------
- This is an explanation of the big picture.
(3-year bull market, 1-year bear market pattern)
I will explain in more detail when the bear market begins.
------------------------------------------------------
See if it finds support near 0.21409 and can rise
Hello, fellow traders!
Follow me to get the latest information quickly.
Have a great day.
-------------------------------------
(DOGEUSDT 1M Chart)
I'm not sure if I should hold DOGE for the medium to long term.
However, if you plan to hold the coin for the medium to long term, I recommend increasing the number of coins (tokens) that represent profit.
The 0.21409-0.31600 range is an important high point boundary.
If this area supports the price and the price rises, a stepwise upward trend is likely.
To do so, we need to observe whether the price rises along the existing rising channel.
If the price falls below the downtrend line (1), we should stop trading and wait and see how things unfold.
-
(1W Chart)
A new channel has formed by breaking away from the downtrend line (2).
Therefore, the key question is whether the price can rise along this channel and rise above 0.37778.
If possible, I recommend finding support near 0.21409.
-
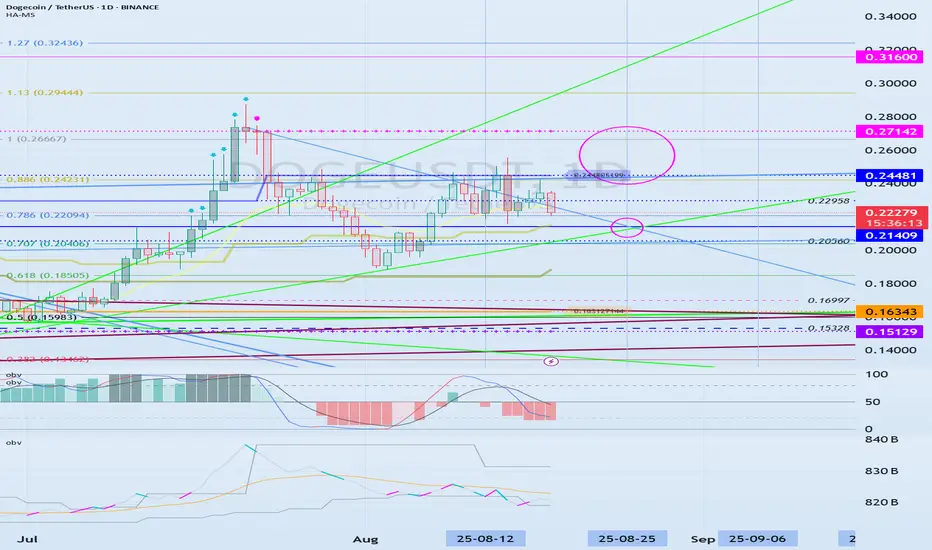
(1D Chart)
To form a channel, the key is to find support near 0.21409 and maintain the price above 0.24481.
To continue the stepwise uptrend, the price is expected to rise above 0.24481-0.27142.
If it falls below 0.21409, it is expected to meet the M-Signal indicator on the 1M chart and re-establish the trend.
The support level is 0.15129-0.16343.
-
Thank you for reading.
I wish you successful trading.
--------------------------------------------------
- This is an explanation of the big picture.
(3-year bull market, 1-year bear market pattern)
I will explain in more detail when the bear market begins.
------------------------------------------------------
See if the price can hold above 0.8289-0.8836
Hello, fellow traders!
Follow us to get the latest information quickly.
Have a great day.
-------------------------------------
(ADAUSDT 1D chart)
From a trend perspective, the key is whether the price can hold by breaking above the first and second trend lines.
If the upward movement fails, we should check for support around 0.8289-0.8836.
Therefore, we should check whether the price remains above 0.8289-0.8836 after August 31st, which is ADA's volatile period.
-
(1W chart)
To continue the cascading upward trend, the price must rise above 1.1936-1.3678 and remain there.
If it surges, it could rise to around 2.1150.
Since the volatile period on the 1W chart occurred around the week of November 10th, a downtrend is likely thereafter.
This is because a major bear market is expected to begin in 2026.
Therefore, if the HA-High indicator falls below 0.8836, you should stop trading and assess the situation.
-
Thank you for reading to the end.
I wish you successful trading.
--------------------------------------------------
- Here's an explanation of the big picture.
(3-year bull market, 1-year bear market pattern)
I will explain more in detail when the bear market begins.
------------------------------------------------------

The key is whether it can rise above 3.086
Hello, fellow traders.
Follow us to get the latest information quickly.
Have a great day.
-------------------------------------
(CAKEUSDT 1W chart)
For the uptrend to begin, the price must rise above 5.750 and hold.
-
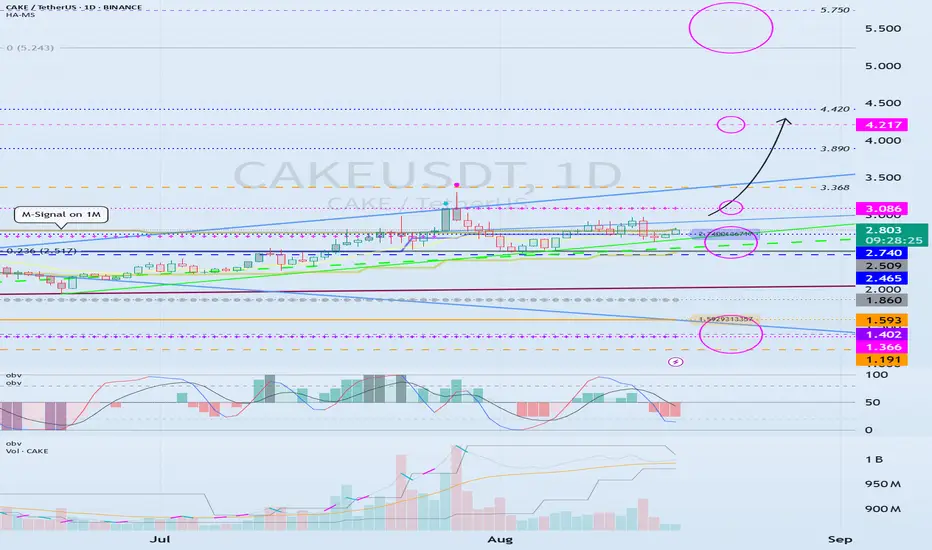
(1D Chart)
The key is whether the price can maintain support around 2.465-2.740 and rise above 3.086.
If the price holds above 3.086, a stepwise upward trend is highly likely.
At this point, the key point to watch is whether it can rise above 4.217.
If it finds support around 2.465-2.740 and rises, a medium- to long-term uptrend is likely, so you can develop a trading strategy based on this.
-
If it falls below 2.465, it could fall below 1.860, so you should stop trading and wait and see how things go.
The strong support area is 1.191-1.593, so if it finds support around this area, it would be a good time to buy.
-
Thank you for reading.
I wish you successful trading.
--------------------------------------------------
- Here's an explanation of the big picture.
(3-year bull market, 1-year bear market pattern)
I'll explain more in detail when the bear market begins.
------------------------------------------------------
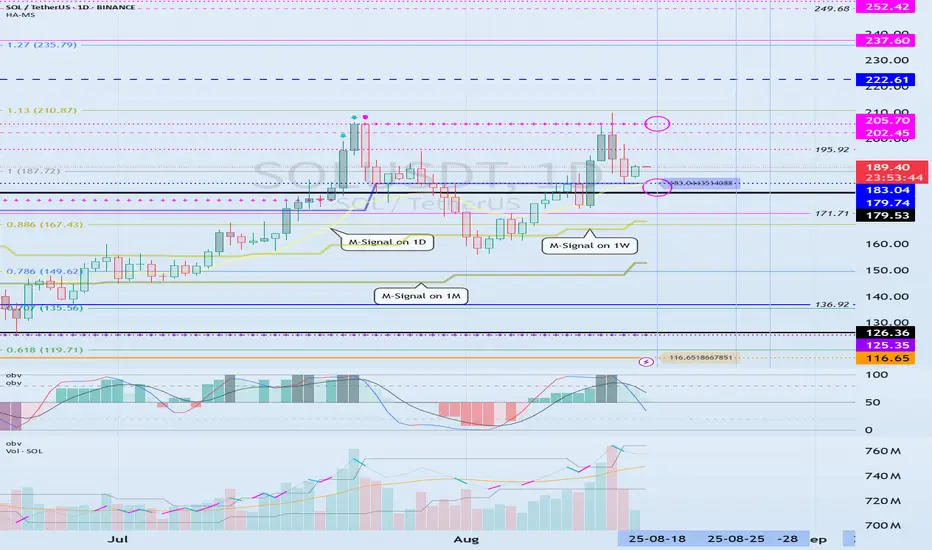
SOL Volatility Period: Around August 18
Hello, traders!
Follow us to get the latest information quickly.
Have a great day!
-------------------------------------
(SOLUSDT 1M Chart)
If the price stays above the M-Signal indicator on the 1M chart, the uptrend is expected to continue.
If it falls below 126.36, you should stop trading and observe the movement.
Since the HA-High indicator is forming at 179.74, the key question is whether it can find support near this level and rise.
The start of a stepwise uptrend is likely to begin with a rise above 237.60, the DOM (60) indicator level.
Therefore, the key point to watch is whether it can find support in the 179.74-237.60 range.
The DOM (60) indicator indicates the end of a high, while the HA-High indicator indicates a decline from a high.
Therefore, the 179.74-237.60 range can be considered a high boundary zone.
When the DOM (60) or HA-High indicator first forms, a decline is likely.
If the decline is followed by a rise near the HA-High or DOM (60) indicator, the likelihood of an upward breakout increases.
Therefore, if support is found around 179.74 this time, it is highly likely to lead to an attempt to rise above 237.60.
-
(1W chart)
The key area to watch on the 1W chart is whether the price can break above the 202.45-222.61 level.
If the price breaks above the 202.45-222.61 level and maintains its upward momentum, a stepwise uptrend is likely to begin.
-
(1D chart)
The key area to watch on the 1D chart is whether the price can find support around 179.53-183.04 and rise above 205.70.
The 183.04 point is the HA-High indicator level, and the 205.70 point is the DOM (60) level.
If it falls below 183.04, it is expected to meet the M-Signal indicator on the 1W chart and re-establish the trend.
Ultimately, the price must remain above the M-Signal indicator on the 1M chart to maintain a strong uptrend.
Therefore, looking at the bigger picture, we need to determine whether the 126.36-179.53 range provides support and allows for an upward movement.
SOL's current volatility period is around August 18th (August 17th-19th).
At this time, we should look for a direction in which it deviates from the 183.04-205.70 range.
-------------------------------------------------
Only the concept of price moving averages, which I learned while studying chart analysis, is applied to the M-Signal indicator on the 1M, 1W, and 1D charts.
The rest of the explanation cannot be interpreted using existing chart analysis techniques.
This is because the HA-Low and HA-High indicators were developed for trading on Heikin-Ashi charts, while the DOM(60) and DOM(-60) indicators are a comprehensive evaluation of the DMI, OBV, and MOMENTUM indicators.
Therefore, to interpret my charts, you must apply the concepts of support and resistance points.
It's not that my chart explanations lack logic; they simply seem illogical because they can't be interpreted using existing interpretation methods.
Chart analysis should be as simple and concise as possible.
If you spend too much time analyzing charts or trying to apply complex theories, you will lack time to develop a trading strategy, increasing the likelihood of your trades going in the wrong direction.
To interpret my chart, all you need is a basic understanding of price moving averages and support and resistance.
Support and resistance points are determined by the horizontal lines of the DOM(60), HA-High, HA-Low, and DOM(-60) indicators.
The DOM(60) and HA-High indicators mark highs, while the HA-Low and DOM(-60) indicators mark lows.
Therefore, a basic trading strategy can be used: buy when the price rises from the DOM(-60) to HA-Low range, and sell when it reaches the HA-High to DOM(60) range.
However, if the price rises above the HA-High to DOM(60) range, a stepwise uptrend is likely, while if the price falls below the DOM(-60) to HA-Low range, a stepwise downtrend is likely.
Therefore, a segmented trading strategy should be adopted.
-
The basic chart for chart analysis is the 1D chart.
Therefore, it's best to trade in line with the trend of the 1D chart.
Therefore, the position that matches the trend of the 1D chart becomes the main position.
So, since the current trend of SOL's 1D chart is up, the LONG position becomes the main position.
To trade based on the trend of the 1D chart when trading futures, you need to set low leverage.
Therefore, when trading based on the timeframe chart you're viewing, increase your investment proportion when trading in line with the trend of the 1D chart. Conversely, when trading in the opposite direction, reduce your investment proportion and execute short, quick trades.
-
Thank you for reading to the end.
I wish you successful trading.
--------------------------------------------------
- This is an explanation of the big picture.
(3-year bull market, 1-year bear market pattern)
I will explain in more detail when the bear market begins.
------------------------------------------------------
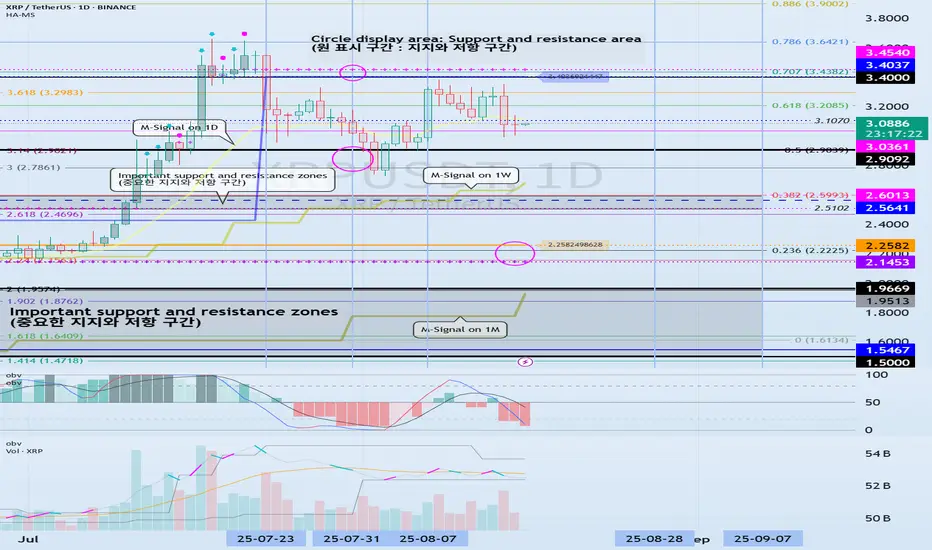
Check if the price can hold above 2.9092
Hello, traders.
If you "Follow" us, you'll always get the latest information quickly.
Have a great day.
-------------------------------------
(XRPUSDT 1D Chart)
If the price falls below the 1.5-1.9669 range, a major downtrend is likely to begin.
To maintain the uptrend, the price must hold above the 2.5102-2.6013 range.
If the price falls below the M-Signal on the 1D chart, it is highly likely to meet the M-Signal indicator on the 1W chart.
In that sense, we should check for support around the previous all-time high (ATH) area of 2.9092.
The next period of volatility is around August 28th.
However, since BTC's volatility period is around August 24th, you should closely monitor its movements from around that time.
-
(1M Chart)
While it's virtually impossible to predict the price as it's currently hitting a new all-time high (ATH), the area marked by a circle could potentially become a resistance zone.
The key is whether the price can maintain its upward momentum above the Fibonacci range of 0.618 (3.2085) on the right and 3.618 (3.2983) on the left.
The Fibonacci range on the left was drawn during the first wave.
-
Thank you for reading.
I wish you successful trading.
--------------------------------------------------
- This is an explanation of the big picture.
(3-year bull market, 1-year bear market pattern)
I will explain in more detail when the bear market begins.
------------------------------------------------------
Important Area: 0.30771-0.33084
Hello, fellow traders!
Follow us to get the latest information quickly.
Have a great day!
-------------------------------------
(TRXUSDT 1D Chart)
TRX is one of those coins (tokens) that has a lot of users, yet feels neglected.
For TRX to maintain its uptrend, the price must remain above the 0.30771-0.33084 range.
The circled areas represent important support and resistance zones.
When the M-Signal indicator on the 1W chart rises near the 0.30771-0.33084 range, a price decline below that level is highly likely to trigger a downtrend.
-
Thank you for reading to the end.
I wish you successful trading.
--------------------------------------------------
- This is an explanation of the big picture.
(3-year bull market, 1-year bear market pattern)
I will explain in more detail when the bear market begins.
------------------------------------------------------

Next Volatility Period: Around August 24th
Hello, traders!
Follow us to get the latest updates quickly.
Have a great day!
-------------------------------------
(BTCUSDT 1D Chart)
After this volatility period, the price has re-entered the 115854.56-119177.56 range.
Accordingly, the key question is whether the price can rise after finding support in the 115854.56-119177.56 range.
The next volatility period is around August 24th (August 23rd-25th).
----------------------------------------
To determine the volatility period, support and resistance points and trend lines must be drawn on each timeframe chart.
Support and resistance points are drawn using the DOM(60), HA-High, HA-Low, and DOM(-60) indicators included in the HA-MS indicator.
Trend lines are drawn by connecting the points where the K value of the StochRSI indicator forms peaks in overbought or oversold zones.
Therefore, the trend line is drawn by connecting the peaks formed in overbought zones with a high trend line and the peaks formed in oversold zones with a low trend line.
If these two trend lines form a channel, the trend is likely to continue. If the trend lines intersect, a new trend is likely to be created.
(1M Chart)
The trend lines on the 1M chart are not specifically distinguished between high and low trend lines, but are instead displayed in a single color.
This is because we determined that distinguishing between them is unnecessary, as they represent long-term trends.
When creating trend lines, you must use peaks created in overbought or oversold areas.
The 1M chart displays a dotted trend line, which connects points in overbought or oversold areas that do not have peaks.
These trend lines are not used to determine periods of volatility.
(1W Chart)
Draw support and resistance points and trend lines on the 1W chart, just like on the 1M chart.
When possible, draw trend lines only from recently created peaks and delete previously drawn trend lines.
(1D Chart)
Draw support and resistance points and trend lines on the 1D chart, just like on the 1M and 1W charts.
The points where these support and resistance points and trend lines intersect or intersect are used to identify periods of volatility.
When possible, areas where multiple support and resistance points and trend lines intersect or intersect are considered periods of high volatility.
Also, since trend lines on 1M > 1W > 1D charts differ in accuracy, it's best to select points where they intersect more frequently when utilizing trend lines drawn on 1D charts.
-
Indicators or other analysis techniques created by others require long-term observation to understand and utilize.
Therefore, rather than defining them as right or wrong, consider them as possible and consistently check real-time data to make them your own.
-
Thank you for reading to the end.
I wish you successful trading.
--------------------------------------------------
- This is an explanation of the big picture.
(3-year bull market, 1-year bear market pattern)
I will explain in more detail when the bear market begins.
------------------------------------------------------

ETH's next volatility period: around August 28th
Hello, traders!
Follow us to get the latest information quickly.
Have a great day!
-------------------------------------
(ETHUSDT 1D chart)
This volatility period for ETH is expected to last until August 15th.
Therefore, caution is advised when trading.
The key question is whether the price can rise above the previous all-time high (ATH) of 4868.0.
Currently, the key support and resistance levels are 3900.73-4107.80.
Therefore, even if there is a further decline, if the price remains within the 3900.73-4107.80 range or higher, the upward trend is expected to continue.
Currently, the HA-High indicator is formed at 3708.87, so it's important to check whether a new HA-High indicator is formed if a further decline occurs.
The formation of the HA-High indicator indicates a decline from the high, so determining whether support is found near that level is crucial.
While ETH's volatility period is around August 28th, BTC's volatility period is around August 24th. Therefore, it's important to monitor how the price moves during this period.
-
Thank you for reading.
We wish you successful trading.
--------------------------------------------------
- Here's an explanation of the big picture.
(3-year bull market, 1-year bear market pattern)
I'll explain more in detail when the bear market begins.
------------------------------------------------------

BTC Standard Deviation play on the DailyBitcoin is following the standard deviation map perfectly on the Daily chart. 📊
Next key resistance levels: $126,977 and $130,614. Let’s see if it plays out.

The key is whether it can rise above 5.886.
Hello, fellow traders!
If you "Follow" me, you'll always get the latest information quickly.
Have a great day.
-------------------------------------
I don't necessarily recommend coins (tokens) that exhibit this behavior.
However, if you have spare funds or have or can generate significant profits from other coins (tokens), I think it's worth looking into these coins (tokens) when they're ready to trade.
The key is to maintain the price above the M-Signal indicator on the 1M chart.
-------------------------------------
(CVXUSDT 1M Chart)
CVX is showing signs of rising above the M-Signal indicator on the 1M chart.
If the price remains above the M-Signal indicator on the 1M chart, the upward trend is likely to continue.
-
(1W Chart)
After a prolonged period of sideways movement, the HA-Low and HA-High indicators on the 1W chart have converged, and the price has risen above the M-Signal indicator on the 1M chart.
Therefore, the 2.862-3.412 range is considered a support area.
If it falls below the 2.862-3.412 range, you should stop trading and wait and see how things go.
The DOM (60) indicator is forming at 5.886, so a break above this level is highly likely to initiate a stepwise uptrend.
Therefore, the key question is whether it can find support near 4.116 and rise above 5.886.
-
(1D chart)
The key question is whether it can find support in the 4.418-4.902 range and rise.
You should observe the transition from the M-Signal on the 1D chart > the M-Signal on the 1W chart > the M-Signal on the 1M chart.
If the M-Signal indicators are aligned correctly, a full-scale uptrend is likely to begin.
-
Thank you for reading to the end.
I wish you successful trading.
--------------------------------------------------
- Here's an explanation of the big picture.
(3-year bull market, 1-year bear market pattern)
I'll explain more in detail when the bear market begins.
------------------------------------------------------

Support and Resistance Areas: 114454.57-115854.56
Hello, traders!
Follow us to get the latest information quickly.
Have a great day!
-------------------------------------
(BTCUSDT 1D Chart)
The K indicator on the StochRSI indicator appears to have entered the overbought zone, leading to a change in slope.
Therefore, the upward trend appears likely to be constrained.
-
We need to confirm whether the price falls within the range indicated by the index finger.
The key question is whether there is support around 114454.57-115854.56.
If it declines, it is likely to continue until it meets the M-Signal indicator on the 1W chart.
At this point, we need to check for support around 108353.0.
This period of volatility is expected to occur around August 13th (August 12th-14th).
The start of a stepwise uptrend is likely to occur only after it rises above 119177.56.
-
Thank you for reading to the end.
We wish you successful trading.
--------------------------------------------------
- This is an explanation of the big picture.
(3-year bull market, 1-year bear market pattern)
I will explain in more detail when the bear market begins.
------------------------------------------------------

Next Volatility Period: Around August 21
Hello, traders.
Please "Follow" to get the latest information quickly.
Have a nice day today.
-------------------------------------
#TSLA
We need to see if it is rising along the rising channel.
The key is whether it can rise with support near 311.48 to break out of the downtrend line.
The key is whether it can rise along the short-term uptrend line and break through the short-term downtrend line after passing through this volatility period around July 25.
Therefore, we need to see whether it can rise above the 347.21-382.40 range with support near 311.48.
The next volatility period is expected to be around August 21.
-
The important thing is to maintain the price above the M-Signal indicator on the 1M chart.
If not, there is a possibility of a long-term downtrend.
Therefore, if it shows support in the 268.07-311.48 range, it is a time to buy.
-
Thank you for reading to the end.
I hope you have a successful trade.
--------------------------------------------------
