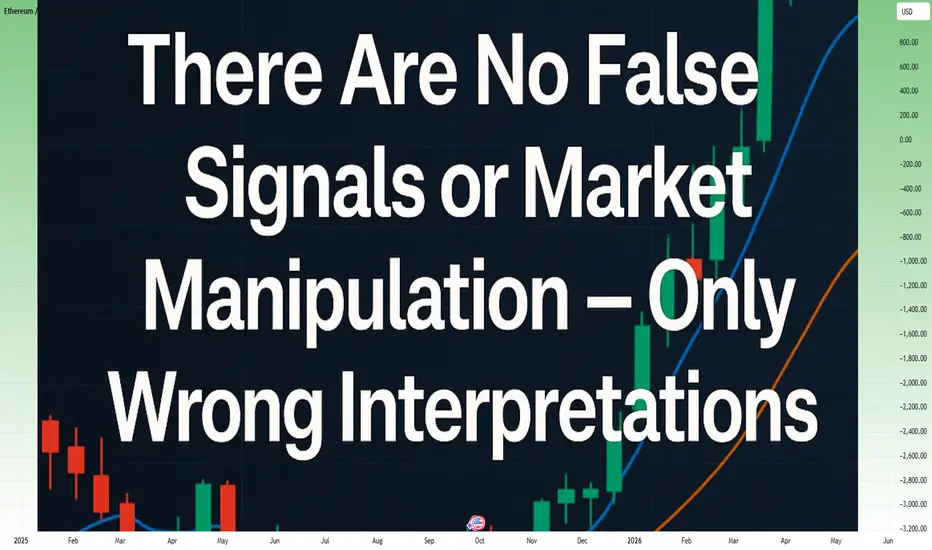
Stop Blaming Market Manipulation: It’s Your Wrong InterpretationThe Excuse Factory
Recently, Bitcoin dropped from 118k to 108k. Suddenly, TikTokers, YouTubers, and X posters spiraled into paranoia, copy-pasting the same narrative: the “big masterminds,” reptilians, or aliens manipulated the market to liquidate 1.7 billion in buy orders.
Let’s pause for a second. A 10% pullback in Bitcoin is now considered a “market crash”?
If we look deeper... Ethereum fell about 20% from its top — but this same ETH had already grown 300% since April.
Was that also “manipulation”? Or does manipulation only happen when you are losing money?
How do you think markets work in general? Do they move only upward, just to make you richer?
The truth is simpler: there is no manipulation conspiracy here. There are no “false signals.” What exists are wrong interpretations.
The Market Is Neutral
The market doesn’t care about your position. It doesn’t send “false” signals; it simply moves. Price action reflects the sum of supply and demand in each moment.
When traders label a signal as “false,” what they really mean is:
• They misread the context.
• They didn’t account for a higher timeframe.
• Their stop placement wasn’t aligned with market structure or was too close.
The market doesn’t lie. It only reveals how much or how little you understand it.
Examples of Misinterpretation
• The “false breakout” myth – What you see as a false breakout on the 1H chart may be a perfect retest on the daily timeframe. The market wasn’t wrong—you were looking at it from the wrong lens.
• Stop hunting paranoia – Many traders cry “manipulation” when price takes out a cluster of stops. But think: stops are liquidity, and liquidity is where big players need to fill orders. That’s not manipulation—it’s how markets function.
• News volatility – Many traders call sudden spikes around economic releases “market tricks.” In reality, it’s about liquidity gaps. There aren’t buy and sell orders evenly distributed at every price level. When major news hits, price “rearranges” itself to include the new information and moves sharply until it finds liquidity — usually around strong support or resistance zones.
The Psychology Behind Blame
Blaming manipulation is easier than admitting error. It protects the ego. If the loss was due to some shadowy force, you don’t have to change. But this mindset locks traders into a cycle of frustration. Progress begins when you stop blaming the market and start analyzing your own decision-making.
Case Study: Ethereum’s Current Setup
As the saying goes, a picture says more than a thousand words.
Since April, Ethereum has rallied over 300% in just six months. On this path upward, the chart shows two apparent “false breaks” of support.
The question now is: will the current move be the third “false break,” or the first real break? As I wrote in yesterday’s analysis, confirmation is key...
But even if ETH drops further, say to 3600, nothing truly changes in the broader picture. Such a move would only be a healthy correction of the trend that started in April — perfectly aligning the price with the 38% Fibonacci retracement and the rising trendline support.
Conclusion: The Trader’s Responsibility
There are no false signals. There is no hidden enemy in the market. There is only your interpretation.
Trading Tools
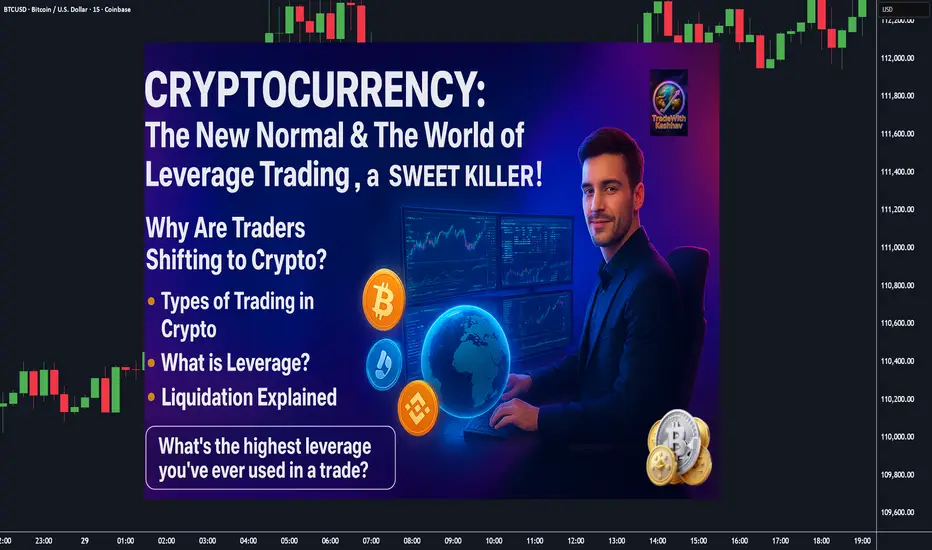
Cryptocurrency : The New Normal & The World of Leverage Trading.📌 Cryptocurrency: The New Normal & The World of Leverage Trading ⚔️ ( A Sweet Killer! )
🌍 Why Are Traders Shifting to Crypto? COINBASE:BTCUSD BITSTAMP:ETHUSD COINBASE:SOLUSD
✔️ Lower capital required compared to stocks
✔️ Fewer gaps (24/7 market = no overnight gap-up/down shockers)
✔️ High leverage opportunities (control bigger trades with smaller margin)
✔️ Global accessibility (Binance, Bybit, OKX, CoinDCX, Mudrex etc.)
📊 Types of Trading in Crypto
💠 **Spot Trading** → In India, 30% tax on capital gains ( check according to your country ).
💠 **Options & Futures** → Taxed as *Business Income* ( like F&O in stocks ). No flat % rule.
⚡ What is Leverage?
👉 Leverage means using *small capital* to control a *large trade size* , because the exchange lends you money.
Think of it like **margin trading** in stocks — but much more aggressive.
🔹 Example 1 : Normal Trade style ( No Leverage )
suppose you have 💰 Capital = $10,000
Bought BTC at Price = $10,000,000
* You can buy 0.001 BTC ( 10000 ➗ 10,000,000 ).
* If BTC rises 10% → Profit = $1,000 (+10%)
* If BTC falls 10% → Loss = $1,000 (-10%)
👉 Risk & reward move in proportion to your capital.
🔹 Example 2 : Leverage Trade style ( 10x Leverage )
suppose you have 💰 Capital = $10,000
opted Leverage = 10x
New Trade Size ( margin ) = $1,00,000 ( you can now utilize this margin amount for trading )
* You can buy 0.01 BTC ( 10000 ➗ 10,000,000 ).
* If BTC rises 10% → Profit = $10,000 (+100% return)
* If BTC falls 10% → Loss = FULL $10,000 ( Liquidation 🚨 )
👉 A 10% move = your account will be blown.
🔹 Example 3:
suppose you have 💰 Capital = $10,000
opted Leverage = 50x (Extreme ⚠️)
New Trade Size ( margin ) = $5,00,000 ( you can now utilize this margin amount for trading )
* You can buy 0.05 BTC ( 50000 ➗ 10,000,000 ).
* If BTC rises just 2% → Profit = $10,000 (+100% return)
* If BTC falls just 2% → FULL $10,000 loss ( Liquidation 🚨 )
* If BTC rises just 10% → Profit = $50,000 (+500% return)
* If BTC falls just 10% → FULL $10,000 loss ( Liquidation 🚨 )
👉 Tiny moves in high volatile asset class = jackpot or wipeout/blown.
⚔️ Key Takeaways :
1️⃣ Leverage multiplies profits 💸 but also multiplies losses too💀 ( a sweet killer! )
2️⃣ Crypto is *highly volatile* (10–20% daily moves are common) → High leverage is extremely risky, if not managed well.
3️⃣ Beginners should **never use more than 2x–3x leverage**
👉 In simple words: **Leverage is a double-edged sword ⚔️**
Used wisely → You’re a king 👑
Used recklessly → You’re broke 🥀
---
🚘 Liquidation Explained ( ex: Car Analogy )
Imagine you pay $10,000 ( as a security ) to rent a car worth $1,00,000. (That’s 10x leverage).
* The car is in your hands, but $90,000 still belongs to the owner of car (exchange).
* If the damage goes beyond your $10,000 margin → the owner takes back the car immediately.
👉 That’s liquidation: when your loss = your margin.
🔹 Case 1: Normal Trade style ( No Leverage )
Margin = $10,000 → Buy BTC.
If BTC drops 10% → Loss = $1,000.
You still have $9,000 left.
✅ No liquidation. Just a normal loss.
🔹 Case 2: 10x Leverage Trade style
Margin = $10,000
New Trade Size ( margin ) = $1,00,000
* BTC rises 10% → Profit = $10,000 (+100%)
* BTC falls 10% → Margin wiped = Liquidation 🚨
🔹 Case 3: 20x Leverage Trade style
Margin = $10,000
New Trade Size = $2,00,000 ( margin )
* BTC rises 5% → Profit = $10,000 (+100% return)
* BTC falls 5% → Margin wiped = Liquidation 🚨
👉 Just 5% against you = Account gone.
🔹 Case 4: 50x Leverage Trade style (High-Risk Zone ⚠️)
Margin = $10,000
New Trade Size = $5,00,000 ( margin )
* BTC rises 2% → Profit = $10,000 (+100% return)
* BTC falls 2% → FULL $10,000 loss = Liquidation 🚨
👉 Just 2% against you = Blown account = Game over.
🎯 Final Word
Leverage = Power ⚡
But in crypto’s volatile world, it’s also a **trap for the impatient**.
* Liquidation is directly proportionate to Leverage.
* Smart traders use small leverage.
* Impulsive traders burn out with high leverage.
💬 Question for you: What’s the **highest leverage** you’ve ever used in a trade? Drop it below 👇 (Be honest—we’ve all been tempted!)
If this Idea gave you a value information then please, Boost it, share your thoughts in comments, and follow for more practical trading!
Happy Trading & Investing!
@TradeWithKeshhav and team
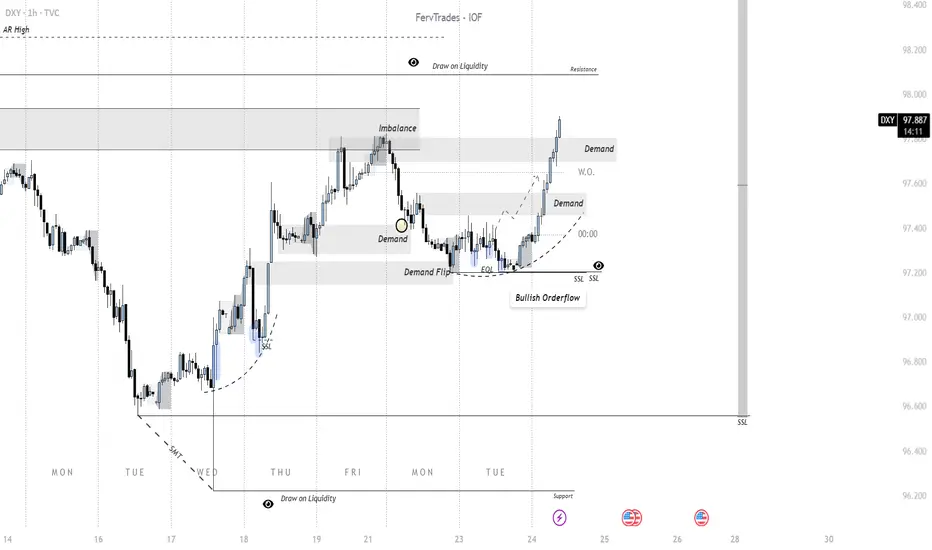
Importance of DXY for all CFD and Futures Assets The 1H DXY chart shows a clear shift in orderflow from bearish to bullish, framed within an auction-theory context where price continuously seeks liquidity to facilitate rebalancing. Early in the week, supply overwhelmed demand, driving the dollar lower into a region of resting liquidity (sell-side liquidity/SSL). This liquidity grab served as the catalyst for demand to reassert itself, evident in the sharp recovery that flipped prior supply zones into demand. The chart highlights a demand flip and multiple demand re-entries, showing how buyers defended levels once liquidity was secured.
Auction-wise, the market auctioned downward until sellers exhausted at a support zone near SSL, where bids were reintroduced. This led to an imbalance that buyers corrected by driving higher, reclaiming inefficiencies (noted in the imbalance box). Subsequent consolidation acted as a re-auctioning phase to validate demand before continuation. Now, the bullish orderflow is steering price toward resting liquidity overhead (draw on liquidity), with demand zones forming higher as the market reprices.
In short: orderflow reveals a demand-driven transition, with the auction process shifting value upward after clearing downside liquidity. The next key behavior will be how DXY reacts once it taps into overhead resistance and whether new demand sustains the auction higher or supply reasserts.
Introduction to a Trading System 1: Setting timeframes + bonusIntroduction to a Trading System: Setting Timeframes & Logarithmic Scaling
This educational video is the first in the "Signal and Structure" series, where an experienced crypto trader with 5+ years in cryptocurrency and additional forex background shares their systematic approach to chart analysis and trading.
Key Topics Covered:
Logarithmic Scale Fundamentals
- Why log scale is essential for cryptocurrency trading
- How it provides better perspective on price movements across different time periods
- Demonstrates using Bitcoin's price history how log scale reveals the true magnitude of moves and shows market maturation
Strategic Timeframe Selection System
- Introduces a unique 5-timeframe system based on dividing by 4:
- Monthly (30 days) - the base unit
- Weekly (≈30÷4 days)
- 2-Day (≈week÷4)
- 12-Hour (48 hours÷4)
- 3-Hour (12÷4)
Trading Philosophy
- Emphasizes simplification over complexity in trading
- Explains why using non-standard timeframes (2-day instead of daily) provides an edge
- Discusses how higher timeframes show cleaner structure while lower timeframes display more chaos
- Advocates for making trading easier by reducing noise and confusion
Practical Insights
- Higher timeframes (monthly/weekly) show more reliable patterns and are watched by institutional traders
- Lower timeframes become increasingly chaotic but still contain tradeable patterns
- The importance of stepping back to see the bigger picture in markets
The instructor brings a unique perspective influenced by classic traders like Gann and Wyckoff, and has developed over 140 custom indicators for their trading system. The video sets the foundation for understanding market structure before diving into signals and trading strategies in future episodes.

The Technical Analysis Superpower (That Isn’t Real)Imagine this: You spot the perfect candlestick pattern. It feels like the market’s secret code just unlocked. You hit buy. An hour later you’re staring at a loss, asking yourself: “What the hell just happened?”
That’s the illusion of control at play. I’ve been there. We all have.
How the illusion shows up:
You believe one pattern guarantees the next move.
You stack indicators thinking more = more control.
You convince yourself you’ve finally “cracked the code.”
The emotional side:
It feels good to play wizard. Technical analysis (TA) gives us tools, but it doesn’t give certainty. The market doesn’t care about your Fibonacci line or your perfect breakout. TA only tilts the odds—not controls them.
So what actually matters?
Keep it simple: 2–3 tools max. Start with trend. When you are following the higher timeframe bias, you are following the trend. The top 5-6% of traders get 90-100% of their profit from a selective bias.
Always ask: “If I’m wrong, where’s my exit? wher's my Stop loss?”
Backtest and track results. Aim for probability, not perfection.
Respect patience. Most fakeouts die fast—wait for confirmation.
Bottom line:
TA is not a superpower. It’s a probability framework. The real edge isn’t in control—it’s in discipline, trend recognition, and managing yourself when the market doesn’t care.
👉 What’s your biggest illusion of control story? Drop it in the comments—I want to hear how TA has tricked you.
— Skeptic

Best Lot Size for Gold Trading (XAUUSD) Explained
If you trade Gold with fix lot, I prepared for you a simple manual how to calculate the best lot size for your XAUUSD trading account.
Step 1
Find at least the last 10 trades that you took on Gold.
Step 2
Measure stop losses of all these trades in pips
Step 3
Find the trade with the biggest stop loss
In our example, the biggest stop loss is 680 pips
Step 4
Open position size calculator for XAUUSD
Step 5
Input your account size, 1,5% as the risk ratio.
In "stop loss in pips" field, write down the pip value of your biggest stop loss - 680 pips in our example.
Press, calculate.
For our example, the best lot size for Gold will be 0.22.
The idea is that your maximum loss should not exceed 1,5% of your account balance, while the average loss will be around 1%.
❤️Please, support my work with like, thank you!❤️
I am part of Trade Nation's Influencer program and receive a monthly fee for using their TradingView charts in my analysis.

Revealing The Secrets Of Pro Traders👋Hello everyone, if you’re just starting out with trading, this post is for you.
Trading can be exciting, but if you’re not careful, you’ll quickly become prey. Here are 5 common mistakes beginners often make:
1. Opening Too Many Positions At Once
When I first started, I thought using high leverage would help me make money quickly. But opening multiple trades at once can wipe out your account after just a small market reversal.
Example: A trader uses high leverage to buy XAUUSD, but when the price drops 10%, his account gets completely “burned.”
Solution: Always assess your personal conditions, calculate the profit you expect, how much loss you can handle, and set clear goals. I actually have a formula for this — if you’d like to know, just leave me a comment below.
2. Chasing Losses… And Losing Even More
It’s that feeling of desperation, right? You take a big loss on your first trades, then try to win it all back in the next ones, doubling down again and again… only to lose more.
I know the feeling of wanting to recover your money right away. But trying to chase losses by overtrading only makes things worse. Stop when you realize you’re acting out of emotion. Sometimes it’s better to accept a small loss and wait for a better opportunity, rather than risk blowing your account completely. That’s a hard lesson I learned from multiple wipeouts.
3. Ignoring Risk Management
Tell me you’re not guilty of this one. Many beginners think stop-losses or take-profits aren’t necessary because they believe they’ll “get lucky.” But skipping risk management is exactly why accounts get wiped out.
Example: A trader ignores stop-loss, and then unexpected news hits the market. The price reverses instantly, and the account vanishes “in a heartbeat.”
That’s why I always remind my students: set TP and SL on every trade and keep a close eye on important market news.
4. FOMO – The Fear of Missing Out
This is one of the feelings almost all of us experience when trading. Forget being an expert for a moment—when you’re new and see prices skyrocketing, with everyone around you buying, it feels like if you don’t jump in right now, you’ll miss your chance. But this impatience often leads to poor decisions. You end up buying without proper market analysis, and when losses come, you don’t even understand why—it’s simply because you were chasing the crowd.
5. The Biggest Factor – Lack of Knowledge
This one overshadows all the other mistakes. Many beginners rely only on tips from others or “tricks” without understanding indicators, technical analysis, or trading strategies. Maybe you’ve thought: “I just need to follow what others do, the market will be fine.” But in the long run, if you don’t fully understand your actions, you can’t control risk and the market will eventually knock you down. At that point, you’ll be left either begging for help or starting from scratch with your learning—too late.
In summary, success in trading comes down to three essentials:
Managing emotions
Managing risk
Continuously building knowledge and practicing consistently
In the coming posts, I’ll share more valuable lessons to help you overcome these challenges. You can study them, practice in a demo account, and then apply them to real trading when you’re ready. It will be incredibly useful.
If today’s lesson resonated with you and you’re excited for the next posts, hit the like button🚀—I’d love your support.
Good luck!

Forget the USD–Gold Correlation: Trade What MattersI took my first steps in the markets back in 2002 with stock investments. Real trading, however—the kind involving leverage, speculation, and active decision-making—began for me in 2004.
Like any responsible beginner, I started by taking courses and reading the classic trading books. One of the first lessons drilled into me was the inverse correlation between the US dollar and gold.
Fast forward more than 20 years, and for the past 15, XAUUSD has been my primary focus. And here’s the truth: I’m here to tell you that relying on USD–gold correlation is a mistake.
In this article, I’ll explain why you should avoid it, and more importantly, I’ll show you how to think like a “sophisticated” trader—especially if you can’t resist looking at the DXY .
Let’s Dissect the Myth
And for those who will say: “How on earth can you call this a mistake? Everyone knows gold moves opposite to the dollar!” — let’s dissect this step by step.
There couldn’t be a better example than 2025. We’re in the middle of a clear bullish trend in gold. Prices are climbing steadily, but not only against USD.
If gold were truly just the inverse of DXY, this overall rally wouldn’t exist. But it does. Why? Because the real driver isn’t the dollar falling — it’s demand for gold itself . Central banks are buying, funds are reallocating, and investors see gold as a store of value.
The Simple Logic That Breaks the Correlation
If it were truly a mirror correlation, then XAU/EUR would have been flat for years. Think about it: if gold only moved as the “inverse of the dollar,” then against other currencies it should show no trend at all. But the charts tell a completely different story.
Gold has been rising not just in USD terms, but also in EUR, GBP, and JPY. That means the move is not about the dollar being weak — it’s about gold being in demand.
This simple observation destroys the illusion of a strict USD–gold inverse correlation. If gold climbs across multiple currencies at the same time, the driver can’t be the dollar. The driver must be gold itself.
Why Correlation Thinking Creates Frustration
This is exactly why I tell you to ignore the so-called correlation: because it distracts you. You end up staring at the DXY when in reality, you’re trading the price of gold.
And that’s where frustration kicks in. You’re sitting on a position, watching the dollar index going higher, and you start yelling at the screen: “DXY is going up, so why isn’t gold falling? Why is my short position bleeding instead of working?”
I’ve been there many years ago, I know that feeling. But here’s the truth: gold doesn’t care about your correlation. It doesn’t care that DXY is green, red or pink. It moves on its own flows. And when you finally accept that, your trading becomes much cleaner. You stop being trapped by illusions and start focusing on the only thing that matters: the demand and supply of gold itself.
Where the Confusion Comes From
So where does all this confusion come from? Let’s take an example: imagine we get a very bad NFP number. That translates into a weaker USD. What happens? XAUUSD ticks higher.
Now, most traders immediately scream: “See? Inverse correlation!” But that’s not what’s really happening. The move you’re seeing is just a re-alignment of gold’s price in dollar terms. It’s noise, not a fundamental shift in gold’s trend.
If gold is in a downtrend overall, this kind of move doesn’t suddenly make it bullish. It’s just a temporary adjustment because the denominator (USD) weakened. On the other hand, if gold itself is already strong, such an event can act as an accelerator, pushing the trend even stronger.
The key is this: the dollar can influence the short-term pricing of XauUsd, but it doesn’t define the trend of gold. That trend is driven by demand for gold as an asset.
A Recent Example That Says It All
Let’s take a very recent example. Over the past month, DXY has been stuck in a range — no breakout, no major trend. Yet gold hasn’t just pushed higher in USD terms, it has made new all-time highs in XAU/EUR, XAU/GBP, and other currencies as well.
Why? Because gold rose. Not because the dollar fell, not because of some neat inverse chart overlay. Gold as an asset was in demand — globally, across currencies.
This is the ultimate proof that gold trades on its own flows. When buyers want gold, they don’t care whether DXY is flat, rising, or falling. They buy gold, and the charts across multiple currencies show it.
What Sophistication Really Looks Like
If you really want to be sophisticated, here’s what you do:
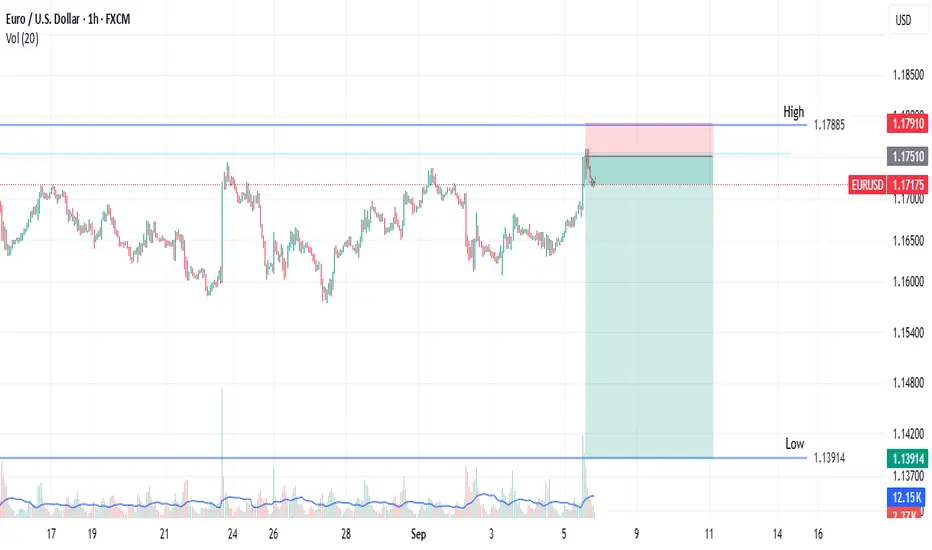
You see a clear bullish trend in XAUUSD. At the same time, you notice a clear bearish trend in EURUSD — which means the dollar is strong. Most traders get stuck here. Their brain short-circuits: “Wait, how can gold rise if the dollar is also strong?”
But the sophisticated trader doesn’t waste time arguing with a textbook correlation. Instead, they look for the trade that makes sense: buy XAU/EUR.
Because if gold is strong and the euro is weak, the real opportunity isn’t in fighting with DXY — it’s in positioning yourself where you can earn more. That’s not correlation thinking. That’s flow thinking.
Final Thoughts
The dollar–gold inverse correlation is a myth that refuses to die. Traders cling to it because it feels simple and safe. But real trading requires letting go of illusions and facing complexity head-on.
Gold is an independent asset. It rises and falls because of demand, not because the dollar happens to be moving the other way. Once you stop staring at DXY and start trading the flows that actually drive gold, you’ll leave frustration behind and step into sophistication.
🚀 If you still need DXY to tell you where gold is going, you’re not trading gold — you’re trading your own illusions.
3D alternative graph of USD/CHFThis video is of USD/CHF quotes placed in a spreadsheet. It gives an alternative visual representation to what you are seeing in TradingView, although it requires TradingView to run.

Enhancing My Trading Strategy with a Free Backtesting ToolI wanted to share a recent step I’ve added to my trading process that’s been helping me refine my approach: backtesting. Since I treat trading as a continuous learning journey, I’ve been using backtesting to evaluate strategies before I even consider using them on my demo account.
I’ve been testing a web-based backtesting platform that’s free to use. It lets me run through historical data much faster than trading in real-time, which helps me see how certain ideas might play out under different market conditions. I usually set a starting balance, pick a currency pair like EURUSD, and mark up the chart with my key levels—whether it’s structure, order blocks, or ranges.
One thing I’ve learned is to save my layout often. The free version includes ads, and I’ve lost a few setups by not saving before an ad refresh. It’s a small thing, but it reminds me to be meticulous.
The biggest benefit for me has been practicing risk management in a realistic but pressure-free setting. Before I place a simulated trade, I calculate my position size based on a fixed percentage risk. This helps me build discipline around controlling losses before worrying about profits.
I’m not here to teach or advise—just sharing what’s been working for me as I learn. If you’ve been using backtesting as part of your process, I’d be curious to hear what insights you’ve gained.
How Many Indicators Are Too Many?
I have been trading for around 5 years and in that time, I lost money and hope more often than I can count. A common coping strategy I use when in a time of loss is to strip all the "completely useless" indicators from my charts. And 6 months later, I have more than I had before.
Recently, I have actually started to earn small amounts of money from the markets consistently but my indicator problem persists. The picture above is an example of just some of the indicators I use. So now I ask the question,
-How many indicators are too many?
There really is not an answer despite what those on reddit might tell you. I seem to always have this fantasy that I will find the perfect chart set-up with all my indicators telling me just what I want to know. And of course TradingView has Pinscript which only makes my habit worse by allowing me to create exactly what I want.
As I was thinking about chart layouts this morning I came to a conclusion that my trading will always be evolving and the way in which I view the visual output of markets will change as well. There will most likely never be a chart set-up that I will use for the next 20 years. Even when I find my edge, the process of trading will still evolve. My "edge" will never be an indicator or a set of indicators .
So I wrote this to try and help those that are experiencing the same dilemma. Just know that you are not alone in your obsession with finding that perfect layout. Add 100 indicators to your chart and then delete them all when you feel they don't belong. You will never find that perfect indicator but but neither will you stop looking. It may seems like it is all a waste of time but I assure you that everything you experience in trading is worth it and progress does happen .
Safe Trading, Frank
CM-Finding Stocks That MOVE!-Part 2-(Building The Scanner)This is Video 2 in the series "CM - The Best Method I’ve Found For Finding - Stocks That MOVE!!"
Please make sure you watch the 1st video in this series which is listed below under Related Ideas.
Also in that post I provided links to two different watch lists.

Leverage in Crypto: The Sexy Lie vs. The Boring TruthLet’s be honest: the vast majority of crypto traders don’t come with a trading background. Not in stocks, not in futures, and definitely not in leveraged Forex.
Most enter crypto because of hype, the dream of fast money, and stories of overnight millionaires.
That’s why leverage in crypto is so dangerous. It’s not just a tool — it’s a trap for the unprepared.
________________________________________
What leverage really means
To keep it simple: with 100× leverage, every 1% move in your favor doubles your account, but every 1% move against you wipes it out completely.
👉 No matter the asset — Forex, Gold, Bitcoin, or meme coins — at 100× leverage you only have 1% room to be wrong.
________________________________________
Yesterday’s market moves – a perfect example
Yesterday, markets exploded across all asset classes:
• EURUSD → +1%
• Gold (XAUUSD) → +1.5%
• Bitcoin (BTC) → +4%
• Ethereum (ETH) → +8%
• PEPE, other coins and meme coins → +10%+
Now imagine trading them with 100× leverage, catching the bottom and selling at the top:
• EURUSD → +100% (account doubled)
• Gold → +150%
• BTC → +400%
• ETH → +800%
• PEPE → +1000%
Sounds incredible, right?
But here’s the other side: with 100× leverage, a –1% move against you = instant liquidation.
________________________________________
Effective Leverage – The Hidden Concept
Effective leverage — you rarely see it explained. Why?
Because it’s not sexy, not marketable, and most of all… exchanges and brokers don’t want this to be very clear.
Nominal leverage (the 50×, 100×, 200× banners you see everywhere) sells dreams. Effective leverage, on the other hand, shows the brutal reality: how much exposure you actually control compared to your account size.
Formula:
Effective Leverage=Position Size/Account Equity
• Example 1 (Forex): $1,000 account, $5,000 EURUSD position = 5× effective leverage.
• Example 2 (Crypto): $100,000 account, BTC at $100k, controlling 5 BTC ($500,000 position) = 5× effective leverage.
👉 Nominal leverage is the ad. Effective leverage is the invoice.
And once you understand it, the marketing magic disappears.
________________________________________
A concrete example – Solana trade
Let’s take a real setup I shared recently on Solana:
• Entry: buy at $200
• Stop Loss: $185 → risk on the asset = -7.5%
Case 1 – 100× leverage
From 200 → 198 (–1%), you’re liquidated. You never reach your stop at 185.
Case 2 – 10× effective leverage
Every 1% move = 10% account swing. You could survive down to 180, but you’d be under constant stress.
Case 3 – 2× effective leverage (my choice)
Let’s say you control $2,000 worth of SOL, effectively $4,000 exposure.
• If Solana falls to 185 (–7.5%), that’s a –15% hit to your account. Painful, but survivable.
• If Solana rises to 250 (+25%), with 2× leverage you make +50% on allocated capital.
• Risk–reward ratio: ~1:3.3 — sustainable, worth taking.
________________________________________
The psychological factor
This is where leverage breaks most traders.
• With 100× leverage, every 0.2% fluctuation moves your account by 20% (≈ $400 on a $2,000 account). Every 1% move = liquidation. How do you stay calm? You don’t.
• With 2× effective leverage, a 1% fluctuation only moves your account 2% (≈ $40). Boring? Maybe. Survivable? Absolutely.
Now imagine: you enter SOL at 200 with 100× leverage.
• At 202, you’ve doubled your account.
• At 210, you’ve made 5×.
But will you hold? No. Because:
1. If you’re awake, the stress of watching wild swings (in money, not in price) forces you to close early.
2. If you do hold, it’s usually because you were asleep — or the move happened in a single violent candle.
Markets never move in a straight line. They go 200 → 202 → 201 → 203 → 201 → 205…
At 100× leverage, every retracement feels like life or death. At 2× leverage, it’s just noise.
________________________________________
Conclusion
Leverage isn’t evil. It’s just a tool. But in crypto, with insane volatility and inexperienced traders, it becomes a weapon of mass destruction.
• At 100×, you’re gambling on the next 1% very small move.
• At 10×, you’re constantly stressed and one bad move away from ruin.
• At 2×–5× effective leverage, you can actually follow your plan, respect your stop, and let your targets play out.
Trading isn’t about adrenaline. It’s about survival.
High leverage destroys accounts — and discipline. Small, controlled leverage gives you the one thing you need most in trading: time.
P.S.
Of course, the choice is yours — what leverage you decide to use, whether you take into consideration the concept of effective leverage, or how you handle the psychological impact of high leverage.
But at least now, you know. 🙂

MVRV Demystified: A Guide to Tops, Bottoms & RiskFinancial nerds love to give tools weird names to make them look like fortune-tellers. Some actually are predictive—like grandma’s dreams!🌙 I’m Skeptic from Skeptic Lab , and today we’re talking about MVRV .. First off, it can’t predict the future , but it tells you four key things:🔮
Identifying market tops and bottoms
Assessing market sentiment
Trading strategies
Risk management
What is MVRV? 🔍
Imagine you have a box of chocolates. You want to know how many you have and what they’d be worth if everyone decided to buy or sell.
MVRV is a number that shows: “How the current value of everyone’s chocolates compares to the price they originally paid.”
High MVRV → people are selling chocolates for much more than they paid → expensive market.
Low MVRV → people are selling for less than they paid → cheap market, potential buy zone.
In short: MVRV is like a green/red light for buying and selling chocolates 🍫🚦.
The Formula ➗
Market Value (MV): total value of all coins at current market price.
Realized Value (RV): total value based on last on-chain transaction price — a "truer" cost basis, filtering out short-term volatility.
Why Z-Score? ✨
MVRV alone sometimes misleads:
In bull markets , it can stay high for weeks → fake sell signals.
Low MVRV can just be short-term noise.
One week after MVRV was introduced, David Puell and Murad Mahmudov created the MVRV Z-Score. It standardizes MVRV against historical mean and volatility, showing if current levels are truly abnormal.
Z > 7 → speculative top
Z < 0 → deep undervaluation, potential bottom
Applications 🎯
Spotting Tops & Bottoms:
High MVRV (>3.5) = late bull top
Low MVRV (<1) = bear bottom, strong buy
Z-Score filters extremes
Market Sentiment:
High = greed, low = fear → emotional barometer
Trading Moves:
Long-term: buy <1, hold
Medium-term: sell >3.7, buy <1
Timebound MVRV (365d, 60d) shows short vs long-term holder pressure
Risk Management:
Identifying potential profit zones Checks if BTC is overpriced/undervalued vs RV
Works best combined with SOPR, NVT, macro factors
Limitations 🌡️
Sensitive to volatility
Assumes on-chain movements = sales (not always)
Blind to shocks (regulations, macro events)
Overvaluation can persist → mistimed sell signals
Needs historical data → weak for new coins
Not standalone → combine with other metrics
Conclusion 📍
MVRV compares Market Value to Realized Value → shows over- or undervaluation
Identifies market tops and bottoms
Z-Score filters noise, highlights abnormal levels
Historically effective in Bitcoin cycles
Best used with other metrics for holistic analysis
Boost for more Skeptic takes :) 📈
Disclaimer: This article was written for educational purposes only and should not be taken as investment advice.

CM - The Best Method I’ve Found For Finding - Stocks That MOVE!!Today I want to show you The Best Method I’ve Found to Create a list of Stocks to find the most profitable stocks to TRADE consistently.
Please leave a comment below if:
You find this video useful.
You have any questions.
You want me to do a video on how I built the screeners shown in the video.
You want me to continue providing the up to date watchlists.
The link to import the watchlist from the video:
www.tradingview.com
Thanks...

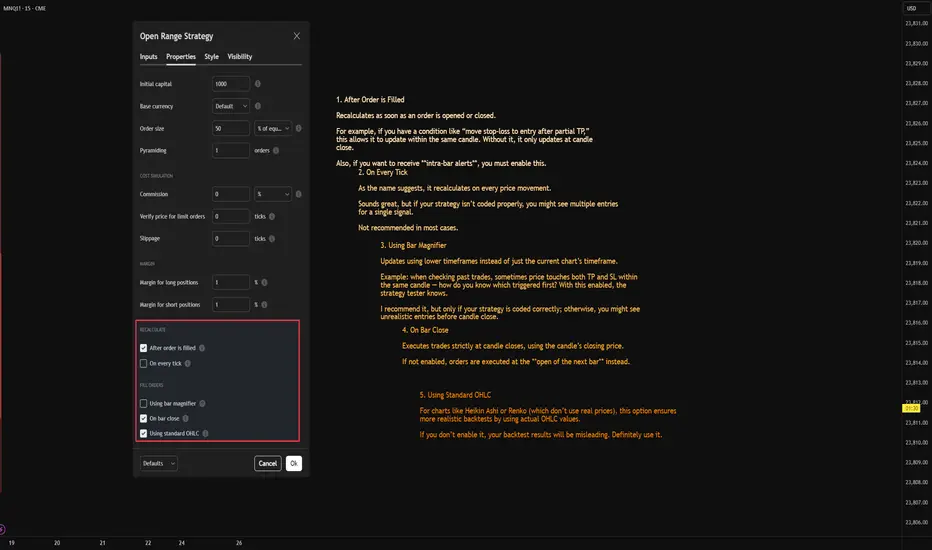
Do you really know what these Strategy Properties checkboxes do Hi everyone,
I'm a Pine script developer and i’ve noticed that many people don’t fully understand what the checkboxes in the **Strategy Properties** section of TradingView actually do. So I’d like to quickly explain them with practical examples:
1. After Order is Filled
Recalculates as soon as an order is opened or closed.
For example, if you have a condition like “move stop-loss to entry after partial TP,” this allows it to update within the same candle. Without it, it only updates at candle close.
Also, if you want to receive **intra-bar alerts**, you must enable this.
2. On Every Tick
As the name suggests, it recalculates on every price movement.
Sounds great, but if your strategy isn’t coded properly, you might see multiple entries for a single signal.
Not recommended in most cases.
3. Using Bar Magnifier
Updates using lower timeframes instead of just the current chart’s timeframe.
Example: when checking past trades, sometimes price touches both TP and SL within the same candle — how do you know which triggered first? With this enabled, the strategy tester knows.
I recommend it, but only if your strategy is coded correctly; otherwise, you might see unrealistic entries before candle close.
4. On Bar Close
Executes trades strictly at candle closes, using the candle’s closing price.
If not enabled, orders are executed at the **open of the next bar** instead.
5. Using Standard OHLC
For charts like Heikin Ashi or Renko (which don’t use real prices), this option ensures more realistic backtests by using actual OHLC values.
If you don’t enable it, your backtest results will be misleading. Definitely use it.
My suggestion:
- Always keep After Order is Filled and Using Standard OHLC enabled.
- If your past trades look clean (no strange early entries), also use Bar Magnifier for more accurate results.
Thanks for reading, stay safe out there!
From Cold Calling to Whitepapers: Same Game, New ToolsRemember that legendary scene in "The Wolf of Wall Street"?
Jordan Belfort (DiCaprio) picks up the phone to pitch “Aerotyne International” — a company “poised to explode” — operating from… a garage.
The sales pitch is flawless. The story is strong. The potential? Unlimited.
Except it was nothing more than a fantasy designed to move shares from one set of hands to another — at a profit for the seller.
There is a Romanian saying: "Same Mary, different hat"...
________________________________________
Fast forward to crypto
Today, we don’t have cold calls and penny stock brochures.
We have:
• Whitepapers describing revolutionary technology with no working product.
• Influencer threads promising “undervalued gems” to millions of followers.
• Slick promo videos replacing the boiler room pitch.
• Discord AMAs instead of dinner seminars.
The garage is still there — it’s just virtual now, hidden behind a Twitter banner and a Telegram admin.
________________________________________
Human psychology hasn’t changed
The tools evolved, but the emotions stayed the same:
• Greed — “I don’t want to miss the next big thing.”
• Fear — “If I don’t buy now, it’ll be too late.”
• Trust in authority — “He has a big following, he must know.”
Belfort sold the dream of massive returns.
Modern-day devs and influencers sell the dream of “generational wealth” from coins that exist only as code on a blockchain.
________________________________________
The mechanics are identical
1. Create a story.
2. Amplify it through trusted voices.
3. Target an audience hungry for “the next big thing.”
4. Offload the asset onto those late to the party.
Whether it’s “Aerotyne” or “MoonPepeMooning,” the pattern is the same — transfer value from the hopeful to the prepared.
________________________________________
How to not be the exit liquidity
• Verify: A whitepaper is just words. Look for a product, adoption, and revenue.
• Ignore the hype cycle: By the time it reaches you, someone else is unloading.
• Follow the money: Who benefits if you buy right now?
• Remember history: Tools change, human nature doesn’t.
________________________________________
Bottom line:
Cold calling in the ’90s or a viral thread in 2025 — it’s still a sales pitch.
The sooner you recognize it, the less likely you are to fund someone else’s yacht. 🚀

Skeptic's Night Byte: 3 Hacks to Beat a Losing StreakHey, it’s Skeptic 👋
We’ve all been there — losing streaks suck, but they don’t have to wipe you out.
In under 60 seconds, I’ll show you 3 quick hacks that make a huge difference:
Build friction into your trading decisions
Stop letting news events wreck your win rate
Use higher time frames to avoid the noise
Simple moves. Massive impact.
If this helped, hit that boost so I know to drop more tips like this.

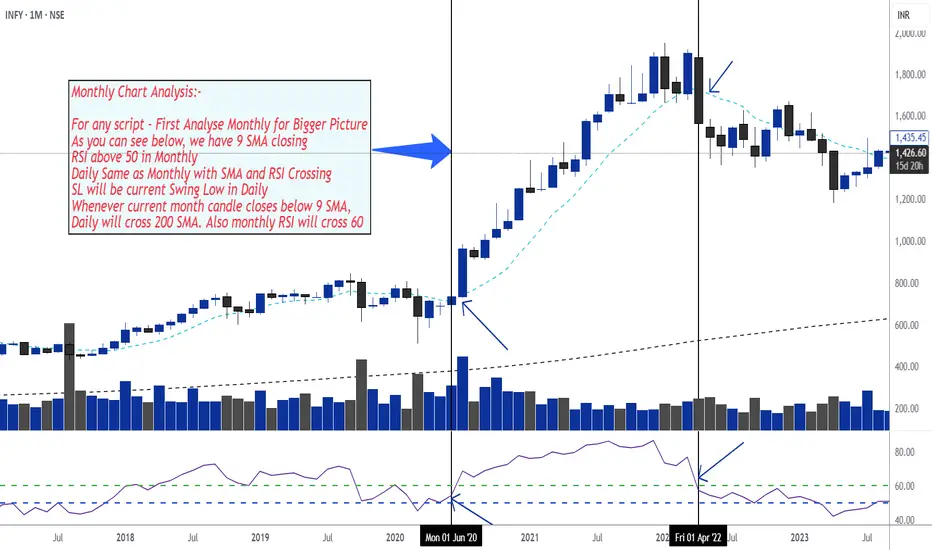
Swing Trading Setup - RSI and SMA 9 & 200🔍 Step-by-Step Monthly Chart Analysis
1. Start with the Monthly Chart – The Bigger Picture
9 SMA (Simple Moving Average)
→ Check if the current monthly candle is closing above the 9 SMA.
This indicates a bullish trend and acts as confirmation for strength in the longer term.
RSI (Relative Strength Index)
→ RSI should be above 50.
This suggests momentum is on the bullish side.
2. Align Daily Chart with Monthly
On the daily chart, confirm the following:
Price is also closing above the 9 SMA
RSI is also above 50 and crossing upward
✅ When both monthly and daily charts are aligned with these indicators, this is a strong confirmation for entry.
3. Stop-Loss Strategy
Use the most recent swing low on the daily chart as your Stop Loss.
This keeps your risk defined and close to your entry level.
4. Exit or Red Flag Condition
If the monthly candle closes below the 9 SMA, this is your major signal to:
Watch out for a trend reversal
Expect that the daily chart might cross below the 200 SMA
Also, watch for monthly RSI potentially crossing below 60, indicating waning momentum
📌 This acts as a signal to either exit the trade or tighten your stop loss.
The 50/50 Account Management Scam- How it WorksFrom Cold Calling to Telegram
I’ve been in the markets for so long I feel like a dinosaur, and I’ve probably seen every scam out there.
The truth is, none of them are really new — they’re just adapted to the new social paradigm.
What was done in the 2000s through cold calling is now done through Telegram, Instagram, X, and other social platforms.
I didn’t really want to write this article, in case it gave someone ideas.
But since anyone who wants to be a scammer already knows how it works, maybe this article can warn those who still have no idea how the so-called account management scam operates — especially its most common form: the coin flip scam (50/50 scam, Opposite trades scam, Split-direction scam, Two-group margin call trick, as is also known)
Step-by-Step: How the Coin Flip Scam Works
1. Gathering the victims
The scammer starts by fishing for victims through Telegram channels/groups, Instagram profiles, Facebook groups, or even X posts.
They present fabulous profits, post ads with guaranteed return offers, and flood the feed with so-called “proofs” — screenshots of winning trades, client testimonials, and account statements. Most of these are either fabricated or selectively chosen to show only the winning side.
Once someone shows interest, the scammer’s first move is to earn their trust.
They’ll tell you the broker doesn’t matter, that you can choose it, and that they have no access to your money — which is, technically, true.
Then comes the closer:
“You don’t have to pay me upfront. I only get paid if I make you money, so it’s in my best interest not to lose. You see? We’re on the same side.”
This combination of flashy results and “risk-free” terms makes you feel safe enough to hand them trading access.
________________________________________
2. Splitting into two groups
The accounts are divided into two equal batches:
• Group A → All-in BUY
• Group B → All-in SELL
With high leverage (e.g., 1:200), a 50-pip move means either doubling the account or wiping it out completely.
Note: I won’t go too deep into the details here, because the exact margin call level depends on the broker. But trust me, it’s easy for a scammer to plan the money split based on the different brokers’ rules. What we’re talking about here is just the general principle.
________________________________________
3. Guaranteed winners and losers
The market moves.
One group hits margin call and loses, while the other doubles or triples its capital (depending on broker's leverage, even more on 1:500).
The scammer now has perfect marketing material: “Look how I doubled my client’s account!”
________________________________________
4. Milking the winners
Clients who made a profit are celebrated and told something like:
“I only worked with low capital this time just to show you I can do it. I have big clients and serious strategies — now that you’ve seen the proof, deposit more so we can make real money.”
The scammer frames the initial gain as a “demo run” to gain the client’s confidence, pushing them to commit much larger sums next.
________________________________________
5. Recycling the losers
The wiped-out clients are told:
“It was an unusual market move. Deposit another $1,000 and we’ll recover it tomorrow.”
Some quit, but others fall for it again.
________________________________________
6. Repeat the process
The cycle continues. There’s always a “happy” group and real account statements to attract fresh victims, while the losers are quietly discarded or convinced to reinvest.
________________________________________
Why the scam works
• The proof are authentic – Screenshots and MT4/MT5 statements for the winners are real.
• Survivorship bias – Prospects only see the successes, never the failures.
• Hope psychology – Losers believe “next time” will be different (and it can be if they end up in the "winner group" next time
________________________________________
Final word
If someone promises to double your account quickly and safely — walk away.
Real trading is about risk management and long-term consistency, not betting your capital on a 50/50 gamble.
Don’t be the next screenshot in a scammer’s sales pitch. 🚀
P.S.
Stop believing they “made you money on purpose” at the beginning and then “lost it on purpose” after you deposited more.
If they truly had the skill to do that, they wouldn’t need to be scammers in the first place.
The reality is simple — once you put in more money, you just happened to land on the losing side of their scam.

How to Read COT Data: Understanding Big Players’ Order FlowHey whats up traders, today Im going to reveal my COT approach. If you’re serious about finding higher timeframe bias based on what the big players are doing, then COT data is a tool you need to know. It offers unique insights into the positioning of institutional traders—and if read correctly, it can help you align with real market momentum rather than noise.
Before we break it down step-by- step. I want to mention that this is my personal approach. Larry Williams is doing it differently and I have seen some other approaches. This is what works for me, might you find it also usefull.
What Is COT Data?
The Commitment of Traders (COT) report is published every Friday by the CFTC (U.S. Commodity Futures Trading Commission). It shows the open positions of various market participants in the futures markets as of the previous Tuesday.
This data is based on the requirement that large traders must report their positions once they pass a certain threshold. In short, we’re peeking into the order flow of institutions—excluding high-frequency trading and market making noise.
Hope you already recognized small disadvantage to us as retail traders.
Big players report data on Tuesday and it's published on Friday. So we basically have it late and we dont know what has happen in last 3 days. But no worry I will show you my trick how to read between the lines.
COT helps us:
• Understand HTF (Higher Timeframe) bias
• Spot shifts in institutional positioning
• Identify trend continuations or potential reversals
• Avoid getting trapped in retail sentiment traps
It’s not a standalone entry tool, but rather a macro confirmation layer for swing or position trades. Huge advantage by following large players is that they are trading on fundamentals and you dont need to worry about that - you just follow them. But you must follow the right participants, because there is few.
Who Are the Market Participants?
The COT report breaks down traders into several categories. Each one has a different motive and behavior in the market:
1. Commercials
• Think of them as hedgers.
• These are producers, manufacturers, and institutions trying to lock in prices for raw materials or currencies.
• They are usually contrarian at extremes.
When they reach record net long or net short positions, reversals often follow.
2. Non-Commercials (Speculators)
• These are institutional funds, hedge funds, and large speculators.
• Their goal? Profit.
• Often, they follow trends and their positioning reflects the broader market sentiment of the big money.
3. Dealers
• Mostly big banks and institutions facilitating trades.
• They manage risk rather than speculate heavily, so they typically take the opposite side of speculative flows.
4. Leveraged Money
• Hedge funds using high leverage.
• Their positions often reflect short-term speculative behavior.
• Watching their net positioning and changes week-to-week can give clues on momentum exhaustion.
Now you might think which one to follow and Yes you can build your strategy on following any of them fore example
Larry Williams - been trading base on Commercials
Anton Kreil - suggest following Leveraged money
I tried both but for me works best - Non commercials ( Speculators)
Again here you cant say definitely which one is right or wrong. What works for you is right. Thats it.
There are multiple versions of the report, but here are the most commonly used, Im using - ✅ Traders in Financial Futures (TFF)
• Focused on financial markets like forex, bonds, and indexes.
Where to find COT data?
It's free and you can find it on the SEC website there is simple week to week format. As you can see below. Many traders are watching this.
I dont say this is wrong but you dont have complete data - missing big picture.
As you can see here these data below are clearly giving you a picture about an order flow and positioning changedsvn the positions which can confirm trend or help you spot potential reversal you need to watch bigger data sample. Institutions doesnt reverse market in a week, they need to of load positions and I it takes them some time. Which will explain later.
Im collecting the data to the collums. I want see longs, shorts of commercials and from that I calculate. Following
Longs % exposure
Shorts % exposure
Net positions
13 weeks average
Historical Highest positions
Historical Lowest Positions
Relationship between these numbers helps me justify whats going behind the price action, but also spot strong levels. I will show you how to put it together with the context of the charts and then I will show you few order flow patterns examples, it's not difficult but it requires a bit of practice.
Bullish Pattern - Longs growing / Shorts being closed
This is the strongest COT patter and clean sign of buying
This is classing pattern what we have just seen on the EURUSD
Notice how longs has been growing constantly and net positions confirms that.
In may been able to see rapid shorts closing, which and confirmed bullish trend and we can look just for the bullish setups.
Now lets look to the USDJPY chart it will be tricky because it's all red and looks tricky but focus to the numbers and price action, how longs are growing while shorts being closed. Very weak JPY.
Bearish consolidation Shorts being build
Massive shorts being added int he consolidation phase longs doenst move at all. Further big drop coming. This is now happening on the AUDUSD. Look at this tight price consolidation and let's read what is happening. just look at the COT its clean longs around 23K constantly while they are building massive shorts. Whats gonna happens next is clear.
Profit taking move
This ofter occurs when we can see sharp move above the highs but without real longs being added, rather they being closed. As on our example below on the gold. We can see massive profit taking on longs while price was moving up. But they were not been adding shorts. What doest it tell us. They do not want to trade full reversal - not building short position, but market is overheated and they taking profits to buy later for lower or price can go to the consolidation where they will be building short, but definitely its late for us to go long.
Here is another example on USDCHF
Notice longs positions in the moment where there was 46K long and then next week change -12K net. It's a huge change which has started Sell off. But look in to Shorts , there is no heavy shorting, price simply go down based on huge longs profit taking. This is why its important to look in to bigger picture because if you look only in to week to week data. You will still see bigger longs than shorts and it will give you bullish opinion. Hope it's clear. And by the way now we can see 2 weeks with more then +3.4K longs. Its getting bullish IMO.
Now lets look to the another example on the USDCAD
Now we will use one of my past analysis where based on the data I predicted further move. And here I want to mention one thing. Even though we can see COT being bearish. It doesnt mean that price cant go up in short term (can be be 2- 3 weeks) There for you still need to use price action and dont just blindly short, but short run above the highs, because this is where big players add shorts. Not on the lows.
P rice moving up shorts being added - Reversal coming
This is showing positions building for the sell. In this case you can see both growing longs and shorts remember. Big players are hedgers, they are taking longs to move price up so they build shorts. Once they got their positions they close longs and sell of starts.
Lets look to my TV analysis where I have seen shorts grown recently while GBP was moving up close the Monthly Order block , but notice the shorts colum how the shorts were growing recently and also longs dropped from 110K to 100K.
Clena signs of the reversal but again I waited for a pullback above the weekly highs. Click to open a chart bellow
This was a prediction from few week ago. Now let's look how the data looks right now. On the GBPUSD chart below we can see reveal in the data. Long significantly dropped by 50% and shorts increased by 50%. This is a clean reversal pattern in the COT. Look at net positions it clearly flipped to the bearish and big drop is coming.
Few more tips
Remember they know we are watching this data and what we see is what they want us to see, so they are often trying to hide their positions as long as possible. Thats why intra-week reversal are happening on Wednesday after they report their positions.
They cannot hide the data forever, follow the data week by week to keep in track whats happening. It will increase your winning ratio.
Every 3 months there is a new futures contract. The must close the positions and reopen them in to the new contract, They are using it for reversals.
Also some if there is some US holidays on the day when report should be released to the public its delayed to the next week. And thats when they do biggest positions changes secretly.
COT data isn’t a magic crystal ball—but it’s a powerful tool if you know how to combine it with technical analysis. You need to use your mechanical system. It perfectly fits with my CLS strategy and It's suitable for swing traders.
Think outside the box. Even when you see bearish COT - dont be stupid to sell low. It's not NOD order flow for intraday scalping, you have time. But if you something is clearly bearish every run above weekly and daily highs is high probability Sell in the smart money trend.
Dont hesitate to ask any questions and follow. I share COT weekly updates.
“Adapt what is useful. Reject whats useless and add whats is specifically yours.”
David Perk aka Dave FX Hunter

Learning#05 : Decoding Highs and Lows📚 Learning#05 : Decoding Highs and Lows
- A Trader’s Guide to Reading the Market - Simple Yet Important
If the market were a book, the trend would be its storyline — and as traders, our job is to read that story without skipping pages. Trading with the trend puts the odds in your favor because you’re flowing with the market’s natural momentum, not fighting it.
Whether it’s an uptrend, downtrend, or a sideways grind, spotting it early gives you a big edge in deciding when to enter, when to exit, and when to simply step aside.
One of the simplest yet most reliable ways to read that story?
👉 Story of Highs and Lows
Let’s break it down.
📚 Understanding Highs and Lows in Trading
In technical analysis, highs and lows are the market’s way of leaving breadcrumbs.
A high is a peak before the market pulls back.
A low is a trough before the market bounces.
Track these points over time and you start to see patterns that reveal the market’s mood — bullish, bearish, or indecisive.
This isn’t about guessing; it’s about observing price action as it is.
📌 The Four Key Building Blocks of Market Structure
1️⃣ Higher Highs (HH)
Each new high is higher than the one before.Paired with higher lows, this signals an uptrend. Buyers are in control, and demand is pushing price upward.
Example: Nifty rallies from 22,000 to 22,200, pulls back to 22,100, and then rallies to 22,350. That second high (22,350) is higher than the first, confirming bullish momentum.
2️⃣ Higher Lows (HL)
Each pullback low is higher than the last.This tells you that sellers tried to push the market down — but buyers stepped in sooner this time, showing strength.
HLs often precede trend continuation and give great spots for entering long positions with tight risk.
3️⃣ Lower Lows (LL)
Each new low is lower than the previous one.Paired with lower highs, this marks a downtrend. Selling pressure is in charge, and rallies are being sold into.
4️⃣ Lower Highs (LH)
Each bounce high is lower than the last.This shows weakening buying pressure and often leads to another push lower.
Think of it like climbing stairs vs. walking down a hill:
📌 HH + HL = Stairs up → Bull trend.
📌 LL + LH = Hill down → Bear trend.
📈 HH+HL : Bullish Setup :
📉 LL+LH : Bearish Setup :
📌 Why It Matters for Traders
Price action is the most honest information in the market — no lag, no magic, no guesswork.
HH/HL → Bulls in control → Look for long setups.
LL/LH → Bears in control → Look for short setups.
Spotting these patterns on the fly means you can align with the dominant side instead of fighting it.
🧩 Combining HH & LL With Other Tools
📏 Fibonacci Retracements
Once you’ve identified the trend:
In an uptrend, draw Fibonacci from the latest HL to HH for pullback buying zones.
In a downtrend, draw from the latest LH to LL to find shorting opportunities.
⛰️ Fractals for Clarity
Fractals help pinpoint swing highs and lows without guesswork. I personally track HH/HL/LL/LH on a 1-minute chart for intraday trading — this keeps me in sync with the micro-trend while avoiding sideways traps.
🔀 Trendlines & VWAP
Trendlines show the bigger path, VWAP confirms intraday balance. When HH or LL aligns with these, you’ve got high-confluence setups.
🥷 Kiran’s Approach
For intraday, I start by mapping the structure: HH, HL, LL, LH. This gives me the immediate trend bias and alerts me to potential reversals early. I track them on a 1-min chart, combine with Fibonacci and trendlines, and trail stops as the structure unfolds.
It’s simple, visual, and keeps me out of bad trades and warns me to stay out of a sideways market situation, too.
🔑 Key Takeaway
Market structure is like a language — HH, HL, LL, and LH are its alphabet. Once you learn to read it, you’ll never trade blind again.
💡 “Trade what you see, not what you think. The chart always whispers first — you just have to listen.”
Start marking highs and lows on your chart tomorrow. Watch the story unfold. Trade in sync, and you’ll notice your entries become sharper, your exits cleaner, and your confidence higher.
See you in the next one — and until then:
Keep it simple. Trade with structure. Trust the levels.
— Kiran Zatakia
How to Use AI for Crypto Trading (The Right Way)lemme answer real quick: YOU DON’T.
Most traders using AI in crypto are straight up doing it wrong.
Here’s the usual story:
They open ChatGPT and ask,
“Hey… uhm… tell me which altcoin will 100x… Bruh, I heard you know everything, bet you know the next 10x coin!”
ChatGPT confidently replies,
“Sure, buy this coin right now…”
And the trader’s like,
“Ok, thanks.”
Then they jump on Binance, smash that buy button, and lose money faster than you can say ‘left trading’.
Don’t be that guy. Tools like ChatGPT weren’t made for this wild crypto jungle. Crypto’s a messy, super risky market, and ChatGPT’s language models mostly have old info anyway. They can’t give you solid, grounded analysis of what’s really going on — on-chain or across exchanges.
BUT, if you wanna cut through the hype and dodge the FOMO, this quick guide is for you. I’ll show you how to use AI the right way — with real on-chain and off-chain data, and special AI agents built specifically for crypto research.
Wanna keep going? Cool, let’s dive in. If not, peace out and don’t waste your time.
1. Use AI That Actually Processes On-Chain and Off-Chain Data
Real AI power kicks in when you talk about scale — thousands of tokens, millions of wallet moves, shifting stories everywhere. Humans can’t keep up, but AI can process it all instantly, in real time.
Look for AI tools that analyze stuff like:
Wallet behavior and how smart money moves.
Token velocity and decentralized exchange volumes.
Social sentiment from Twitter, Reddit, Discord, Telegram.
Developer activity, governance updates, protocol changes.
How market narratives pop up and spread.
2. Use AI Agents Made Just for Crypto Research
Crypto’s not like stocks or forex. It’s faster, fragmented, and shaped by both on-chain wallet moves and off-chain communities.
That’s where specialized AI agents shine. They understand stuff like:
How wallets behave during airdrops.
How Telegram groups hype early projects.
How dev activity correlates with price moves.
Instead of raw data dumps, these crypto-native AI agents spot patterns that’d take humans days to find. Like spotting when big wallet clusters start accumulating in a new ecosystem, or when a protocol suddenly blows up on social media.
3. Combine Research & Automation for Full-Spectrum Edge
I’m personally pumped about this part. Imagine an AI agent tracking low-cap funds moving into Telegram channels, running sentiment analysis, then tracking smart wallets accumulating tokens (even mixing in technical analysis).
Finally, it finds your risk management , sets triggers, and helps you enter trades with clear stop-loss and target levels.
Quick heads-up: Because of TradingView’s house rules, I can’t drop any links here — you gotta search and find your best AI tools on your own.
Remember : The only way to survive this market is to stay skeptical , watch risk management like a hawk, and keep your head cool. So if you feel FOMO creeping in or money management slipping — close your laptop, hit a coffee shop, and order a espresso. Trust me, it’s worth it.
Thanks for sticking with me till the end of this lesson. Im Skeptic from Skeptic Lab & If this helped, smash that boost button and I’ll catch you in the next one! :)