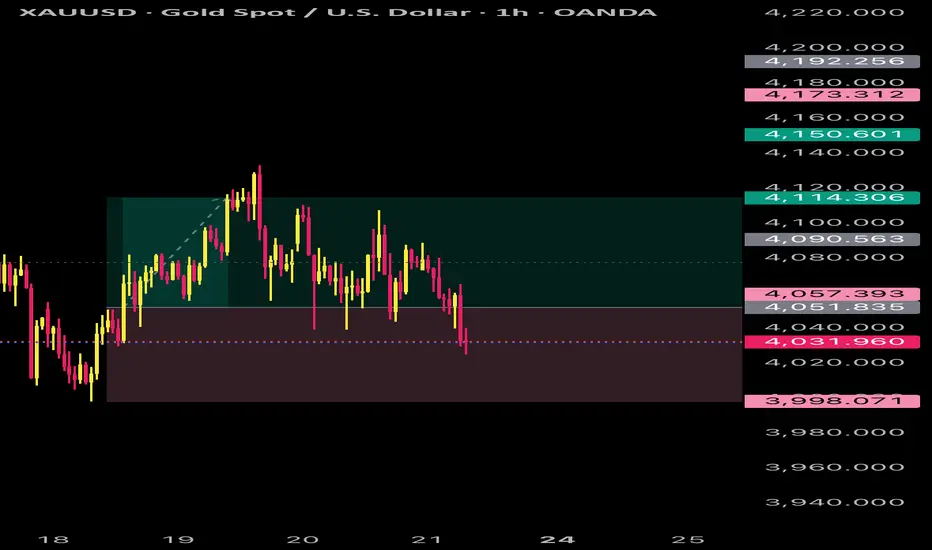
Gold Reaches Exhaustion Zone — Sell Momentum LoadingGold Reaches Exhaustion Zone — Sell Momentum Loading
Gold is showing signs of upside exhaustion, with price repeatedly failing to gain momentum as it approaches the mid-range premium zone near the 4,245 area. The recent structure reflects a market transitioning from short-term recovery into renewed weakness, with each bullish attempt losing strength faster than the previous one.
Order flow remains dominated by distribution behaviour, and the chart signals a potential liquidity sweep followed by a bearish continuation. The projected rejection zone suggests that buyers are running into an area of heavy supply, where institutional activity has previously triggered aggressive downside extensions. Volume distribution across the range also highlights diminishing demand at higher prices, reinforcing the likelihood of a downward rotation.
As the market continues to respect its broader range ceiling, the probability increases for price to revisit deeper value regions. With momentum fading and the current leg showing hesitation, gold is positioned for a potential sell-side move toward lower mean-reversion levels.
Tradingview

BTC Is Falling Freely – Every Pullback Is Just a Trap!Bitcoin is currently entering a phase where every bounce is seen as a selling opportunity . Market sentiment has turned cautious as news continues to lean negative: BTC has broken its lowest level in six months around $86,000 , and reports indicate that a major whale has exited a position worth $1.3 billion . When big money pulls out, the market struggles to stay stable.
Observing price action, BTC is moving steadily downward with lower highs forming continuously . Every time the price attempts to rise, it gets pushed down immediately, showing that sellers are fully in control of the market. Upper price zones are consistently rejected, proving that buying pressure is not strong enough to create any meaningful reversal.
The most reasonable scenario now is that BTC may stage a technical bounce toward $93,700 , but it is likely to encounter strong selling again and continue falling toward the major target around $76,800. Any upward move during this period is just a pullback to sell , not a signal of a real trend reversal.
In short, negative news + bearish technical structure are strongly aligned, so for short-term traders, it’s best to sell with the trend , wait for price to pull back before entering, and avoid catching bottoms when the market has no clear reversal signals yet.
TradeCityPro | BNB Pressure Point: Trendline vs. Market Mood👋 Welcome to TradeCity Pro!
In this analysis, I want to review the BNB coin for you, one of the most popular and well-known cryptocurrency exchanges, whose native token has a $115.97 billion market cap and is currently ranked 5th on CoinMarketCap.
⏳ 4-Hour Timeframe
On the 4-hour timeframe, BNB is in a downtrend, and its latest bearish wave started after breaking below the $900 zone, continuing down to the $808 level.
✨ There is also a curved descending trendline on BNB’s chart, which has now become very steep, and the price has reached this trendline.
⭐ If this trendline breaks, the correction could deepen, allowing the price to move toward higher zones.
But if BNB gets rejected from this trendline, the downward movement will continue.
✔️ The next short trigger we have is the break of the $808 level.
This is a very important support zone, and if it breaks, the price could fall toward the $747 level.
📊 Buying volume has been very low during this corrective phase, which shows the strength of the sellers. Therefore, a rejection from the trendline or a break below $808 can confirm the start of a new bearish wave.
💥 From a momentum perspective, the RSI is also making a small upward correction similar to the price.
The 19.83 level is the key RSI support.
📝 Final Thoughts
Stay calm, trade wisely, and let's capture the market's best opportunities!
This analysis reflects our opinions and is not financial advice.
Share your thoughts in the comments, and don’t forget to share this analysis with your friends! ❤️

LUMN preparing the next step or just warming upLUMN returned to the key accumulation zone near 6.63 and held above this support. The retest created a potential reversal structure on the daily chart. Divergence and increasing volume confirm the presence of demand. A breakout above 7.65 will confirm the beginning of an impulse toward 11.95 and later toward the extension area near 17.27.
L umen Technologies is a major provider of telecommunications and cloud services with a wide data center network. The company serves corporate clients and government institutions with a focus on network infrastructure cyber security and data transmission.
Fundamental picture as of November 23
Lumen maintains stable cash flow and continues to reduce its debt burden. Management improved its profit outlook. Network modernization reduces operational expenses and gradually increases margins. Corporate demand remains stable which supports long term recovery. Revenue growth remains moderate and is still affected by competition and legacy contracts.
Technical view
As long as the price stays above the zone near 6.30 the accumulation structure remains valid. A confirmed breakout above 7.65 will open the path toward 11.95 while a move above that level will allow development toward 17.27. The bullish scenario remains valid while price stays above demand.
Market mood
LUMN looks like the speaker who stayed silent for a long time then suddenly raised a hand. Now the audience listens.

TradeCityPro | Bitcoin Daily Analysis #229👋 Welcome to TradeCityPro!
Let’s dive into the Bitcoin analysis. Today, the market has made a deeper upward correction and is moving towards higher resistance levels.
⏳ 1-Hour Timeframe
After the downward move to the 82,214 zone, Bitcoin started a range and correction phase, and yesterday, it ranged between 82,214 and 85,209.
✨ After the price began to correct, a higher low was formed at 83,680, which allowed buyers to show some strength, and now the price has stabilized above 85,209.
✔️ This upward move continued to the 0.382 Fibonacci level, which I consider to be the first resistance level Bitcoin has reacted to.
⭐ If the price starts to drop from here and can stabilize below the 85,209 level, bearish momentum will return to the market, and we can get the first confirmation of a new downward wave.
🧮 The main confirmation for the start of this new wave will come after breaking the 82,214 level. Until then, any short position we open will be an early trigger.
🎲 Overall, Bitcoin has a very large support zone on the weekly timeframe, and this zone is between 75,000 and 90,000, where the price is currently located.
🔭 As long as the price is in this range, all positions are risky. Personally, I will reduce my risk, as traders’ win rates tend to decrease in such range-bound areas.
📊 For long positions, it’s still too early. I will wait until the price stabilizes above 89,604. This will be the first sign of buyer strength. The main confirmation for the bullish trend will come after stabilizing above 93,555.
❌ Disclaimer ❌
Trading futures is highly risky and dangerous. If you're not an expert, these triggers may not be suitable for you. You should first learn risk and capital management. You can also use the educational content from this channel.
Finally, these triggers reflect my personal opinions on price action, and the market may move completely against this analysis. So, do your own research before opening any position.

BITCOIN TRADE IDEA Waiting for btcusd to buy …will use a buy stop in order to catch the move to the upside as it’s been dropping for soo long and now needs to retest a fair amount to the upside

GOLD UPDATE Gold has been behaving well and it would be best to always close partial profits where necessary to help secure the profits , it has huge potential to the upside to the recent highs

BTC UPDATE Bitcoin has been going up here’s an update, you can close partial profits if necessary to avoid losing profits already made

FireHoseReel | BNB Daily Analysis #4🔥 Welcome FireHoseReel !
Let’s dive into the analysis of BNB (Binance Coin).
👀 BNB – 1H Timeframe
BNB is currently breaking through its multi-timeframe resistance around $842.
If price forms a higher low above this zone, we can take it as a valid confirmation for bullish continuation.
Keep in mind: the long trigger sits at $880, which makes this setup a bit risky.
📊 Volume Analysis
The volume indicator is showing rising multi-timeframe buy volume, which is different from previous behavior on the left side of the chart.
This suggests a healthy convergence of buying pressure, showing that sellers are weakening, market fear is fading, and investors are slowly stepping back in to accumulate at these levels.
✔️ BNB/BTC Pair Perspective To look at things differently, we also check the BNB/BTC pair, which helps us understand the structure more deeply.
The pair is still in the same condition as yesterday, with one difference:
The multi-timeframe resistance at 0.0991 could become a risky long trigger.
A breakout above this zone may push momentum into the BNB/USDT pair as well.
✍️ Let’s break down the trading scenarios for BNB on the 1H timeframe.
🔼 Long Scenario:
We need:
• Strong buyer support and increased participation
• Continued multi-timeframe volume convergence
• Breakout of key resistance zones on both BNB/USDT and BNB/BTC
If these conditions align, we can take a low-risk (0.5%) long entry on the breakout.
If needed, we can also add to the position on higher resistance breakouts.
🔽 Short Scenario:
A breakdown of the key support levels on the chart + clear selling pressure can give us a valid short or exit signal.
This breakdown may also require a break of USDT dominance resistance, which would strengthen the bearish move.
🛞 Risk Management & Disclaimer
Please remember to always use proper risk management and position sizing. Nothing in this analysis is financial advice. The market can change quickly, so always trade based on your own strategy, research, and risk tolerance. You are fully responsible for your own trades.

FireHoseReel | USDT.D 4H Analysis🔥 Welcome FireHoseReel !
Let’s jump into the Tether Dominance Analysis , one of the most Popular Crypto Index .
👀 USDT Dominance – 4H Timeframe
USDT dominance has reached a major resistance level after a very strong upward rally. At this point, I personally have a bearish bias, expecting a rejection and the completion of a multi-timeframe secondary trend. This view is also supported by my mentor, Arshia Azizpour.
📉 RSI Analysis
Since volume isn’t very reliable on dominance charts, we use the RSI oscillator instead.
RSI has just rejected from the 81 zone, which is a strong static resistance inside the overbought area.
This rejection suggests potential cooldown, pullback, or loss of momentum.
📌 Key Levels to Watch
USDT dominance currently has three major levels:
🔺 6.623% – major top resistance
🔸 6.427% – multi-timeframe trend-shift zone
🔸 6.148% – secondary multi-timeframe trend-shift zone
A clean break and candle close below these levels can give us a bearish bias on dominance, which naturally creates a bullish bias for crypto assets.
⚠️ Important Note
USDT dominance still has strong trend momentum.
If it breaks above the current top, it could trigger another wave of downward pressure on Bitcoin and altcoins.
Historically, these dominance spikes hit BTC and ETH the hardest, while altcoins don’t always fall as aggressively.
🛞 Risk Management & Disclaimer
Please remember to always use proper risk management and position sizing. Nothing in this analysis is financial advice. The market can change quickly, so always trade based on your own strategy, research, and risk tolerance. You are fully responsible for your own trades.

FireHoseReel | BNB Daily Analysis #3🔥 Welcome FireHoseReel !
Let’s dive into the analysis of BNB (Binance Coin).
👀 BNB – 1H Timeframe
On the 1-hour chart, BNB has formed a solid support around $808.17, right after the drop we mentioned in previous analyses.
Price also has a local resistance at $842.26, and a breakout on either side can give us confirmation for the next move.
However, going long from this zone is not ideal. A long setup would be more reasonable at higher levels during a pullback of this bearish leg — and for that, we need USDT dominance to reject downward.
📊 Volume Analysis
Looking at volume, one key detail stands out:
The multi-timeframe correction of this bearish move has come with decreasing buy volume.
If price moves back down and breaks the support again, we can look for a fresh short position.
✔️ BNB/BTC Pair Analysis Since we analyze things differently, let’s also check the BNB/BTC pair.
This pair is currently sitting on its own support and moving slightly upward.
But what matters is this: BNB/BTC seems to be forming a potential bearish pattern on this timeframe. If the structure completes, I’ll include it in the next analysis update for you.
✍️ Now let’s check the trading scenarios for BNB on the 1H timeframe.
🔽 Short Scenario
A short setup becomes valid if:
• BNB/BTC breaks below 0.009691,
• Confluence with BNB price breaking below $808.71,
• Increased sell volume,
• A clean candle close under the defined support zones.
This combination gives us a strong short trigger.
🔼 Long Scenario
A long setup requires:
• Breakout above $896,
• A few retests (rejections) into this zone,
• Followed by a confirmed breakout with increased buy volume.
This long scenario is still far from current price, and once BNB reaches that zone, I’ll post the best updated scenario for you.
🛞 Risk Management & Disclaimer
Please remember to always use proper risk management and position sizing. Nothing in this analysis is financial advice. The market can change quickly, so always trade based on your own strategy, research, and risk tolerance. You are fully responsible for your own trades.

TradeCityPro | FET: Will It Bounce at Support or Fall Further?👋 Welcome to TradeCityPro!
In this analysis, I want to review the FET coin , one of the crypto projects related to artificial intelligence, with a $635 million market cap, currently ranked 78th on CoinMarketCap.
⏳ 4-Hour Timeframe
On the 4-hour timeframe, this coin had an upward movement and then entered a correction phase, reaching an important PRZ support zone.
💡 The zone the price is currently testing is a very critical support area, which we had already identified in the chart. Additionally, this zone coincides with the golden Fibonacci zone.
✔️ Given the length of time the price has been correcting, we can confirm a trend change sooner and don’t need to wait for the main support at 0.2036 to be broken.
🔔 Currently, the selling volume is increasing, and the price has reached the lower bound of the box between 0.2638 and 0.3306.
🧮 There’s significant bearish momentum entering the market, and it can be said that the only reason some coins like FET are still holding above their support is Bitcoin’s dominance.
⚖️ If the price stabilizes below its support zone, we will confirm the bearish trend and can open a short position. The next support levels are 0.2340 and 0.2036.
💫 However, if the price rises and moves toward the upper bound of the box, breaking 0.3306, we can become optimistic about the coin’s upward movement again.
📝 Final Thoughts
Stay calm, trade wisely, and let's capture the market's best opportunities!
This analysis reflects our opinions and is not financial advice.
Share your thoughts in the comments, and don’t forget to share this analysis with your friends! ❤️

TradeCityPro | Bitcoin Daily Analysis #228👋 Welcome to TradeCity Pro!
Let’s move on to the Bitcoin analysis. After the sharp drop we had throughout the week, the market has finally calmed down today and is moving sideways.
⏳ 1-Hour Timeframe
After the strong downward move earlier this week, the market has made a small correction today.
✔️ This correction came after reaching the 82,214 support level, and as you can see, the buying volume during this correction is extremely low.
✨ This shows that buyers are very weak.
On the other hand, as you can see, the red candles are starting to show increasing volume again, and if this continues, we can open short positions using short triggers from the lower timeframes.
💥 The RSI oscillator bounced from its support yesterday and is now below the 50 level.
A rejection from this zone can introduce new bearish momentum.
🔔 The main short trigger right now is 82,214.
However, this trigger is very risky because it is close to a very strong support zone, and there is a high probability that buyers may attempt to enter the market there.
📈 For long positions, there is currently nothing to discuss, the market needs to form a proper bullish structure first.
Our confirmation for a bullish trend comes only after price stabilizes above 89,000, which is still very far from the current level.
💡 Right now, the price hasn’t even corrected up to the 0.382 retracement of the previous wave.
This alone shows that buyers have not entered the market yet.
So for long setups, we must wait until buyers return, show strength, and take control, and then we follow them.
❌ Disclaimer ❌
Trading futures is highly risky and dangerous. If you're not an expert, these triggers may not be suitable for you. You should first learn risk and capital management. You can also use the educational content from this channel.
Finally, these triggers reflect my personal opinions on price action, and the market may move completely against this analysis. So, do your own research before opening any position.

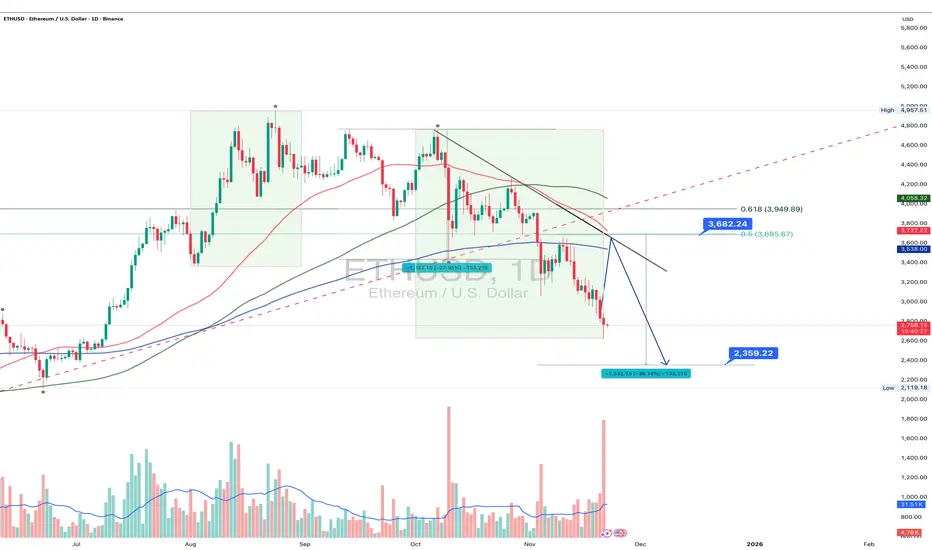
ETH 1D: correction unfolding or just a warm-up?Ethereum continues to trade within a clear bearish structure: after breaking below key daily moving averages, the decline accelerated, pushing the price into the 2720–2800 zone an area that previously acted as a short-term reversal cluster. The trendline from the recent top is broken, and a retest of the 3600–3700 resistance (0.5–0.618 Fib) remains the key scenario before any continuation of the downtrend. Only a confirmed breakout above 3700 would shift the structure back to bullish.
A deeper correction target sits around 2360–2400, where symmetry projections and previous accumulation zones converge.
Fundamental snapshot (Nov 22): network activity is stable, but downward pressure persists due to lower transaction fees and reduced validator revenue. Capital inflows remain weak, and ETH’s dominance continues to erode against L2 networks and alternative L1s. The market is waiting for strong catalysts such as real-world asset tokenization and institutional adoption. In the short term, sentiment leans neutral-to-bearish, supporting the probability of a move toward 2360–2400.
As long as ETH remains below 3600–3700, the bearish scenario holds priority. A breakout above 3700 would flip the structure, but current price action still favors continuation of the correction.
Ethereum is full of surprises - yet price levels tend to be much more disciplined than traders.
GOLD HIT TP XAUUSDGold acted well and held on to the structure, will keep trading simple and easy and wait for another opportunity

FireHoseReel | USDT Dominance & BTC Dominance Overview😄 Hey! How’s everything? Hope you’re doing great!
🍾 Welcome to FireHoseReel — make sure to follow and enjoy the analysis along the way.
If you ever want a custom chart breakdown, just leave a comment and I’ve got you.
😎 Let’s dive into the analysis of two major crypto dominances: USDT and Bitcoin.
✔️ USDT Dominance Technical Analysis
• On the 4-hour timeframe of USDT dominance, we can see that after repeatedly breaking through multiple resistance levels on the chart, USDT.D has reached a point of heavy overbought conditions. It’s now sitting at a strong resistance zone.
If this resistance breaks, USDT dominance could push even higher, which would bring additional downward pressure on the market, especially on Bitcoin and altcoins, leading to another wave of selling.
• If USDT dominance rejects from this zone and starts moving downward, the nearest support to be tested is around 6.148%. Losing this support would signal the beginning of the first bullish wave in the market, giving us a potential opportunity to start opening long positions once this level breaks down.
• Another key level is the resistance at 6.623%.
If USDT dominance breaks above this level, it could trigger an even stronger bearish wave compared to the previous one, causing a deeper correction across the market.
✔️ BTC Dominance Technical Analysis
• On the 4-hour timeframe of Bitcoin dominance, we can see that after the recent market drop, BTC.D also moved downward and went through a relatively deep correction.
What’s important here is that despite the decline in Bitcoin dominance, altcoins did not experience a heavy correction, and most of them held their levels without major downside movement.
• If Bitcoin dominance loses the 58.80% level, it could extend its correction even further.
However, the key reversal zone for the 4-hour trend lies at 59.31%. A breakout above this level can trigger a solid bullish wave in BTC.D.
• Our confirmation for this bullish wave would be the formation of a higher low above this resistance zone, signaling a potential upward trend continuation.
🛞 Risk Management & Disclaimer
Please remember to always use proper risk management and position sizing. Nothing in this analysis is financial advice. The market can change quickly, so always trade based on your own strategy, research, and risk tolerance. You are fully responsible for your own trades.

TradeCityPro | Bitcoin Daily Analysis #227👋 Welcome to TradeCity Pro!
Let’s dive into the Bitcoin analysis. The market is still very bearish and moving down rapidly.
⏳ 1-Hour Timeframe
Yesterday, the market continued its downward movement, and after breaking the 88,825 support, it made a very brief correction before breaking even the 83,333 level.
⭐ The support level we had for the RSI was 21.53. As you can see, RSI reacted to this level, and after its correction, it has now reached this area again.
🧮 From a momentum perspective, the market is highly bearish, and the movement has been very sharp. Volume is fully confirming the downtrend, and I believe after this sharp decline, we could see the start of a correction phase.
💥 We have a very important support zone at 80,000, where the price could move towards and potentially enter a corrective phase. However, in any case, I think the market has made its move, and for the downtrend to remain healthy, a correction is needed.
✅ At the moment, we can’t provide a trigger for a new position since the market has moved so sharply, like a speeding train. It’s better to wait and then hop on once the correction has started.
📊 For long positions, it’s clear that the market is still in a downtrend, and there is no structure supporting a long position. We’ll consider opening a long position only once the trend changes.
❌ Disclaimer ❌
Trading futures is highly risky and dangerous. If you're not an expert, these triggers may not be suitable for you. You should first learn risk and capital management. You can also use the educational content from this channel.
Finally, these triggers reflect my personal opinions on price action, and the market may move completely against this analysis. So, do your own research before opening any position.

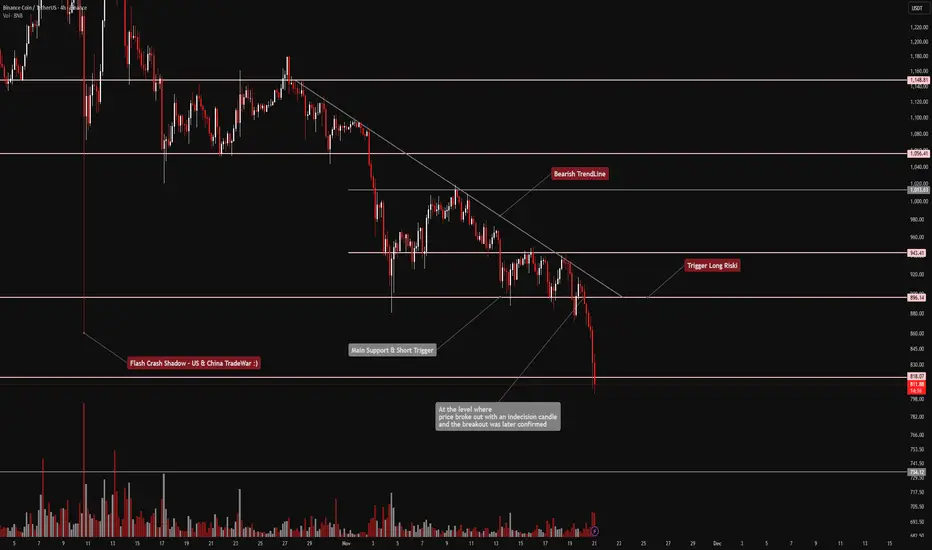
FireHoseReel | BNB Daily Analysis #2😄 Hey! How’s everything? Hope you’re doing great!
🍾 Welcome to FireHoseReel — make sure to follow and enjoy the analysis along the way.
If you ever want a custom chart breakdown, just leave a comment and I’ve got you.
😎 Now let’s jump into the analysis of my favorite coin: BNB .
👀 BNB – 4H Timeframe
BNB recently gave us a short trigger on the 4-hour chart after breaking its key support at $896. Price dropped right toward our first target at $818, hit it cleanly, and is now stuck in a “mid-zone” with no clear direction.
Even on a multi-timeframe view, we currently don’t have any valid entry trigger, so we need to wait for new structure formation before planning the next move.
📊 Volume Analysis
Our volume indicator played a major role here:
Once the support broke and the short trigger activated — exactly as mentioned in yesterday’s analysis — sell pressure increased sharply.
Whales also started selling their BNB as soon as the support failed, and many traders used this opportunity to enter short positions.
Volume is still showing bearish pressure, and the last two 4H candles had a strong increase in selling activity, turning into clear downward momentum.
✔️ Now let’s analyze something different — BNB/BTC pair
On the 4H timeframe, this pair is still moving inside its trading range and has managed to maintain its relative strength against BTC.
However:
• A breakout above the range high at 0.010162 could trigger a strong bullish move
• A breakdown below the range low at 0.009800 could lead to a deeper correction in the BNB/USDT pair and accelerate the bearish momentum there
For now, the pair holds a bullish bias, but we need confirmation through an actual breakout.
✍️ Current Scenarios
We don’t have a new setup today, as yesterday’s short position already played out and is still valid.
For a new entry — long or short — we need BNB to build a fresh market structure and give us a clean trigger.
Until then, patience is the best strategy.
🛞 Risk Management & Disclaimer
Please remember to always use proper risk management and position sizing. Nothing in this analysis is financial advice. The market can change quickly, so always trade based on your own strategy, research, and risk tolerance. You are fully responsible for your own trades.
DECODED ANALYSIS OF NVIDIANVIDIA is currently in its second last quarterly pattern. After correcting its uptrend form, to restore this pattern the price must either move above $213.99 or hold the support levels at $158.96, $156.29, with major support at $151.05.
Broken pattern support, $106.90
Quarterly skip support, $27.51
Multiple skip supports, lowest at $0.0385
Above current resistance levels are $213.99, $229.61, $250.86, $269.46
Resistance noted for 2030 at $618.83
This message is for educational purposes only.
Always DYOR.

XAUUSD PROFITABLE Gold had behaved accordingly and hit take profit, next move can be to wait and relax for it to play out before executing
BTC 1W: preparing a reversal or just stretching the correction?Bitcoin trades in the 85,500–86,000 area, moving steadily toward the key weekly MA100 around 83,200 - the primary dynamic support of this cycle and the level where prior corrections have consistently formed bullish reactions. As long as price respects the lower boundary of the rising channel, BTC maintains a controlled corrective structure: liquidity is being taken below local lows, setting up the conditions for a rebound into the major 104–109K supply zone. This area remains the central mid-term target for recovery, aligning with the 0.5–0.618 Fibonacci cluster, the upper boundary of the previous distribution range and the zone of prior large-scale selling.
Fundamentally as of November 21, the market is shifting from euphoria into redistribution: ETF and institutional flows have slowed, large holders are taking profits, and a strong dollar alongside elevated real rates is pressuring risk assets. Network strength remains intact - hashrate near all-time highs and miners still expanding capacity - even though their margins are tightening. This is a typical late-stage cycle environment: short-term downside pressure with long-term trend strength preserved.
As long as BTC has not yet touched the MA100, the base scenario remains a dip into 83K followed by a rebound toward 104–109K. A breakout above 110K restores bullish continuation, while a loss of 80K accelerates the move toward 70–75K and the weekly MA200. This correction is not the end of the cycle - it’s a cooling phase after an overheated expansion.
Bitcoin does what it always does: terrifies everyone near MA100, then moves exactly when most have given up waiting.

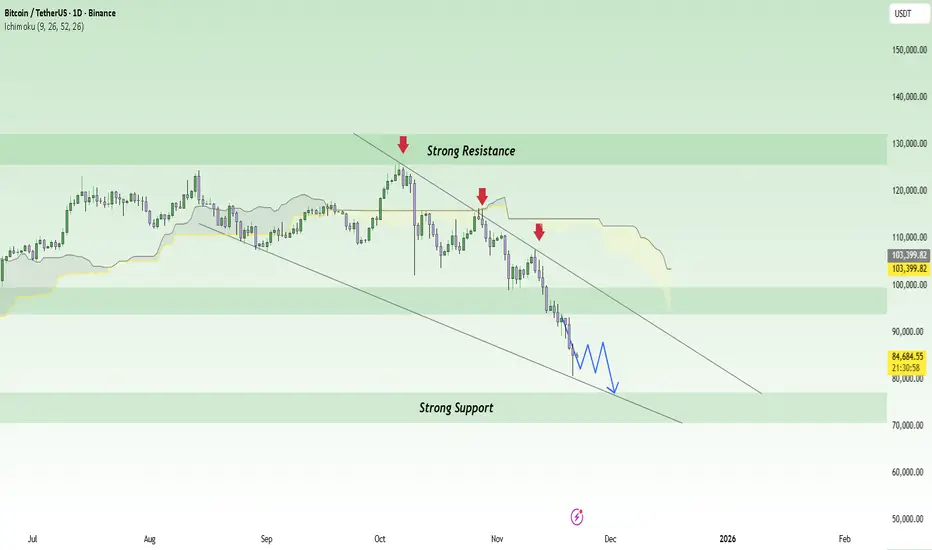
Bitcoin Approaching the $80,000 Level?Bitcoin has dropped below $90,000 for the first time in nearly seven months, as uncertainty surrounding the Federal Reserve's interest rate path, coupled with delayed economic data, has reduced demand for riskier assets like Bitcoin. This has led to continued strong selling pressure on Bitcoin.
On the chart, Bitcoin is moving in a clear downtrend, with consecutive lower highs and lows. Bitcoin has broken through previous support levels and is now testing lower price levels. In particular, the downward trendlines and the strong resistance at 90,000 USD are key factors in determining the trend.
The current price is near an important support level at 84,200 USD. If Bitcoin fails to hold this level, the likelihood of further declines towards 80,000 USD is high, with the next support level in this range.
Trade Strategy Recommendations:
Sell: When Bitcoin faces resistance at 90,000 USD or 96,500 USD, with targets at 84,200 USD and 80,000 USD.
Buy Against the Trend: Consider buying if the price drops significantly and shows signs of recovery from 80,000 USD, with short-term trades and low-risk exposure.

BTC DECODED ANALYSIS REMINDER UPDATES BTC decoded analysis next support, Monthly support is noted at $68,021.7 before BTC tests the quarterly support at $62,772.02.
These supports were updated on Binance on May 27th, 2025, with a brief detailed reminder updated again on October 29th, 2025.
These decoded analysis details are also mentioned in my pinned post.
All my analysis is based on actual fact based skip supports with no predictions.
This message is for educational purposes only, Always DYOR.
