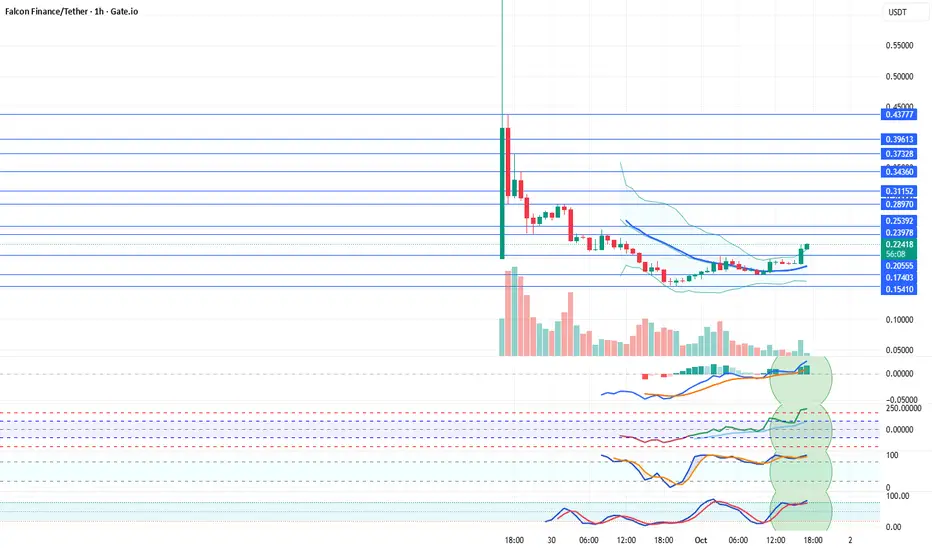
FFUSDT 1 Hour Technical AnalysisFFUSDT 1 Hour Technical Analysis
Falcon Finance Coin has risen above its 21-day moving average. After the sharp decline following its listing, it now appears to be recovering. Having broken above the 0.20555 resistance, we believe Falcon Finance Coin may continue its upward movement if indicators remain positive. Resistance levels will be monitored closely.
Resistances: 0.2397 – 0.2539 – 0.2897 – 0.3115 – 0.3436 – 0.3732 – 0.3961 – 0.4377
Supports: 0.2055 – 0.1740 – 0.1541
We’d appreciate it if you 🚀 rocket our posts. Also, don’t forget to share them on your social media accounts.
Legal Disclaimer:
The information, comments, and recommendations provided here do not constitute investment advisory services. Investment advisory services are offered within the framework of an investment advisory agreement to be signed between the client and brokerage firms, portfolio management companies, or non-deposit banks. The content shared on this page reflects only personal opinions. These views may not be suitable for your financial situation, risk profile, or return preferences. Therefore, no investment decisions should be made based on the information provided here.
Tradingview
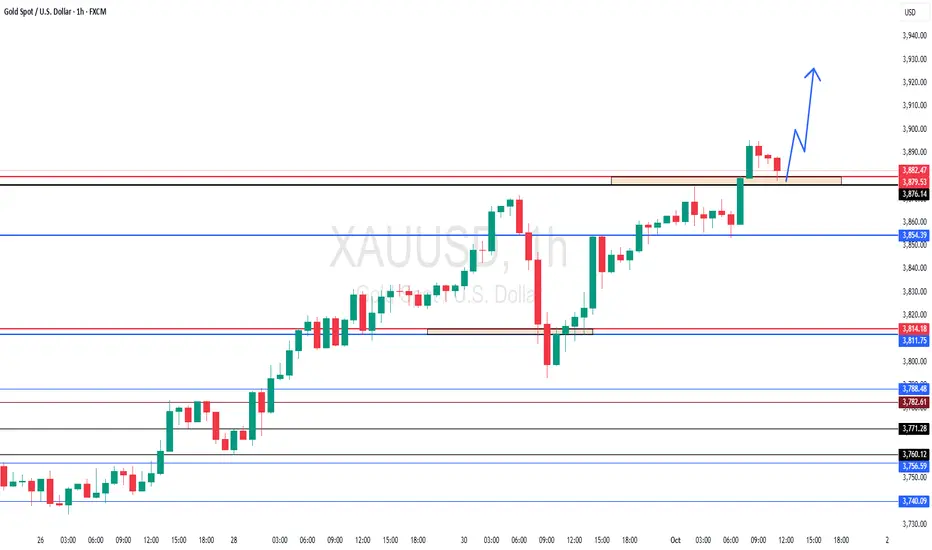
GOLD at immediate Support ? whats next??#GOLD.. perfect move as per our couple of ideas regarding gold and now again market make a immediate supporting area that is around 3876 to 3880
keep close that region and if market staying above that means there is further roam to upside,.
good luck
trade wisely
TradeCity Pro | XRP: Key Support and Resistance Zones Testing👋 Welcome to TradeCity Pro!
In this analysis, I will review the XRP coin. One of the oldest crypto projects, XRP aims to align crypto transactions with the SWIFT system. The coin has a market cap of $173 billion and is ranked 4th on CoinMarketCap.
📅 Daily Timeframe
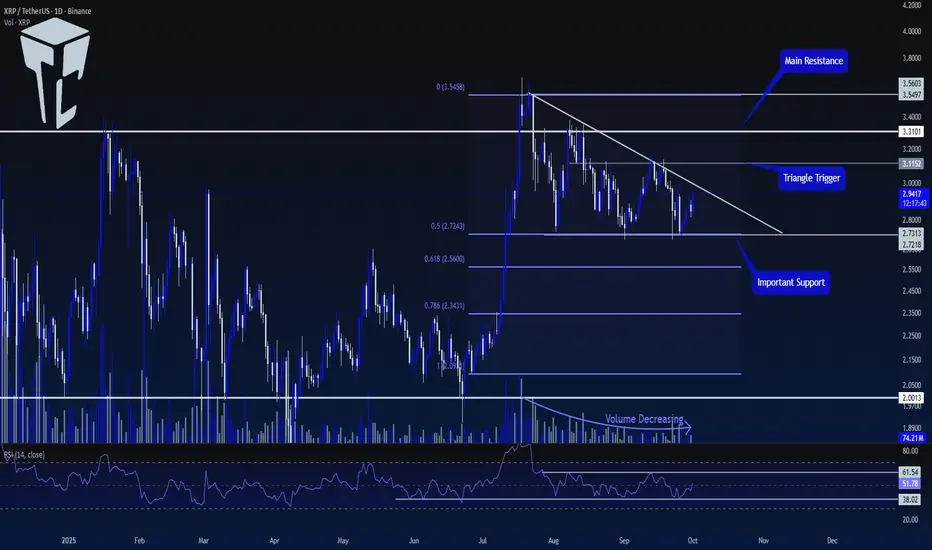
After getting support at the 2.0013 level, XRP made a bullish move up to the 3.5603 resistance. Now, it has formed a descending triangle, and the volume has been decreasing as the price moves down.
⚡️ Currently, a crucial support zone has formed at 2.7218, which overlaps with the 0.5 Fibonacci level, forming a PRZ for us.
🧩 A descending trendline has also been created, and the price has touched it several times, making lower highs.
📊 To confirm the next bullish move for this coin, the first confirmation we need is the breakout of the trendline. The trendline breakout trigger is at 3.1152.
✨ Once this level is broken, we can open a long position. This trigger is the first long position trigger and is considered risky since we haven't yet received the main confirmation for a bullish trend.
🔍 The main trigger for the start of a new bullish trend is the breakout of the 3.3101 level. Breaking this level could start a new upward move for XRP.
💥 A very important confirmation for both long and short positions on the RSI is the breakout of the range between 38.02 and 61.54.
🎲 As long as the RSI remains between these two levels, the probability of hitting stop losses is high. Therefore, for a long position, we can wait for the 61.54 level on the RSI to be broken.
🔽 For a short position, the 38.02 level on the RSI is a good momentum trigger. We can also use the 2.7218 level as a trigger, but keep in mind that the main market momentum is bullish, so this short trigger is considered risky.
📝 Final Thoughts
Stay calm, trade wisely, and let's capture the market's best opportunities!
This analysis reflects our opinions and is not financial advice.
Share your thoughts in the comments, and don’t forget to share this analysis with your friends! ❤️
HIMS 1D: time to heal the trend?On the daily chart, Hims & Hers Health is testing a descending trendline, while MA50 and MA200 provide strong support from below. Buyers are clearly in control. The highlighted buy zone sits around $54.40, but the real signal comes only after a confirmed breakout and retest of the trendline.
Technically , the targets are set: first stop at $73.23, then $86.64, and if momentum holds, the extension points to $103.69. That would mark a strong continuation of the bullish move.
From the fundamental side, the company keeps expanding its product portfolio and growing its presence in telehealth — a sector known for resilience even during market turbulence.
The tactical play: wait for the breakout and retest, then ride the bullish wave.
Just don’t confuse HIMS with a real doctor - if you ask for a prescription for profits, all you’ll get is a smile.

U.S. Government shuts down; Crypto rallies on uncertaintyU.S. Government shuts down; Crypto rallies on uncertainty
The U.S. government officially shut down on October 1, 2025, after Congress failed to agree on a budget. Disputes over spending and healthcare left agencies including the Fed, SEC, and CFTC paralyzed, delaying jobs and inflation data as well as ETF approvals for Solana and XRP.
Bitcoin, Ethereum, and other cryptocurrencies gained on Wednesday, with ETH up 4.2% to $4,330. Analysts said digital assets may be benefiting from pressure on the U.S. dollar, often seen as a trigger for crypto inflows.
Still, a prolonged shutdown could stall Fed rate-cut hopes by blocking key data releases. With borrowing costs already high, cryptos could face headwinds if the impasse drags on.

BTCUSDT Cut n Reverse Area? what's next??#BTCUSDT - perfect holdings upside as we discussed in our last idear regarding Bitcoin and now market just reached at his ultimate area/region, that is around 107500-700
keep close that region because that is market full n final region for buyers.
dont hold your buying positions below that.
NOTE: we will go for cut n reverse below that that region.
good luck
trade wisely

FFUSDT Coin 15 Min. Technical AnalysisFFUSDT Coin 15 Min. Technical Analysis
Falcon Finance, a newly listed coin on the exchanges, is currently moving sideways in the 15-minute technical analysis. As long as it is priced above the 0.239 support, there may be a possibility to test the 0.507 resistance in the future.
Resistances: 0.2897 - 0,3115 - 0,3436 - 0,3732 - 0,3961 - 0,4377 - 0,5071
Supports: 0,2397 - 0,2000
We would appreciate it if you rocket our posts. Also, don’t forget to share on your social accounts.
Legal Disclaimer:
The information, opinions, and recommendations contained here do not constitute investment advice. Investment advisory services are provided within the framework of an investment advisory agreement to be signed between clients and brokerage firms, portfolio management companies, or non-deposit banks. The content written on this page only reflects personal views. These views may not be suitable for your financial situation, risk, and return preferences. Therefore, investment decisions should not be made based solely on the information and writings here.

TradeCityPro | Bitcoin Daily Analysis #184👋 Welcome to TradeCity Pro!
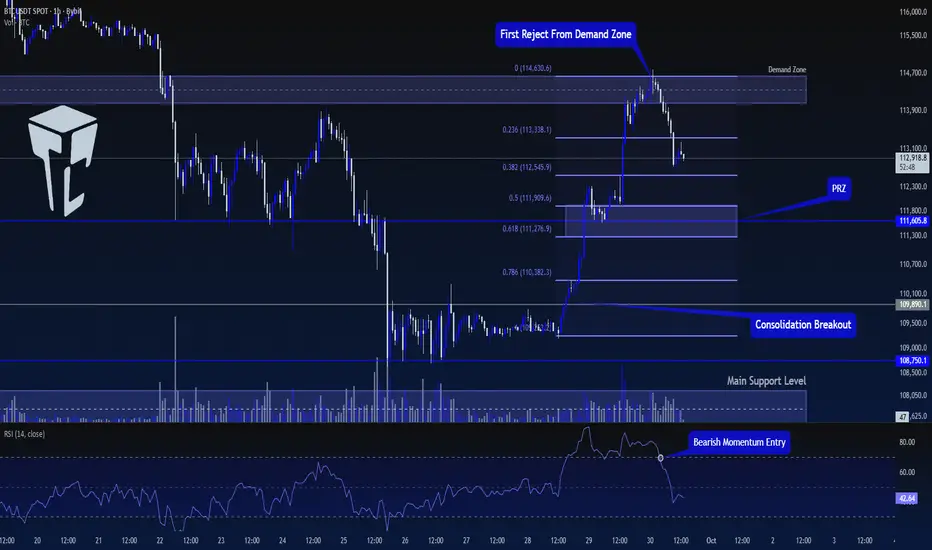
Let's go over the Bitcoin analysis. Yesterday, the price got rejected from a resistance zone, and today, it has started a corrective downward movement. Let's review the market together.
⏳ 1-Hour Timeframe
Yesterday, after the price reached the resistance zone, I mentioned that if the RSI exits the Overbuy zone, we could take profits.
📊 This is exactly what happened. After the price was rejected from the zone, the RSI moved out of the Overbuy zone and started heading downward.
⭐ Currently, the price correction has continued towards the 0.382 Fibonacci level. The trading volume during this correction has not decreased, which indicates that sellers are still active in the market, and their trading volume is not significantly lower than buyers.
🎲 If the price continues its correction and the volume increases at the same rate, the likelihood of a trend reversal and the start of a new downward trend becomes much higher. However, if the volume decreases simultaneously with the correction, the range between the 0.5 and 0.618 Fibonacci levels will be a very important support zone, and the price could find support there.
🔼 For a long position, the trigger we currently have is the breakout of the resistance zone. If we wait for the price to touch this zone a few more times, we can draw the exact numbers for the range and open our position upon its breakout.
⚡️ For a short position, it's better to wait and get confirmation of a bearish trend before looking for triggers. We will confirm the bearish trend if the selling volume increases and lower highs and lows are made.
❌ Disclaimer ❌
Trading futures is highly risky and dangerous. If you're not an expert, these triggers may not be suitable for you. You should first learn risk and capital management. You can also use the educational content from this channel.
Finally, these triggers reflect my personal opinions on price action, and the market may move completely against this analysis. So, do your own research before opening any position.
TradeCityPro | LINK Coin Testing Key Resistance👋 Welcome to TradeCity Pro!
In this analysis, I'll be reviewing the LINK coin. It’s one of the popular RWA crypto projects with a market cap of 14.56 billion dollars, ranked 13th on CoinMarketCap.
⏳ 1-Hour Timeframe
In the 1-hour timeframe, after a downward movement, this coin has formed a large range box with the upper boundary at $22 and the lower boundary at $20.02.
📊 Currently, after getting support at the lower boundary of the box, the price has moved upwards in two legs toward the $22 level and has now reached it.
🧩 The price has reacted to this level before, and it has significant strength. It can be viewed as a Maker Seller zone.
✨ We can confirm the bullish trend of LINK after breaking this level. Before breaking this level, opening a position is risky, and if we want to open a position, we need to pay close attention to risk and capital management.
✅ In the upward movement towards the top of the box, a divergence has formed in the RSI. We can confirm this divergence activation by breaking the 40.91 level in the RSI. For the price itself, we can confirm a bearish trend by stabilizing below 21.25.
📉 For a short scalp position, we can enter with the break of 21.25. But be cautious, as this position is very risky, and if you open it, make sure to take profit with low-risk-to-reward ratios because the market momentum is not fully in our favor, and the chance of volatile fluctuations is high.
🔔 For a long position, the best trigger is the breakout of the top of the box. If the price touches this level multiple times, we can find an accurate trigger for the breakout, and in subsequent touches, we can enter with the breakout.
📝 Final Thoughts
Stay calm, trade wisely, and let's capture the market's best opportunities!
This analysis reflects our opinions and is not financial advice.
Share your thoughts in the comments, and don’t forget to share this analysis with your friends! ❤️

HUMAUSDT - shiny coin!3d chart showing a breakout of descending channel after 120days of consolidation ... retest is running
patience must be rewarded.
Best regards:
Ceciliones🎯

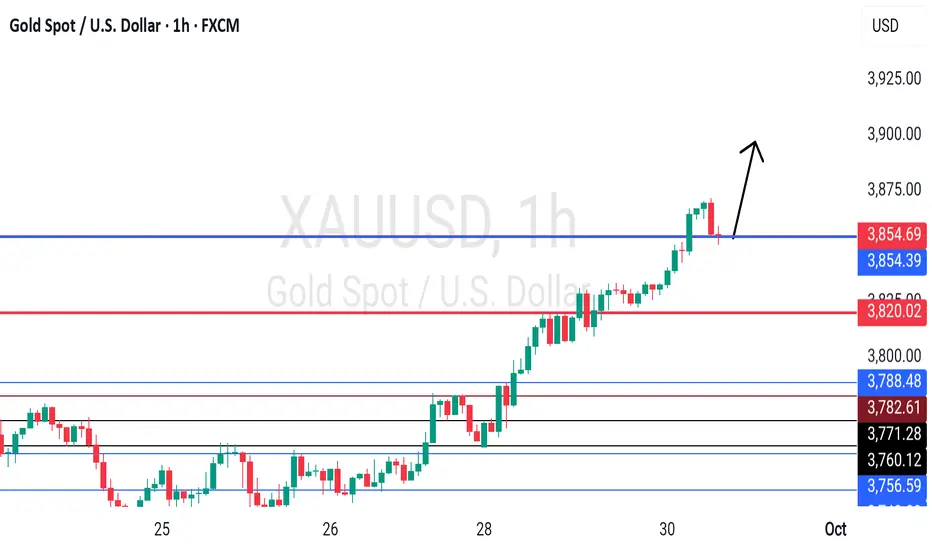
GOLD at Immediate support ? What's next?#GOLD.. perfect move as per our last idea and now again. Market just above his current time diate supporting area, tha tis around 3852-53
Keep close and if market stay above than further rise on the table.
GOOD LUCK
TRADE WISELY
BABA: triangle with tensionOn the weekly chart, BABA has already formed a golden cross - price is above both MA50 and MA200, confirming a bullish trend shift. The stock is now approaching the upper edge of the symmetrical triangle and the key resistance at $122, which also aligns with the 0.5 Fibonacci level.
The numbers inside the triangle represent the contraction phases, not Elliott waves. This is a classical consolidation before a potential breakout. If the $122 level is broken and retested, upside targets are $128 (0.618), $137 (0.786), and eventually $148–181 (1.0–1.618 extension).
Volume is rising, MACD is flipping bullish, and RSI is climbing out of oversold territory — all signs point to growing bullish momentum.
Fundamentally, Alibaba benefits from China's economic rebound, possible regulatory relief, and ongoing share buybacks. With Chinese tech rotating back into favor, BABA could lead the rally.
So if you're still waiting for a signal - it's already here. The golden cross is done, price is flying above moving averages, and all that’s left is a clean breakout. Watch $122 — that’s the launchpad.

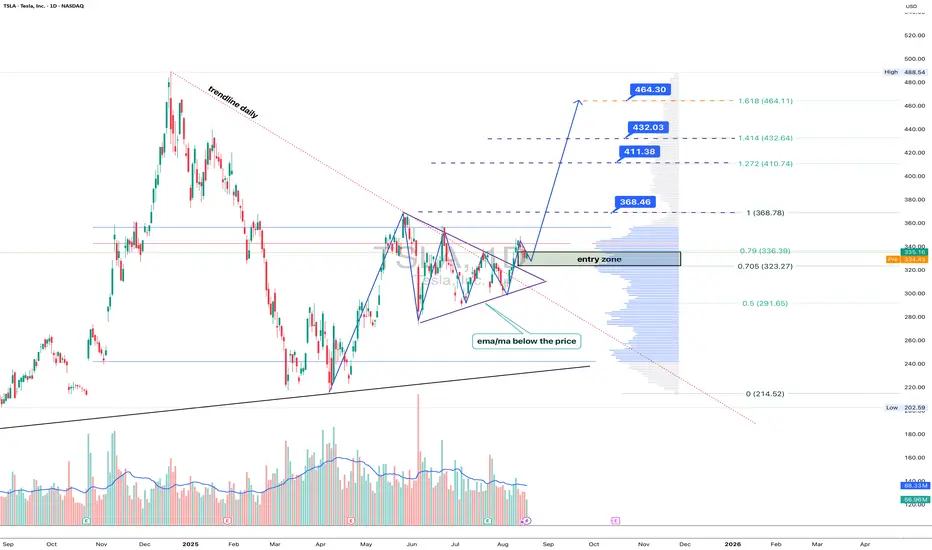
Tesla: breakout mode, Elon’s rocket fuel for the chartTechnically , Tesla broke out of a symmetrical triangle while holding above EMA/MA supports, which confirms bullish control. The breakout unlocks targets at 368.46 (Fibo 1), followed by 411.38, 432.03, and the 1.618 extension at 464.30. Volume profile confirms strong accumulation below, leaving the upside path less crowded.
Fundamentally , Tesla keeps investor attention alive. EV sales stabilized, but the focus has shifted to AI and robotaxi — Musk’s latest promises of disruption. With Fed rates peaking and yields easing, growth stocks regain momentum. Risks remain from Chinese competitors, yet Tesla’s margins are still leading the industry.
Tactical plan : entry zone stands at 323–336. As long as price holds above it, buyers target 368.46 → 411.38 → 464.30. A break below 323 would flip the bias back toward 291.
Bottom line: Tesla’s chart looks ready for lift-off. Musk might be dreaming of Mars, but for now, bulls are happy if he just launches the stock a few hundred dollars higher.
DUOL - NOT FOR TREND-FOLLOWING TRADERS DUOL - CURRENT PRICE : 271.28
Duolingo, Inc. (DUOL) is in a downtrend since 14 May 2025. The stock has recently tested the support level near USD 263, which coincides with a previous demand zone. This bounce from support highlights buying pressure, indicating the likelihood of a short-term reversal.
The Relative Strength Index (RSI) has moved near 30 level, signaling that the stock is in oversold territory. Oversold conditions often precede a technical rebound as selling pressure eases.
The confluence of oversold momentum and price stabilization at support suggests a possible bounce play. If buying volume increases, the stock could recover toward USD 297 – 325, its next resistance zone.
ENTRY PRICE : 271.00 - 272.00
TARGET : 297.00 and 325.00
SUPPORT : 260.00 (CUTLOSS below 260.00 on closing basis)
Notes : As the dominant trend is clearly bearish (downtrend) since 14 May 2025, this setup is not for trend-following traders.

TradeCityPro | Bitcoin Daily Analysis #183👋 Welcome to TradeCity Pro!
Let's dive into today's Bitcoin analysis. The market has had an upward movement. Let's see what's ahead in the market.
⏳ 1-Hour Timeframe
Yesterday, I mentioned that there was a high probability of movement and that it would be a good idea to keep an eye on the chart during the New York session as the market could move.
📊 With the start of the New York session, good buying volume entered the market, and after breaking 109890, Bitcoin started an upward wave.
🔑 The first area where the price could have faced resistance was 111605, which was broken on the first attempt. After a pullback, the next leg started.
🚀 The break of 109890, along with RSI entering Overbuy and the entry of buying volume, was a good trigger for a long position, and we could have opened a position with it.
⭐ Now, the price has reached a very important resistance zone, and the probability of a correction starting is high. For taking profit, I suggest you lock in profits whenever RSI exits the Overbuy zone, as this will reduce the upward momentum and increase the chances of a correction.
📈 For new positions, no triggers are available yet, and it's better to wait until the market gives us a clearer structure. However, if the price reacts several times to the level, we can open a long position in subsequent attempts if it breaks.
❌ Disclaimer ❌
Trading futures is highly risky and dangerous. If you're not an expert, these triggers may not be suitable for you. You should first learn risk and capital management. You can also use the educational content from this channel.
Finally, these triggers reflect my personal opinions on price action, and the market may move completely against this analysis. So, do your own research before opening any position.

GOLD's Situation, A Comprehensive Analysis ! (XAUUSD)In my opinion, the price will rise to around $4000 and then enter a corrective wave. Currently, the price is forming the third upward wave, which I have estimated using technical analysis. These upward waves will continue up to around $4000, and after this rise, the price could decline toward the PRZ (Potential Reversal Zone). However, this price correction depends on the breakout of the wedge pattern.

LTC 4H Analysis - Key Triggers Ahead☃️ Welcome to the cryptos winter , I hope you’ve started your day well.
⏰ We’re analyzing LTC on the 4-Hour timeframe .
👀 After the sharp and deep drop that Litecoin experienced in 3 candles, it moved toward its key support in the $102 area and was well supported from this zone. Then it formed a higher low and higher high compared to its previous low and high, and it is now moving to break its resistance in the $107 area. With a 4-hour confirmation on this zone (the taker-seller and key resistance), it can move upward.
🧮 Two key zones are considered for the RSI oscillator: the 63 level, which is close to the 70 zone—if the volatility crosses this level, Litecoin can move toward overbought. The second zone is the entry threshold into oversold.
🕯 The size and volume of the candles in the recent drop, which can be considered a price correction, are really significant and large. Scattered sell orders are placed above the area we marked, which causes our green candles below this zone to appear a bit smaller. To break the specified taker-seller area, we need a large candle with relatively high volume that fully confirms (stabilizes) on this zone to shape our bullish and high-momentum trend.
💸 BINANCE:LTCBTC is bearish against the Bitcoin pair and has not turned bullish yet, but it is positioned a bit above its support floor. With a breakout of the taker-seller zone in the USDT pair, the Litecoin/Bitcoin pair might also turn bullish, which would increase the movement momentum and the size of the candles.
🧠 For a Litecoin long position, we have to wait until we confirm above this taker-seller area with a strong whale candle and then examine the available scenarios for the breakout.
↗️ Long position scenario: breaking the taker-seller area and key resistance at $107 along with whale candles, and then observing a multi–time frame indecision candle, which will also give us a smaller stop size.
📉 Short position scenario: if the market wants to give a heavy and strong correction, the $102 area can be a good zone for a floor break and a short position on this coin—but the important point for us is that Litecoin is about to start a good bullish trend.
❤️ Disclaimer : This analysis is purely based on my personal opinion and I only trade if the stated triggers are activated .

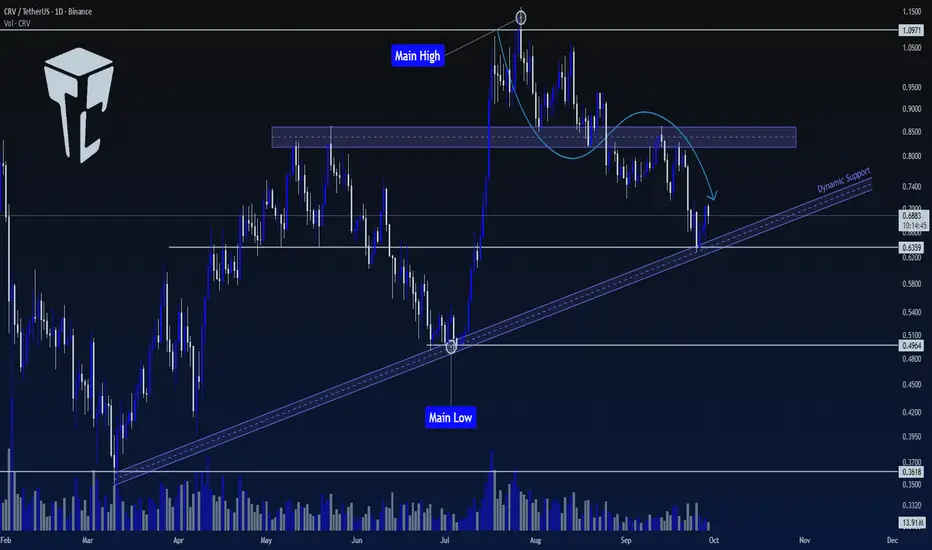
TradeCity Pro | CRV Testing Key Support Zone for Trend Reversal👋 Welcome to TradeCity Pro!
In this analysis, I will be reviewing the CRV coin, one of the popular DEXs, with a market cap of $954 million, currently ranked 81 on CoinMarketCap.
📅 Daily Timeframe
In the daily timeframe, this coin is in an uptrend with a trendline, and the price has currently reached it.
🔍 In higher cycles, the trend of this coin is bullish. However, in lower cycles, after being rejected from 1.0971, a downward movement has started, and it has corrected to the 0.6359 level.
✔️ This level is currently overlapping with the trendline and forms an important support zone.
✨ If this PRZ zone breaks, we can confirm the bearish reversal for CRV, and a short position can be opened. This trigger is one of the first signals for a trend change, and the main trend change will be confirmed after breaking 0.4964.
📈 For a long position, we will have to wait until a proper bullish structure is formed. If the price moves sharply, we will confirm the bullish trend after stabilization above the zone.
❌ Disclaimer ❌
Trading futures is highly risky and dangerous. If you're not an expert, these triggers may not be suitable for you. You should first learn risk and capital management. You can also use the educational content from this channel.
Finally, these triggers reflect my personal opinions on price action, and the market may move completely against this analysis. So, do your own research before opening any position.
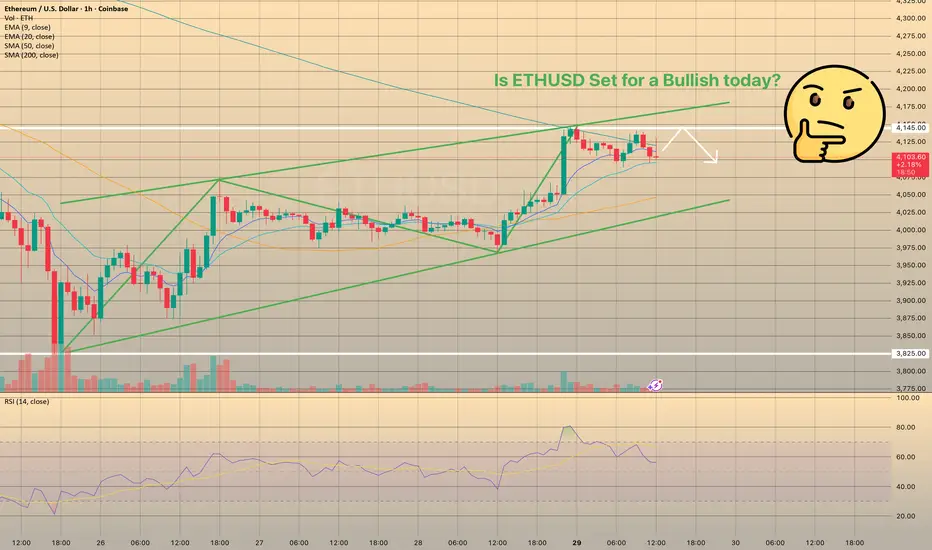
Ethereum outflows point to bullish setup above $4KEthereum outflows point to bullish setup above $4K
Altcoins are surging, and Ethereum has reclaimed the spotlight after crossing the key $4,000 mark. Trading volume is rising, and ETH is holding steady near $4,100 after a relatively calm weekend, suggesting stability following last week’s volatility. Analysts view $4,000 as a crucial support level—if bulls defend it, ETH could soon retest higher levels.
One factor supporting this outlook is a steady decline in Ethereum balances on spot exchanges. A CryptoQuant report shows coins are being withdrawn into self-custody and staking, reducing sell-side liquidity. Historically, such outflows have set the stage for rallies as demand absorbs limited supply.
Short positioning also adds fuel: more than $11 billion in shorts could be forced to cover if ETH breaks above $4,200, potentially accelerating gains.
Still, analysts warn that supply constraints alone aren’t enough—strong buyer inflows are needed to sustain momentum. The next few days will be key, with ETH’s ability to hold above $4,000 serving as a test for the next leg of the rally.
U.S. Natural Gas holds near 10-week highsU.S. Natural Gas holds near 10-week highs
U.S. natural gas futures hovered around $3.20/MMBtu, a ten-week high, supported by lower output. Production in the Lower 48 slipped to 107.4 bcfd in early September from a record 108.3 bcfd in August. The earlier supply surge fueled large storage injections, leaving inventories 6% above the five-year average and 1% higher year-over-year.
On the demand side, forecasts call for above-normal warmth into early October, while LNG feedgas flows averaged 15.7 bcfd—slightly below August levels.
Longer-term risks remain. Global LNG capacity is projected to expand 60% by 2030, with half of the new supply coming from the U.S. This raises the threat of oversupply, potentially pressuring prices in Asia and Europe. Still, strong domestic demand—driven by slower renewable deployment and rising AI-related power needs—may lend support to U.S. prices.
In Europe, gas inventories stand at 82.3% capacity, with France and Italy above 90% and Germany at 76.6%. Softer Asian demand due to milder cooling needs has freed up cargoes for Europe, helping push prices lower.
Geopolitical risks remain in focus. NATO–Russia tensions and potential sanctions on Russian energy—including Europe’s ban on seaborne imports by 2027—could disrupt supply and limit downside.

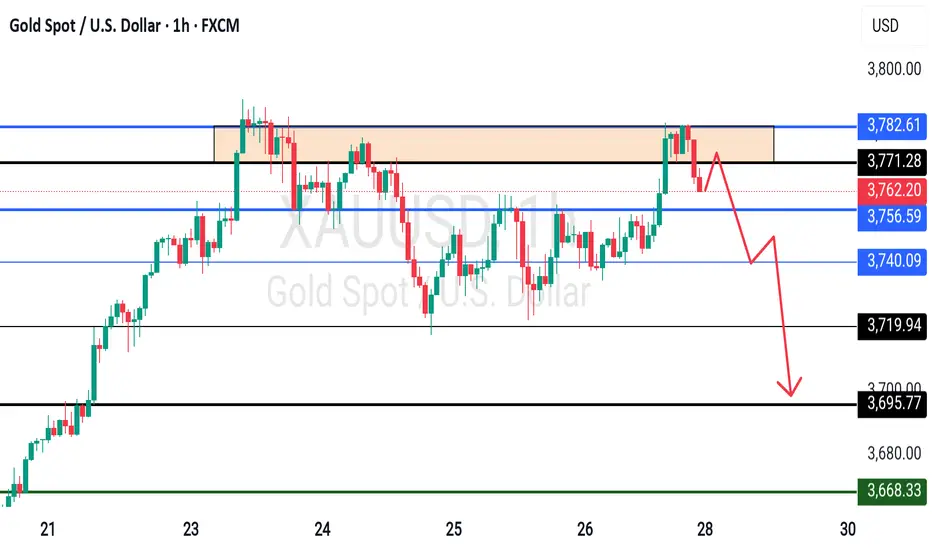
GOLD High placed? What's next??#GOLD.. market placed a very reasonable high so far and now going to break his supporting area.
Kep close upside region that can play major role in next move.
Don't be lazy here.
NOTE: we will go for cut n reverse above region not before that.
Good luck
Trade wisely
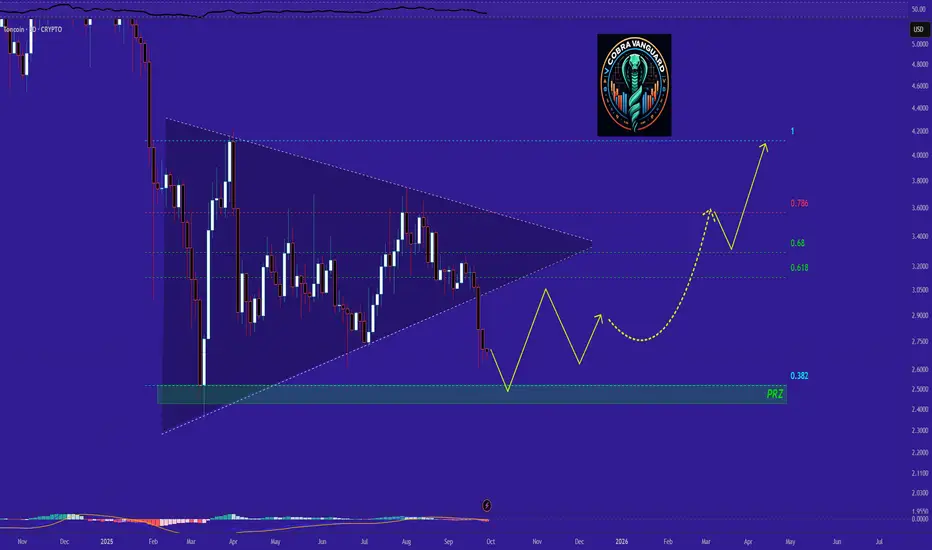
My only remaining hope for Toncoin !!!My only remaining hope for Toncoin is this PRZ. If the price holds this level, it could rise above $3 otherwise, you know what will happen if this level breaked...
TradeCityPro | Bitcoin Daily Analysis #182👋 Welcome to TradeCity Pro!
Let’s move on to Bitcoin analysis. Today the weekly candle closes, and from tomorrow the market can start moving again.
⌛️ 4-Hour Timeframe
On the 4-hour chart, Bitcoin has started a downward move from the 117,570 high, dropping in two bearish legs down to the 108,750 zone.
✨ After reaching this area, volume began to decrease—both because the market is ranging and because it’s the weekend.
✔️ Yesterday, in my analysis, I highlighted a range box on the 1-hour chart. This same box is still visible now on the 1-hour timeframe, spanning 108,750 to 109,890.
🧩 Today’s New York session is very important, since this session often drives weekend market moves. So watch the market carefully,our triggers might get activated.
🔑 If strong volume enters today and 108,750 breaks, we can look to open a short position. However, keep in mind there’s an important support area just below this level that could prompt a reaction and halt further decline.
⭐ For a long position, the first trigger we have is a breakout of 109,890. But note that the short-term trend is still bearish, so it’s better to wait for bullish confirmation first. A clean break of 109,890, followed by a higher high and higher low above this level, would be a solid confirmation for a potential upward move.
❌ Disclaimer ❌
Trading futures is highly risky and dangerous. If you're not an expert, these triggers may not be suitable for you. You should first learn risk and capital management. You can also use the educational content from this channel.
Finally, these triggers reflect my personal opinions on price action, and the market may move completely against this analysis. So, do your own research before opening any position.
