XAUUSD Sellers Defend Resistance, Eyes on PullbackHello traders! Here’s my technical outlook on XAUUSD (4H) based on the current chart structure. Gold remains in a bullish structure after breaking above a descending resistance line, confirming a shift in control to buyers. Price then consolidated in a clear range, showing balanced market activity before continuing higher. The upside breakout from this range, supported by a rising trend line, confirms ongoing bullish momentum. Currently, XAUUSD is testing a key Resistance Level within the Seller Zone, where selling pressure may appear. Below, the former resistance has turned into a strong Support Level, aligned with the Buyer Zone near 4,440 and the previous breakout area. My scenario: as long as price remains below the Seller Zone and shows rejection from resistance, the bias turns bearish, with TP1 targeting a move back toward the Buyer Zone and trend-line support. A strong breakout and acceptance above resistance would invalidate the short scenario and suggest further upside continuation. Please share this idea with your friends and click Boost 🚀
Tradinview

EURUSD Short: Failed Break 1.1800 - Demand at 1.1740 as TargetHello traders! Here’s a clear technical breakdown of EURUSD (4H) based on the current chart structure. After a prolonged consolidation phase marked by a broad range, EURUSD formed a clear pivot low and transitioned into a bullish recovery. From that pivot point, price established a well-defined ascending channel, confirming a shift in market structure and sustained buyer control through higher highs and higher lows.
Currently, price is trading below a key Supply Zone near 1.1800, where a fake breakout occurred, indicating strong selling pressure at the highs. This rejection from supply suggests that buyers struggled to gain acceptance above resistance. Following the rejection, price broke below short-term structure and is now pulling back toward the 1.1740 Demand Zone, which aligns with prior breakout structure and the lower boundary of the ascending channel.
My scenario:as long as EURUSD remains below the 1.1800 Supply Zone, the risk of a bearish reaction stays elevated. A clear rejection from this resistance area, especially with bearish confirmation, would favor short positions, targeting a move back toward the 1.1740 Demand Zone as the first objective. Manage your risk!

XAUUSD: Bullish Trend Remains Intact in Rising ChannelHello everyone, here is my breakdown of the current XAUUSD (Gold) setup.
Market Analysis
Gold has confirmed a bullish shift after breaking out of a prior triangle structure, where price was previously compressed between descending resistance and ascending support. This breakout marked a clear change in market structure and initiated a strong impulsive move higher. After the breakout, price transitioned into a consolidation range, indicating temporary balance before continuation.
Currently, XAUUSD established a clear upward channel, respecting both the lower channel support and the ascending trend line. This structure confirms sustained bullish momentum with higher highs and higher lows. Price has continued to trend higher and recently pushed into a key Resistance Zone, where the market is currently showing signs of reaction and testing supply. Below current price, the former resistance has flipped into a well-defined Support Zone, which aligns with the prior breakout level and the lower boundary of the upward channel. This area has already shown buyer response, reinforcing its importance as a demand zone within the bullish structure.
My Scenario & Strategy
My primary scenario remains bullish as long as XAUUSD holds above the Support Zone and respects the upward channel structure. I expect buyers to defend this area and attempt another push toward the Resistance Zone. A successful breakout and acceptance above resistance would confirm continuation of the bullish trend and open the path toward higher targets.
However, a strong rejection at resistance followed by a breakdown below the support zone would weaken the bullish structure and suggest a deeper correction or consolidation. For now, price action continues to favor buyers while the ascending structure remains intact.
That’s the setup I’m tracking. Thank you for your attention, and always manage your risk.

EURUSD Short: Head & Shoulders at Resistance - Target 1.1670Hello, traders! EURUSD previously traded within a well-defined Descending Channel, confirming sustained bearish pressure and controlled sell-side momentum. Price consistently respected the channel boundaries, forming a sequence of lower highs and lower lows. Multiple breakout attempts occurred within the channel, but each upside move was capped by the descending resistance, reinforcing the bearish structure. The market eventually reached a clear Pivot Point near the lower channel boundary, where selling pressure weakened and buyers briefly stepped in, producing a corrective rebound rather than a full trend reversal. Following this rebound, EURUSD pushed higher and managed to break above local resistance levels, leading to a short-term bullish expansion. However, this move lacked strong follow-through and transitioned into a distribution phase near the Supply Zone around 1.1760. At this area, price formed a clear Head and Shoulders pattern, signaling exhaustion of bullish momentum and a return of sellers. The left shoulder, head, and right shoulder developed directly under resistance, confirming strong supply presence and rejection from higher prices.
Currently, price has broken below short-term structure and is pulling back from the supply zone, signaling the start of a corrective-to-bearish continuation move. The market is now rotating lower toward the Demand Zone around 1.1670, which aligns with a previous breakout level and acts as the nearest downside objective. This zone represents a key area where buyers may attempt a reaction, but overall structure still favors sellers.
My primary scenario is bearish as long as EURUSD remains below the 1.1760 Supply Zone and continues to show rejection from this area. The current pullback appears impulsive rather than corrective, favoring continuation toward the 1.1670 Demand Zone. A clean breakdown and acceptance below demand would confirm further downside continuation. Until then, this level remains the key decision point. Manage your risk!

Airbnb: Proof that even stocks love to traveThe analysis of Airbnb (ABNB) stock reveals an intriguing setup following the breakout and retest of a key resistance level, which previously acted as a trendline on the daily chart. After successfully breaking above this line and confirming it with a retest, the price is now showing potential for further upside — aligning with a bullish scenario that targets the $164 area, which also coincides with the 1.0 Fibonacci level (164.12).
The current structure suggests the beginning of an upward movement after a period of consolidation, with both the 50-day and 200-day moving averages (MA50 and MA200) positioned to support further growth, reinforcing the overall bullish outlook.
Notably, trading volume has increased in line with the breakout and continued price movement, adding confidence to the scenario playing out toward the higher targets. Key Fibonacci resistance levels to watch next include 0.786 (150.37) and 1.272 (181.61), with a long-term extension target at 1.618 (203.85).

GBPUSD: trend broken, channel breakout — sellers stay in controlFor a long time the pair was moving inside an ascending channel, with the upper boundary acting as resistance. Now we see a trendline breakdown and a confirmed exit from the channel. Price is below EMA 50 / EMA 100 / EMA 200, confirming bearish structure. After a strong impulse down, price is pulling back into the Fibonacci zone 0.382–0.705 (1.3330–1.3165) — this is a potential area to look for a short entry. Main target remains 1.2740, which aligns with the next strong support zone. Strategy: waiting for a pullback → weakness confirmation → entering short on price action signal. Invalidation = breakout and consolidation above 1.3520.
BOE remains dovish, rate cut expectations for 2026 are rising. USD remains supported by stronger macro data and higher yields, while divergence between monetary policies continues. As long as this divergence persists, GBPUSD bias stays bearish.
Charts don’t care about hopes. Wait for a pullback, stick to the plan, execute the setup — not the emotions.

EURCHF Reversal zone and swing-trading potentialEURCHF is holding near strong support around 0.9215–0.9240, forming a repeating cyclical bottom pattern. The CCI indicator shows another oversold signal, confirming potential for an upward reversal.
First upside target: 0.9445, then 0.9620 and 0.9850 if momentum continues. A breakout of the descending trendline on the daily chart would confirm mid-term bullish sentiment.
The Swiss franc remains a safe-haven currency, but with easing inflation and neutral expectations from SNB, euro pressure is softening. Improving Eurozone data adds moderate support to EUR, suggesting possible correction higher.
Long setups can be considered from 0.9240–0.9260 with targets 0.9445 / 0.9620 / 0.9850.
Support 0.9210.
Best suited for swing-trading strategies over several weeks.

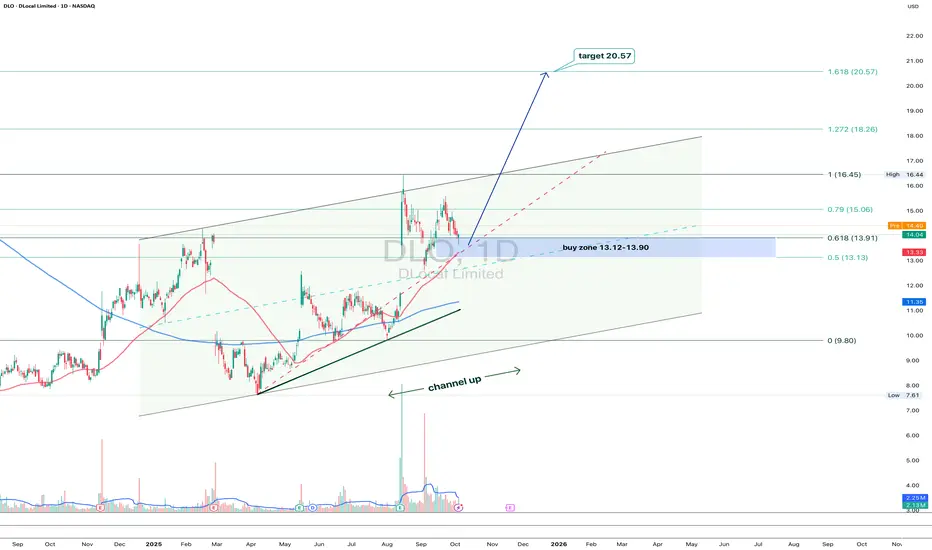
DLO 1D: steady within the channel, eyes on $20+On the daily chart, DLocal keeps trading inside a clean upward channel. After a strong leg up, price is pulling back toward the 13.12–13.90 buy zone - a confluence of the 0.5–0.618 Fibonacci retracement and the channel’s lower boundary.
As long as both MA50 and MA200 stay below price, buyers remain in control. Volume expansion supports the idea of another bullish swing ahead.
First resistance is near $16.45, with the broader target sitting at $20.57 - the 1.618 Fibonacci extension.
From a fundamental standpoint, DLocal keeps strengthening its presence in emerging markets. The fintech theme is still alive, and this setup looks like a calm pullback before another push higher.
In short - wait for confirmation around support, then let the trend do the heavy lifting. Just remember: even the cleanest channels have bumps along the road
EURUSD — Decline from Supply ZoneEURUSD pair, after testing the 1.1780–1.1820 supply zone, shows a clear sellers’ reaction and forms a descending channel. Volume profile confirms bearish pressure, indicating a potential continuation of the downward move. Key downside targets are located at 1.1610, 1.1557, and 1.1200. As long as the price remains below 1.1720, the short bias remains valid.
From the fundamental side, euro weakness is driven by dovish ECB comments and strong U.S. data, while the dollar index holds near local highs. This supports the continuation of the bearish scenario in the coming weeks.
Conclusion: bearish setup remains valid below 1.1720–1.1780, with targets 1.1550–1.1200.

Bitcoin key demand zone and movement scenariosOn the 4H BTCUSD chart price is consolidating around 111,000–112,000 under selling pressure. The key demand zone lies between 107,000–105,000 with the next strong support at 100,800. Losing these levels could accelerate bearish momentum. On the upside, a breakout above 115,800 and confirmation above 117,500 would open the path toward 120,000 and potentially higher. Investor interest in Bitcoin remains strong, with institutions continuing to hold positions despite local corrections. The market is closely watching the Federal Reserve’s policy and USD dynamics, both of which directly impact risk assets. In times of uncertainty cryptocurrencies continue to serve as an attractive diversification tool. BTC remains highly volatile, with 105,000 as key support and 117,500–120,000 as resistance. If risk appetite returns, growth scenarios could develop, yet a decline toward 100,000 cannot be ruled out. Risk management and partial entries remain essential.

iQIYI: bet on recovery or just another illusion?Fundamentally, iQIYI is often called the “Netflix of China.” In recent years, it has faced heavy pressure from high debt levels, fierce competition from Tencent Video and Bilibili, and slower growth in the Chinese domestic market. However, recent earnings reports show positive shifts: a growing subscriber base, higher ARPU (average revenue per user), and reduced operating losses. With government support for the tech and entertainment sector and signs of consumer recovery, iQIYI has a real chance to strengthen in the mid to long term. If subscriber growth and cost control continue, the company’s market cap could start to recover, making current levels attractive for medium-term investors.
Technically, the stock still trades below the 200 EMA, showing ongoing seller pressure. The key support zone is $2.30–2.40, and holding this area keeps the bullish scenario alive with targets at $3.40 and $5.25. A longer-term recovery could extend toward $10.40, but only if a sustainable uptrend is confirmed. Losing $2.30 would invalidate the bullish case and expose downside toward $1.60–1.80.
This is one of those situations where market expectations diverge from reality. Optimism makes a reversal seem near, but as always, emotions must be put aside — we wait for clear technical signals before entering.

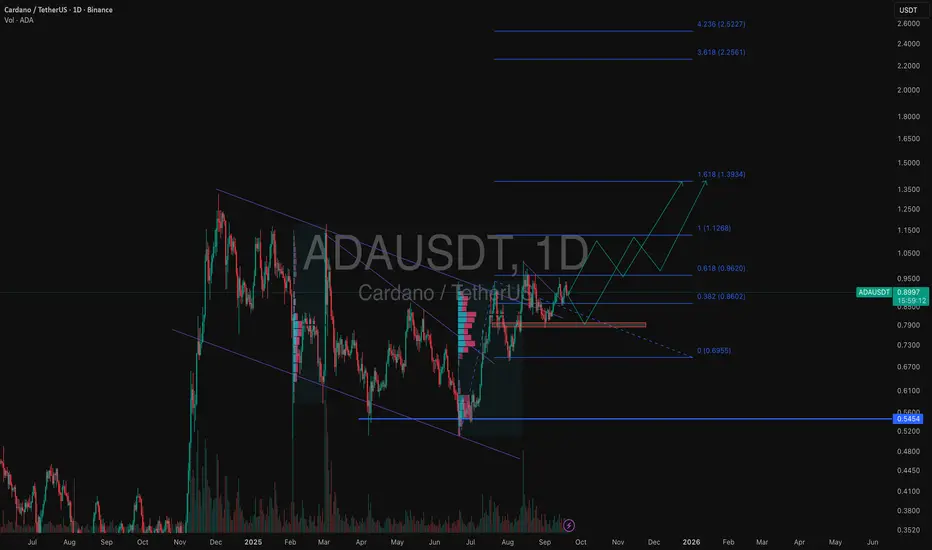
Cardano: accumulation zone and looming liquidations near $1ADAUSDT has moved into a corrective channel after its recent rally, consolidating around $0.90 and testing the upper boundary. Support at $0.8890 is still intact, making the structure look like accumulation before a new leg up. The near-term outlook suggests a breakout toward $0.92 and $0.93, with a more cautious path involving a pullback to $0.8960–0.8940 before another push higher.
Fundamentally, Cardano remains a top altcoin thanks to its strong community and smart contract ecosystem. But the current market focus is on a very practical factor: a breakout above $0.96–1.00 could trigger massive short liquidations estimated between $70M and $100M. Such a liquidation cascade could accelerate ADA’s rally toward $1 and beyond. On the flip side, if resistance holds, a return toward $0.87 and lower remains possible.
In short, the $0.96–1.00 zone is a powder keg break it and ADA can explode higher, fail it and bulls will have to wait for another attempt.
RED Market Update📊 RED Market Update
RED is currently retracing after its recent move 📉
If you missed the first entry or are looking for a re-entry / more accumulation, the smart play is to wait for price to reach the green support zone 🟢
👉 Volume Profile shows strong buyer accumulation at this level.
👉 If price pulls back and confirms a bounce, it could provide a high-probability long setup 🎯
⚠️ Reminder: Patience pays — entering at support with confirmation gives the best risk/reward.

BTC - Key insight you must pay Attention to!📊 This is a weekly Bitcoin chart with a key insight you should pay close attention to:
In a bullish trend, you’ll always notice higher highs being formed. Once price breaks the previous high, it's typically a strong confirmation of bullish continuation, as shown by the BOS (Break of Structure) levels marked in blue on the chart.
🔻 The BOS level must not be broken to the downside — if that happens, it signals a trend reversal from bullish to bearish, just like what occurred at the red zone I highlighted.
✅ Currently, Bitcoin has broken its previous high to the upside, which indicates the bullish trend is continuing.
🎯 Next target: $150K.
⚠️ However, if BTC pulls back for a retest and fails to bounce quickly, it will be considered a strong sell signal. That would likely lead to a correction back down toward the $80K zone.
Best regards:
Ceciliones🎯

Daily Market Outlook: BTC, Forex & SPX Setups (#4)Hope you’re all having a great start to the week! I’m Skeptic , and today we’ll break down BTC, Forex, and a key setup on SPX.
📉 BTC Analysis – Stuck in a Range, But Not for Long!
BTC is currently range-bound after getting rejected from $107K. The range is wide and indecisive, signaling that the market is waiting for a strong catalyst before making its next move.
📊 Key Observations:
Low volume & high volatility = poor R/R for trades inside the range.
Breakout traders should wait for confirmation:
✅ Bullish Breakout : Above $98,455, or even earlier if momentum kicks in.
🔻 Bearish Breakdown : Below $95K, which could trigger a stronger move down.
⚠ Until a breakout happens, trading inside this range isn’t ideal due to stop hunts and fake moves.
📊 BTC.D Dropping – Is Altcoin Season Heating Up?
BTC dominance (BTC.D) has been declining recently, which suggests capital rotation into altcoins.
📊 Why This Matters?
Coins like XRP, BNB, and CAKE have started to gain traction.
Watching BTC.D is crucial—it helps determine if money is staying in BTC or shifting to alts.
A continued BTC.D drop could mean more upside for alts.
📉 DXY (Dollar Index) – Entering a Deeper Correction?
We’ve been talking about DXY weakness for a while, and now, after breaking below 107.311, we’re seeing a deeper correction.
📊 Potential Targets Based on Fibonacci:
✅ 105.677 (first level)
✅ 103.306 (deeper retracement)
💡 Since DXY is weak, we might see strength in EUR pairs and stock indices this week.
📈 SPX500 – Major Breakout Watch!
SPX500 has been in a long consolidation phase after hitting an all-time high of 6113.92. Now, it’s approaching 6128.89—its key resistance level.
📊 Trade Setup:
✅ Long Entry: Above 6128.89, with confirmation.
✅ Why This Level? A breakout and confirmation could signal continuation of the uptrend.
✅ Extra Tip: Using momentum indicators like SMA & RSI can help filter out fake breakouts.
Final Thoughts & Risk Management
⚠ BTC is still ranging—stay patient and wait for clear structure before trading.
⚠ DXY weakness could support stocks & EUR pairs this week.
⚠ SPX breakout setup looks promising but needs confirmation.
💬 I’m Skeptic , and I’ll see you tomorrow with another market breakdown! 🚀
⚠ Disclaimer: These trade setups are based on my personal analysis and are not financial advice. If you don’t have a solid risk management plan, these triggers may not be suitable for you. Always do your own research (DYOR) and trade at your own risk. 💡

BITCOIN (15m)The price will rise to the trend line and then drop towards the support. This analysis is in the 15-minute time frame.
Give me some energy !!
✨We spend hours finding potential opportunities and writing useful ideas, we would be happy if you support us.
Best regards CobraVanguard.💚
_ _ _ _ __ _ _ _ _ _ _ _ _ _ _ _ _ _ _ _ _ _ _ _ _ _ _ _ _ _ _ _
✅Thank you, and for more ideas, hit ❤️Like❤️ and 🌟Follow🌟!
⚠️Things can change...
The markets are always changing and even with all these signals, the market changes tend to be strong and fast!!

GBP/USD Resistance Rejection and Bearish OutlookGBP/USD is a forex pair representing the British Pound against the US Dollar. The current price is 1.24150, and the target price is 1.21000, indicating an expected decline. This suggests a bearish outlook, with a potential gain of 300+ pips if the price moves as anticipated. The analysis is based on support and resistance levels, key technical indicators in forex trading. The price is currently facing strong resistance, leading to a rejection at this level. A rejection from resistance often signals selling pressure, pushing prices downward. Traders expect the price to drop toward the next support level at 1.21000. The setup aligns with technical analysis, where resistance acts as a ceiling for price movements. If the resistance holds, further bearish momentum could drive the price lower. Risk management is essential, as price movements can be unpredictable.

It's disappointing !!!Once again, The price action could drop to $3060 and then return to its peak. It will take some time to recover from the damage that these sh*t meme coins have done to the crypto market.
Give me some energy !!
✨We spend hours finding potential opportunities and writing useful ideas, we would be happy if you support us.
Best regards CobraVanguard.💚
_ _ _ _ __ _ _ _ _ _ _ _ _ _ _ _ _ _ _ _ _ _ _ _ _ _ _ _ _ _ _ _
✅Thank you, and for more ideas, hit ❤️Like❤️ and 🌟Follow🌟!
⚠️Things can change...
The markets are always changing and even with all these signals, the market changes tend to be strong and fast!!

TradeCityPro | STX : A Healthy Uptrend with Promising Momentum👋 Welcome to TradeCity Pro!
In this analysis, I’ll review STX, the native token of the Stacks project, a prominent Layer 1 blockchain. The analysis focuses on the weekly timeframe.
⏳ Weekly Timeframe: A Healthy Uptrend
On the weekly chart, a strong uptrend has been in place since reaching the low of 0.201. Thus far, two bullish legs have propelled the price to 3.737, with the price currently testing the resistance at 2.471.
📊 Buying volume continues to increase, showing robust support for the ongoing trend with no signs of weakness. A visible ascending trendline has interacted with the price three times, further reinforcing the bullish momentum.
🔼 The 37.65 support level on the RSI is critical. As long as the RSI remains above this level, the probability of a bullish scenario outweighs the bearish one.
📈 If the price breaks above 3.737, it could move toward new all-time highs. In the event of such a breakout, I will update the analysis to include new targets.
🔽 Bearish Scenario
If the ascending trendline and the 1.264 support level are broken, the possibility of a trend reversal arises. In this case, the first major support level to watch would be 0.442.
📝 Final Thoughts
This analysis reflects our opinions and is not financial advice.
Share your thoughts in the comments, and don’t forget to share this analysis with your friends! ❤️

It's an inherent market behavior !!Bitcoin has completed its third upward wave, and now it's time for a price correction down to around $83k. The price can correct itself and then continue its growth.
every uptrend has to be corrected, that's the nature of the market.
Give me some energy !!
✨We spend hours finding potential opportunities and writing useful ideas, we would be happy if you support us.
Best regards CobraVanguard.💚
_ _ _ _ __ _ _ _ _ _ _ _ _ _ _ _ _ _ _ _ _ _ _ _ _ _ _ _ _ _ _ _
✅Thank you, and for more ideas, hit ❤️Like❤️ and 🌟Follow🌟!
⚠️Things can change...
The markets are always changing and even with all these signals, the market changes tend to be strong and fast!!

target intactto target check chart
fundamental
PE ration low compare to its pears
slitaly pramotars and FI DI also increases stake
now chemical stocks are bullish
all stock are particiated in bull now time to chemical stocks

GOLD FORCASTThe current analysis indicates a bullish trend for OANDA:XAUUSD , provided it stays above the pivot line at 2410. the price seems poised to consolidate between 2430 and 2410 before any breakout occurs. The prevailing bullish pressure suggests that if trading remains above 2410, the trend will continue upwards.
If the price dips below 2410, it'll try to get 2397 and stabilizing bellow 2397 will try to reach 2376 as well.
The price is expected to rise to 2450, and stabilizing above 2450 could lead to a further increase to 2463 and 2475.
Key Levels:
Bullish Line: 2430, 2450, 2463, 2475
Pivot Line: 2410
Bearish Line: 2397, 2376, 2357

GOLD FORECASTThe current analysis indicates a bearish trend for OANDA:XAUUSD , as long as it remains below the 2382 threshold. At present, the price seems primed for consolidation between 2395 and 2370 before any breakout occurs. The prevailing bearish pressure suggests that if trading persists below 2382, a decline to 2368 is likely. Although there might be temporary fluctuations, with a potential retracement to 2392 before further movement, the scenario changes if a 4-hour candle closes under 2382, possibly leading to levels at 2369 and 2357.
Key Levels:
Bullish Line: 2392, 2400, 2406
Pivot Line: 2382
Bearish Line: 2369, 2364, 2357, 2344
