EURUSD Ascending TriangleThis ascending triangle has formed on the EURUSD chart.
A break out through the resistance looks like it has happened.
Now just to wait for the retest.
SL will be just under the resistance and TP will be the length of the largest point of the triangle.
Although we may take some profit before that happens to to guaranty our self some pips.
Ignore the arrows, that was my previous plan if price acted differently.
Stay tuned.
Traingle

EURJPY > Triangle Coming After a Nice Breakout!!Analysis of #EURJPY
This is a triangle coming after a nice breakout of structure which I like to see.
We already in a long trade on this or and in some profit, but will look to add if provide us a better RR, as if it will come to touch the lower trend line support I will add another trade
-Do not to forget to tell me why you did not like this idea👌⠀
⠀
Check today analysis below⠀
_____________________________________________________________________________⠀
-DISCLAIMER: This information is not a recommendation to buy or sell. it is to be used for educational purposes only⠀
-⚠ please note the ideas is valid only if it happened as I said above⠀
-Before trading our ideas please make your own analysis.

ICICI BANK TECHNICAL ANALYSISICICI BANK Has formed triangle pattern. Watch the levels marked on the graph.
Trade with your knowledge for profits.

TRIANGLE PATTERN IN NIFTYTake your decisions accordingly. Break out or Break down possible on 30th June.

BANK NIFTY IS FORMING TRIANGLE PATTERNThe triangle pattern is drawn on the chart. Take decisions accordingly.

GBP/USD triangle (Update)Hello Traders, This is an update from yesterday Analysis on GBP/USD 1 hour chart. Price may reverse before wave 5 completes between resistance zone (Yellow Rectangle )

bitcoin ascending right-angle triangleBecause of its shape, the pattern bitcoin has been forming can also be referred to as a right-angle triangle.
Two or more equal highs form a horizontal line at the top. Two or more rising troughs form an ascending trend line that converges on the horizontal line as it rises.
Watch my video for suggestion of how to trade this market, for not just bitcoin but also etherium and ada!

usdcadHello traders
This technical analysis for this pair
Please consider the level of risk in any trade .
Conditions for entering into trading on this pair .
Close the whole body of a candle above the orange area. Entry is a buy for green bullish targets .
Stop-loss order: The closing is in the same area to exit the purchase and execute a sell order For green, bearish targets .
This technical analysis is specific to this pair during this week only .
If you are not satisfied with entering this way, you can tell me about that in the comments section below .

EURAUD > Descending Triangle Waiting to Break?Hey friends👋 Support this idea with like if it's helpful to you, leave me a comment below that will help me a lot 🙏.
Analysis of #EURAUD
Price reached a key level an tested it twice but failed to establish trend from there and now keep making lower highs pressing he support line, If price breaks the key level and show me a follow-through, I will enter short on a lower time frame
even though this is a bearish pattern, but it could break to the upside If break to the upside with follow-through I will look for long entry
> Please note the ideas is valid only if it happened as I said above
Thanks for taking the time to read my idea please do not forget to hit the like it's my only reward🙌
Check today analysis below
Stay safe everyone
_____________________________________________________________________________
Before trading our ideas make your own analysis.
_____________________________________________________________________________
Disclaimer: this information is not a recommendation to buy or sell. It is to be used for educational purposes only**

Daily traingleWe are getting super close by breaking the daily triangle.
I'm short term buying or selling depending on what side we'll break out with TP at the Daily triangle.
If we break this look for targets beyond.
-
can't wait to be in a trend

DXY > Reaching Support soon!Hey friends👋 Support this idea with like if it's helpful to you, leave me a comment below that will help me a lot 🙏.
Analysis of #DXY
Price reaching the bottom-line support of a triangle, we could see some reaction at this level to the upside
Thanks for taking the time to read my idea please do not forget to hit the like it's my only reward🙌
Check today analysis below
Stay safe everyone
_____________________________________________________________________________
Before trading our ideas make your own analysis.
_____________________________________________________________________________
Disclaimer: this information is not a recommendation to buy or sell. It is to be used for educational purposes only**

usdjpyHello Traders, here is the full analysis for this pair,
Conditions for entering into trading on this pair
Close the whole body of a candle above 108.60 the select area. Entry is a buy
Close the whole body of a candle below 106.90 the select area. Entry is sell
If your entry method does not agree with these areas, do not risk entering
If you are not satisfied with entering this way, you can tell me about that in the comments section below

AUDJPYHello Traders, here is the full analysis for this pair, Simple tools for support, resistance and triangle
The profit-to-loss ratio is very good
let me know in the comment section below if you have any questions,

NTNX breaking out of traingleNTNX has formed a triangle for about a month or so and it has just recently begun breaking out of it. MACD and RSI look promising even though they aren't giving any signals. Volume looks pretty good. Other analysts (according to MarketWatch) are also agreeing that this stock is a buy.
My prediction is that it will rise to hit 50 EMA, retrace a little, and continue on upward. The retracement might be a place to add to the position.
Risk, however, is somewhat high. If we set the stop-loss to where the top line of the triangle is ($16.30), the risk is ~9%. The reward is pretty high though, so I will take a medium-size position on it.

LTC breakdown?- Descending triangle pattern is generally bearish
- Support and the base of the triangle both lie at 5844 satoshi's
- Should we break the 5844 level the most likely support will be at the 5536 level. This has held since the 4th of december 2017
- Very low volume

USDCHF FALLING CHANNEL AT STRUCTURE !Hey,👋 Support this idea push the like button, share and comment below that will help me a lot, and most of all hit the FOLLOW button so you never miss any analysis 😉.
Analysis of #USDCHF
prices formed falling channel potentially completed at structure also Fib 61.8, bigger picture we are inside triangle we could go higher to touch the upper resistance line
Check today analysis below
Stay safe everyone
_____________________________________________________________________________
Before trading our ideas make your own analysis.
Thanks for your continued support!
_____________________________________________________________________________
Disclaimer: this information is not a recommendation to buy or sell. It is to be used for educational purposes only**

XAUUSD NEXT MOVE IS?Hey,👋 Support this idea push the like button, share and comment below that will help me a lot, and most of all hit the FOLLOW button so you never miss any analysis 😉.
Analysis of #XAUUSD
Prices formed a triangle on 4h TF, we could see a fall to 1650 support zone where the price should find buyers
Check today analysis below
Stay safe everyone
_____________________________________________________________________________
Before trading our ideas make your own analysis.
Thanks for your continued support!
_____________________________________________________________________________
Disclaimer: this information is not a recommendation to buy or sell. It is to be used for educational purposes only**

ETHUSD WHAT AFTER 20% RALLY?Hi traders, here is an Analysis for ETHUSD
After we closed our trade yesterday for NICE 20% win I will leave the link for you below this idea to check it, no the price provided nice triangle and could break to the upside
Hey,👋 Support this idea push the like button, share and comment below that will help me a lot, and most of all hit the FOLLOW button so you never miss any analysis 😉.
Check today analysis below
Stay safe everyone
_____________________________________________________________________________
Before trading our ideas make your own analysis.
Thanks for your continued support!
_____________________________________________________________________________
Disclaimer: this information is not a recommendation to buy or sell. It is to be used for educational purposes only**

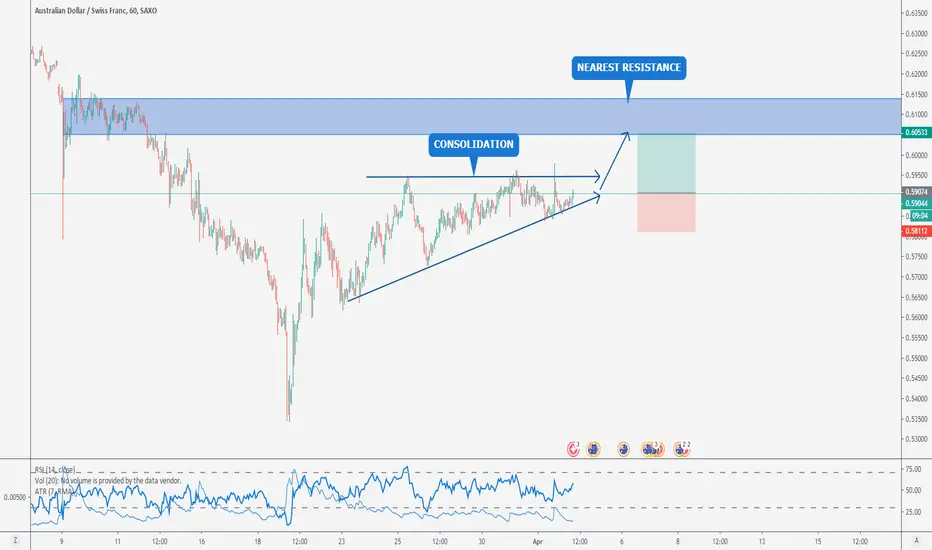
AUDCHF POSSIBLE BREAKOUT !
Hey traders, Please support this idea with a LIKE if you find it useful.
here is the analysis for AUDCHF.
The prices are wedging and could soon break out upside
Stay Safe Everyone
If you like our idea and want to see more follow me and hit the like button, share it, and do not forget to let us know your opinion below the post
Disclaimer: This information is not a recommendation to buy or sell. It is to be used for educational purposes only**
Actionable "Trade Setup" by using different timeframe analysis.the footprint of Bitcoin/U.S. Dollar on the weekly chart:
Following patterns has been detected-:
initiative movie
two triangles
rounded move with low volume
tails (while u-turn)
Parallel channel on the daily chart:
2-control lines
parallel channel with value high and low
an excess found(penetration)
Remarkable point:
=> 1) Volume started to rise while last tested at value low(b ) which sign of up-breakout . if there's up the breakout, then price not break (b) orange line (gravitation).
=> 2) Point should be note that, many Dots or many times price trie d to touch at value low("b" line).
For closed view for Top H&S pattern on the daily chart:
Here is basic of Top reversal Head & Shoulder basic reference:
---------------------------------------------------
Finally, the 30min chart developing a triangle which was previous broken down with -705 p .

EURCAD A BREAKOUT IS POSSIBLE !!hey traders, kindly support the idea push the like button, share and comment below, most of all hit the follow button so you never miss any analysis.
here is the analysis of EURCAD
Prices formed head and shoulders and consolidating inside a triangle, we can expect a breakout,
with oil rallying CAD, really did not react yet to the news
Check today analysis below
stay safe everyone
_____________________________________________________________________________
dear traders, the best "thank you" will be your likes and comments!
before trading our ideas make your own analysis.
thanks for your continued support!
_____________________________________________________________________________
disclaimer: this information is not a recommendation to buy or sell. it is to be used for educational purposes only**

BTCUSD REJECTED ABOVE 7000 AGAIN !!!Hey traders, kindly support the idea push the like button, share and comment below, most of all hit the follow button so you never miss any analysis.
Here is the analysis of BTCUSD.
in a previous analysis that I will leave the link to below this idea, I mentioned that we are consolidating and we could see a break, but we got rejected above 7000, I still holding a half position and is currently up 28%, I still think we can hit 7850 before we test 8000
Stay Safe Everyone
_______________________________________________________________________________________________________________________________
Dear Traders, the best "Thank you" will be your likes and comments!
Before Trading our ideas make your own analysis.
Thanks for your continued support!
_________________________________________________________________________________________________________________________________
Disclaimer: This information is not a recommendation to buy or sell. It is to be used for educational purposes only**

EURUSD TRADE UPDATE, WHAT AFTER WE BANKED 125 PIPS ?Hey traders, kindly support the idea push the like button, share and comment below, most of all hit the follow button so you never miss any analysis.
Now the trade went to hit the target and we banked 125 PIPS or 1.14 %, I will leave the link below this idea, go ahead and check it.
Prices continued to drop and we can see EURUSD @ 1.0700, I will keep watching for trend continuation to the downside
Stay Safe Everyone
__________________________________________________________________________________________________________________
Dear Traders, the best "Thank you" will be your likes and comments!
Before Trading our ideas make your own analysis.
Thanks for your continued support!
____________________________________________________________________________________________________________________
Disclaimer: This information is not a recommendation to buy or sell. It is to be used for educational purposes only**
