SMC TrapHello traders
- In this part, we will talk about the smart money trap.
- There are a lot of traps for traders left by big boys in the markets to take your money. That's why it's important to be careful, and don't swim with fish but swim with sharks if you don't want to be eaten.
- The move is designed to first take out early sellers, then take SMC traders.
-We'll explain this example in a few steps:
1) We see that the price is in a downtrend, reacting from OB, and supply has full control in this situation.
2) We can all assume that the price will continue to be bearish.
3) Now you can see that the price is coming aggressively to the last OB, and before that, we had WBOS, and there was a trap made for SMC traders.
4) This is inducement, and we talked about it in one of the previous posts, you can go back to it for a more detailed explanation.
5) This OB is not valid for us, because we have seen a lot of liquidity that the price needs to pick up and an aggressive retest.
6) We waited for the price to pick up all the SMC entries, and then the price came to our safe entry, which is marked on the chart as a valid OB.
If you liked this example, leave a like for more content like this.
TRAP

BTC, potential massive bull trap in progress.Two powerful green candles in daily chart all in, right? Be careful, there is a major move coming in weekly chart. BTC right now is forming another strike of bear divergence in OBV, the pivot is the 20700$ area. If BTC continues stalling here you will see sell signal in Coppock Curve and that combined with a bear divergence in OBV will be the trigger for the weekly chart move to the downside. That is the scenario I am looking for.
Invalidation: BTC must have a powerful break above 21k, no more sideways there is no time.

Bull/Bear Trap + M.E.Bull Trap: those open long position within short period of time the market reverse below the stop loss;
Bear Trap: those open short position within short period of time the market reverse above the stop loss;
M.E. : Market Engine indicator that gauges the momentum;
Price Action Color Bar and M.E. help to eliminate those mislead information to trader/investor and avoid take preemptive action.
Check out the Slides to get an ideal how I apply those to filter some of costly trades.
docs.google.com

XRP BULLFLAG BUY TRAP .. BEARISH STILLHad us pretty fooled lol the resistance are strong .. bullish pennant bull flag formed and now became an impressive fake out. This is unbelievable i know y’all don’t want to hear this but this seem like XRPUSD ( Ripple) will crash.. it will drop a lot faster than expected.
Since now the Feds made the 3rd 75 basis point to fight off the inflation to try to keep it under control.
All the change the bands are pointing down … we will see the big fall. Please trade safe and don’t get spikes out.

#analysis 70 - Liquidity HuntedSo the price grabbed the liquidity of range high, and now it broke the eq. Potentially the traders who came after the breaker, or say trap, longed during and after the pumping.
Now expecting it'll dump after the retest of the potential M15 breaker.

Gold - Creating Liquidity OANDA:XAUUSD
Here we can see Gold has created a double top this morning early into the London session, for me, this is an easy target for us to come up and sweep these highs once we get entry conformations!

EURUSD: Buyers Are Drowning 🏊Buyers are taking a real beating, they keep buying but the dollar keeps pumping.
At some point the market will need to give them a sign of relief.
Since we have swept the liquidity below this zone and tapped into a mayor order block, we may begin to see slight relief here.
BUT
Don't think that a bullish candle means a reversal! This is what they will want you to believe.
I am expecting a buy lure followed by a strong sweep before price moves in the intended direction.
Something similar to what I have illustrated.
Of course, this is a long term play and will require lots and lots of patience and trade preparation.

Major Bull trap in the works. Another 60% down coming1D major bullish divergence, if we would bottom here means we would have ATH before halving. This does not make sense

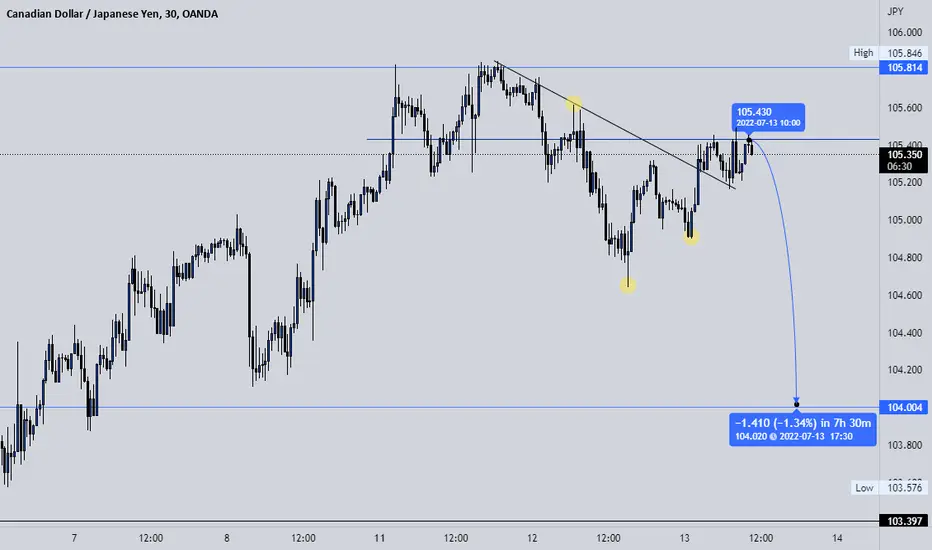
CADJPY UPDATECADJPY is throwing multiple wicks to the upside on the weekly TF, on the daily there is a clear distribution phase occurring and the market is clearly decelerating. Yesterday's daily candle closed bearish with a wick to fill to the downside , on the 4H TF price recently made a BOS with a 4h impulse followed by a corrective move, the correction is currently testing the 0.618 fibonacci in confluence with 4h supply.
Also notice how on the LTF price appears to have broke above a descending trendline, this is a trap to induce traders into opening longs in order to create liquidity to move into below. Dont get trapped the structure of the market never lies - trendlines can be deceiving unless used correctly.
📌Bear and Bull Traps:what is it and how to avoid ?😵Capital markets like crypto, stocks and forex are full of traps designed to prey on unsuspecting and emotional retail traders. Two of the most common are bear traps and bull traps.
Traders have many challenges when trading, these include high volatility, unexpected events, incorrect signals, risks, among other challenges like Bull Trap or Bear Trap. Before we tell you about the Bear Trap and the Bull Trap, we will tell you what traps are like in Trading.
What is a trap?
Every day, the market presents numerous traps that reach a large number of people and absorb the volume necessary to survive. The market constantly develops pricing structures that confuse the vast majority of participants.
The trap occurs when the price appears to be about to break a key level , such as support/resistance lines, dynamic trend lines, or major moving averages, and then is pulled in the opposite direction. For example, it passes the support level in a downward movement and then goes back up.
" as I mentioned the Traps can be bullish or bearish. In a market structure the ascendants are called Bulls, that is, Bulls Traps and the descenders are called Bears , Bears Traps."
This type of trap can be caused by the behavior of the main market players(whales , exchanges, institutional investors, hedge funds ) in order to liquid retail traders by hitting their stop-lose or liquidation price to put them out of the game!
Bull Trap :
A bull trap is a situation where the price breaks through resistance, indicating a strong upward trend, but turns and falls.
Exampels:
1: 2:
3:
4:https://www.tradingview.com/x/dDMmav8j/
To identify this type of bull trap, it is necessary to identify the following:
The general trend is still bearish in the long-term and price suddenly goes up .
There is a rally that looks like a trend reversal.
The price goes back up, creating higher high of previous leg , which puts everyone out of the game as stop-loss was usually just above the recent movement .
The price drop below the previous high again .
Likewise, to avoid get in a bull trap , you must also:
-Watch for resistance tests: in this case, if the price tests resistance several times in the strong uptrend, it could be an indication that a price reversal is coming.
Define the sideways movement: If the price has started to move horizontally within the uptrend, the uptrend is likely to end soon. So, if the price crosses an upper line of the horizontal channel, you should stay away from the market to avoid a possible bull trap.
Check candle size: the price forms a larger candle than the previous one in the last step of the trap. There is no 100% guarantee that it is a trap, but it is better to be careful and confirm with models or indicators.
Bear Trap :
You should be especially careful not to fall into a bear trap when you want to open a trading position when the price is breaking the support line. This is because when the price breaks the support line, some traders go short and then the price reverses and goes up.
Now traders are left with open short positions, so they can exit trades or wait for the price to reach the stop loss level they previously set.
Examples:
1: 2:https://www.tradingview.com/x/wI0UIPDC/
3:https://www.tradingview.com/x/0rqsMkqQ/
To identify this type of bear trap , it is necessary to identify the following:
The general trend is still bulish and price initially goes up.
There is an upward to downward reversal that forms a top. People go short and place their stop loss just above this high.
The price goes back up, above the previous high, triggering many stop losses.
How can you avoid these pitfalls?
Traders and investors can avoid traps by looking for confirmations following a breakout. For example, a trader may look for higher than average volume and bullish candlesticks following a breakout to confirm that price is likely to move higher. A breakout that generates low volume and indecisive candlesticks—such as a doji star—could be a sign of a Possible traps.
The best way to handle bull traps is to recognize warning signs ahead of time, such as low volume breakouts, and exit the trade as quickly as possible if a trap is suspected. Stop-loss orders can be helpful in these circumstances, especially if the market is moving quickly, to avoid letting emotion drive decision-making.
so :
1-Check the volume as first confirmation:
Real price reversals require a significant amount of volume. If you see a sudden reversal without a large amount of volume behind it, it’s most likely a trap.
2-Look for different divergences confirmations:
for example false breakouts preceded by significant negative RSI divergence.RSI or “relative strength indicator”, is a popular momentum indicator that charts the strength and weakness of an asset’s price.
3-Check the News:
News, whether it’s good or bad, can have a significant emotional effect on inexperienced traders and lead to poor irrational trading decisions.
Market makers know this and often use news to initiate bull or bear traps. If you see a sudden price movement with average volume, be sure to check the news before making any trading decisions.
More often than not, movements like these are simply designed to catch emotional traders off guard,
And more importantly, ask this question in which market is a news broadcast? For example, in the recent down market, Dogecoin was supported several times by Elon Musk, which continued its downward trend as a bull trap after the temporary price pump.
4-Risk Management rules:
(proper position size and stop-loss )
Using stop-loss orders is a crucial part of any successful trading strategy. Even if you feel completely confident about a trade, the market can still completely go against you.
It's important to set a strict loss allowance by closing a position if a trade goes the wrong way. it dosent matter where you place your stop lose by set aside maximum 1-2% loss of your starting capital can be a good starting point.
5-Choosing the right market and instrument
Also, as a last point, it is very important in which market we trade and which pair we choose
For example, if you trade in the cryptocurrency market, you should know that this market is much more subject to manipulation by whales and big players due to the inherent risk such as the low market cap and the very low trading volume compared to other markets. They can manipulate the market price and the price of a crypto token, so if we trade in these market, it is important to pay attention to choose a the appropriate pair by good trading volume and marketcap .
Final thoughts:
It can be wise to always use risk management rules and stop loss order to build potential losses into your trading strategy and minimize emotional turmoil. Don’t expect the market to recover in your favor because many times, it simply won’t. Bear and bull traps are one of the most common trading pitfalls when trading in any market especially cryptocurrency market . Thankfully, it’s easy to minimize losses by identifying these traps or if you have the right cryptocurrency trading strategy and mindset.

This is a trap!BTC had a confirmed breakout out of this falling wedge and reached the target.
The RSI is way to high and the momentum with that Bitcoin is gaining is way to fast.
I think this is a planned trap to liquidate people who will open up a long position out of FOMO.
We are also running into some resistance, so a cooldown to 20k is very likely.
have a good evening!

Two variants, one target ???Possible bear pennant with fake brake out(bulltrap), or potential bear flag? Both with similar target.
Any suggestions? You are Long already?

bear trap indusind bank is a perfect example of bear trap look and the daily chart and you will see it and it's a good buy for swing trade

BTCUSDT: One Last Sell Before Buys ⏏️I have been calling all BTC moves as you can see from my related ideas below.
We are waiting for a buy BUT first, we must complete the final liquidity grab on SMC buyers from the order block.
I will be selling into my buy zone with members.
Let's hear the hate in the comments 💬

USDJPY: Are Sellers Ready? 💣The key psychological level of 135 provided immediate resistance for sellers but is now showing signs of being a sell trap.
Since a high amount of sellers joined at the key level and the trend line breakout, I believe liquidity will be targeted above this high before we see any signs of bearish momentum.
When the liquidity has been taken, I will be looking for shorts with the team.
Traders, if you have your own opinion about this idea, write in the comments section, I always reply. 💬
--------------------------------------------------------------------------------------------------------
Please like, subscribe, and share this idea with others! ⬇️
--------------------------------------------------------------------------------------------------------

Megaphone in NasdaqThere are three reasons for a downward breakout of the megaphone (broadening wedge).
1. Head fake
2, Declining volume on rally
3. Very overbought RSI

$SPY // S&P 500 4h: Bearish divergence. Don't let this fool you!Quick and simple one for today. Don't be fooled by this pseudo-recovery. Note increasing price on decreased volume? Better buy in ahead.

GBPJPY: The Head & Shoulders TrapDon't be fooled by this pretty head and shoulders pattern because it is most likely a trap to lure sellers into the market before price bounces from a demand planted below it.
Once the fair value gaps have been filled, the price is likely to utilise the demand to travel to the remaining imbalance at the top of the move.
Do you think this is likely? 🚀

$BTC BEAR FLAG on DAILY (ST) What are you thoughts on the current market? From what i've seen on social media everyone is expecting BTC to go down, but is that what they want us to think?
Trading in this market is tough because at any point the market can shoot up like it did on Wednesday!!!
Good luck to everyone! Let me know what your plans are for the next few days!
QoverQ

TWTR due for correction!!!TWTR nearly approached oversold territory. After the news of Elon Musk considering purchasing more shares of the company following such negative news of a potential hostile take over by his most recent offer. This all caused the company to implement a "poison pill" to prevent a hostile takeover. Which is brilliant. This however will not be enough to keep the ticker running hard on tax day. Tax day historically is a red day. It will take a major catalyst to cause TWTR to continue this run it has. I evaluated the day chart in this example looking over a few puts I played last week for a swing.
All of the indicators such as the MAC D,
The studies used in this study are Chandelier Exit Strategy, Moving Average Convergence Divergence, Moving Averages(2) , and the Relative Strength Index with SMA.
My projection is TWTR open on the down trend in the morning if this chart pattern continues. If the 50 day average crosses over the 200 day moving average TWTR will be bullish again. I am bearish because I believe twitter will sink back to the 30's soon.
On the flip side, TWTR can form a cup and handle chart pattern which can only happen after a correction happens, and the ticker go back to the $50's, yet I believe the momentum will die down on day trades on TWTR.
**This is not financial advise but only a personal observation for my play.

BTC - How sharks lure fish🐟Now, through the efforts of a market maker, something similar to the Head and Shoulders can be traced on the chart.
This is drawn in order to lure inexperienced traders who will be trapped into shorts.
However, experienced traders know that a H&S is a reverse setup!
Knowing how to spot traps of the market maker is just as important as knowing how to find your formations. This skill will help you better predict future market movements and trade in the direction of wind.
What do you think of this idea? What is your opinion? Share it in the comments📄🖌
If you like the idea, please give it a like. This is the best "Thank you!" for the author 😊
P.S. Always do your own analysis before a trade. Put a stop loss. Fix profit in parts. Withdraw profits in fiat and reward yourself and your loved ones

BNB still gonna down more!hello every one bnb BINANCE:BNBUSDT today made a false break out and i think trend still bearish and 340 area is important to see would handle bears or not
write in comments what do you think guys and btw please follow and push like for more updates

Don't fall into the market maker trap....EURUSD In my eyes we see here only a mini correction of the actual trend, watch the P pivot / ema 200 15m TF.
we have formed a range during the Asia session, and london immediately went into the trend, short positions were collected.
The whole thing is just a small cycle within the bigger one.
I see EURUSD at the end of the week back at 1.09200
