Correction for MYX/USDT .. BACK TO $2.43?We have seen a powerful increase last time for this coin. And at sthe ame time this coin is at risk.
It can get a correction, which can bring this coin back to $2.43
Trend

SUN/USDT ENTERING INTO IMPORTANT INCREASE BOXthere’s a good chance we could see SUN/USDT increase in the coming timeframes, as an important TA cross signals a potential new trend breakout. However, this will depend on the data
Reason of follow is the high chance of break.

ZEN/USDT NEW increase view Zen/usdt has a pre increase view - should hold $7 for further increase
waiting to see if there are new confirmations on the way.

BTC – Bulls Guarding the Key Zone!Bitcoin is retesting a major support zone 🛡️ that overlaps with the previous ATH breakout level.
This area has been acting as a strong demand zone, keeping the overall structure bullish despite recent corrections.
As long as this zone holds, we will keep looking for long opportunities 📈, with the next wave of momentum likely pushing BTC higher. If the bulls manage to reclaim the minor resistance ahead, we could see them fully take over and drive price back into an upward rally.
For now, this zone remains a crucial pivot — watch closely for bullish confirmation signals.
⚠️ Disclaimer: This is not financial advice. Always do your own research and manage risk properly.
📚 Stick to your trading plan regarding entries, risk management, and trade execution.
Good luck!
All Strategies Are Good; If Managed Properly!
~Richard Nasr

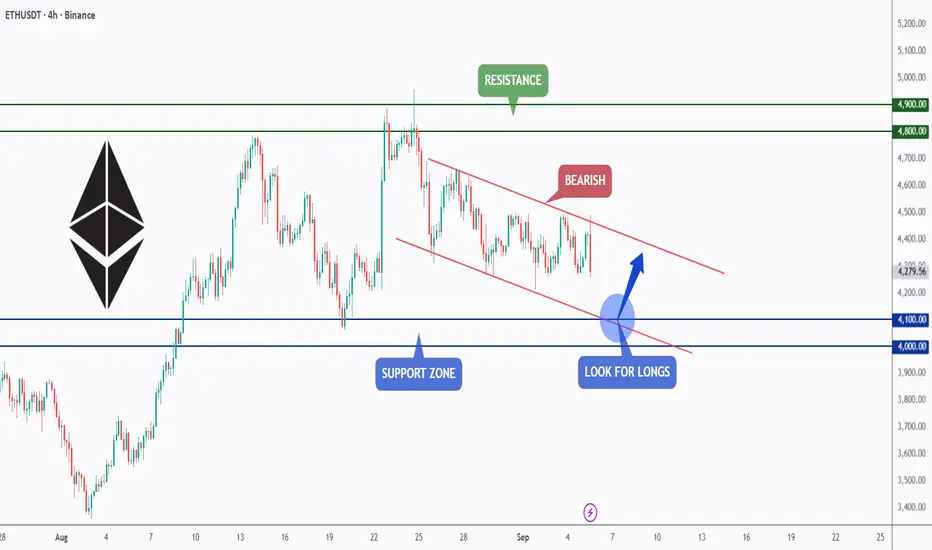
ETH – Watching the Falling Channel!Ethereum is currently trading within a falling channel on the 4H timeframe, showing short-term bearish pressure.
Price is approaching the support zone around the $4,000–$4,100 area, which also aligns with the lower boundary of the channel.
As long as this zone holds, it could act as a springboard for bullish momentum, offering a potential long setup.
A breakout from the channel would further confirm buyer strength and open the way toward the resistance zone near $4,800–$4,900.
⚠️ Disclaimer: This is not financial advice. Always do your own research and manage risk properly.
📚 Always follow your trading plan regarding entry, risk management, and trade management.
Good luck!
All Strategies Are Good; If Managed Properly!
~Richard Nasr
GOLD – New All-Time High Gold has just reached a new all-time high, touching the level of 3598.10 for the first time in history. With this move, the market has created a new Higher High (HH), placing the price near a very significant resistance zone.
🔎 Key points to watch:
If price holds above this zone, continuation of the bullish momentum remains possible.
However, in case of rejection, we could expect a pullback towards the 3500 and potentially 3440 levels.
📊 This zone will be crucial for defining the next direction of Gold. Traders should pay close attention to how price action behaves in the coming sessions.

NZDCAD – Range Resistance in Play!📌 NZDCAD has been moving within a clear range structure between support and resistance zones on the 1H timeframe.
Price is now approaching the upper resistance area, where sellers have consistently stepped in to cap bullish momentum.
If this level holds, we could see a bearish reversal, driving price back toward the support zone near the lower boundary of the range.
This setup offers a classic opportunity to trade the swing from resistance back into support.
⚠️ Always remember: patience pays. Let the market come to you.
📚 Always follow your trading plan regarding entry, risk management, and trade management.
Good luck!
All Strategies Are Good; If Managed Properly!
~Richard Nasr

XAUUSD Analysis - FSX🔍 1. Technical Analysis (5-Minute Chart Review)
Price Structure
Price is currently at $3,549.71, having bounced twice off the $3,545.40 support and lower $3,542.26 support.
We're seeing short-term bullish rejection wicks near those support levels, suggesting buying interest.
Trend
On this intraday (5-min) chart: The market made a lower high and lower low, indicating a short-term downtrend, but this is being tested.
There's a potential reversal pattern forming (double bottom or inverse head-and-shoulders near $3,542 area).
Key Levels
Support:
$3,545.40 → Recent double rejection, acting as short-term support
$3,542.26 → Stronger horizontal support, tested multiple times
Resistance:
$3,551.30–$3,552.00 → Immediate resistance (previous lower high)
$3,557.00–$3,560.00 → Major intraday resistance (top before breakdown)
Indicators (Implied)
You have the "Buffett-Ackman RSI Support/Resistance Strategy" on — not shown directly, but the levels drawn seem to support RSI-based oversold zones near support.
Short-term candles are shrinking in body with long wicks → sign of buyer absorption of selling pressure.
🌐 2. Fundamental Analysis (As of Sept 5, 2025)
Macro Backdrop
USD Strength: Likely remains strong due to higher interest rates by the Fed (continuing 2024 tightening).
Inflation: If inflation remains sticky, it supports USD but also Gold due to its inflation hedge.
Geo-Political Risks: Any tensions (Russia/Ukraine, China/Taiwan) can spike gold as a safe haven.
Bond Yields: Rising yields pressure Gold due to opportunity cost of holding it. If yields cool, gold rallies.
Upcoming Events to Watch
US NFP (Jobs Data): If weak, USD drops and Gold may pump.
Fed Commentary: If dovish, bullish for gold.
CPI or PCE Inflation Data: Any downside surprise could trigger upside in Gold.
✅ 3. Trade Plan (Pro Setup)
🟢 Trade Idea: Long (Buy) XAUUSD – Countertrend Intraday Reversal
Entry: $3,546.00 (Buy limit just above the strong support zone)
Stop Loss: $3,540.50 (Below key swing low and liquidity zone)
Take Profit 1: $3,552.00 (Intraday resistance)
Take Profit 2: $3,557.00 (Key structure resistance)
Risk/Reward: ~1:2.5 minimum
🛡️ Reasoning:
Bullish rejection wicks on support zone ($3,542–$3,545)
Possible RSI oversold condition
Double bottom / consolidation = base formation
Risk tightly defined below structure
Fed uncertainty and safe haven bids can cause sudden spikes
⚠️ Alternative Scenario – If It Breaks Down
If $3,542.00 breaks convincingly with volume, then:
Flip bias short
Sell Below: $3,540.00
Target: $3,532.00–$3,528.00
Stop: $3,546.00
Reason: Clear breakdown of structure with liquidity hunt done

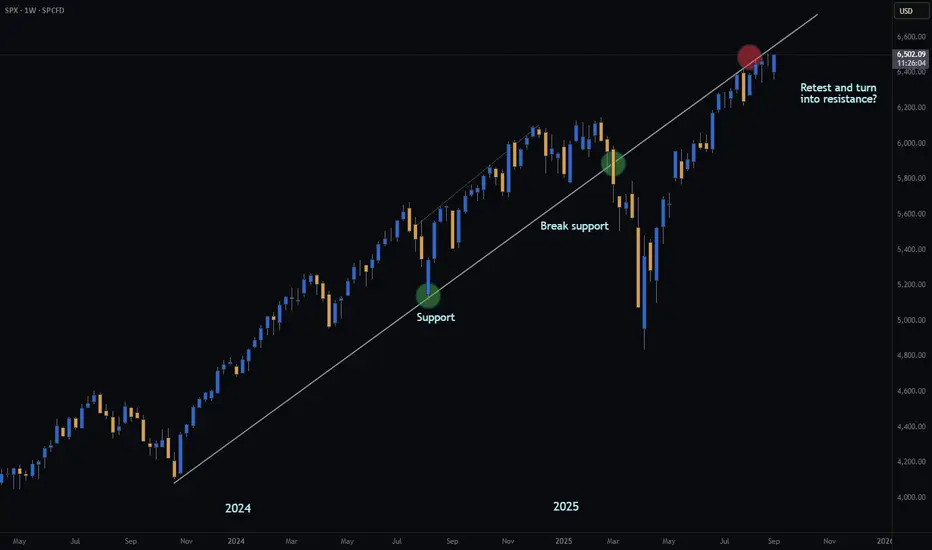
S&P | KEY RESISTANCE | GTradingMethodHello traders!
Has the S&P finally met its match?
Is this just a retest… or the beginning of a much deeper move?
- Broke diagonal support earlier this year
- Retesting previous support now
- Potential daily double top forming
If the retest holds, it’s a long way down… 📉
What are your thoughts? Keen to hear them :)
Signing off
G
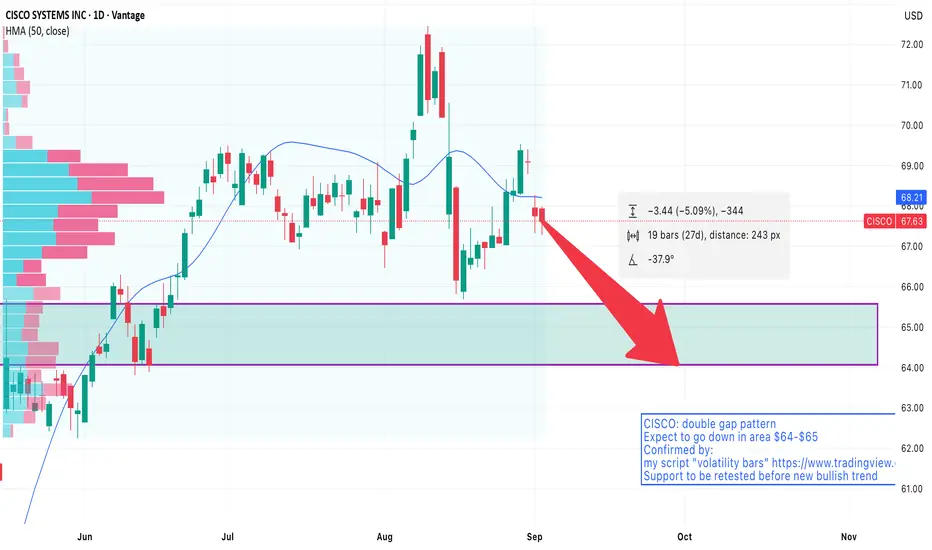
CISCO: bearish pattern foundCisco (CSCO) Forecast:
Double gap pattern spotted for Cisco (CSCO), with expectations for the price to decline to the $64-$65 range in the next days.
Confirmation
This forecast is supported by my script, "Volatility Bars".
Additional Insights
I expect that the price will retest support area $64-$65 before initiating a new bullish trend.
Keep an eye on market conditions and any news that may impact Cisco's performance.
Trading Ideas
Short Position:
Entry: Current market price
Take Profit (TP): Set at 5%-6% below the current price.
Long Position:
Entry: Wait for a retracement to the $64-$65 area to buy.
Feel free to share your thoughts or any additional insights!
GBPUSD – Supply Zone Bears on Watch!GBPUSD continues to trade within a broad descending channel on the 4H timeframe. Price is approaching a well-defined supply zone that aligns with the upper red trendline resistance.
📉As long as this area holds, sellers are expected to step in, making it a high-probability zone to look for short setups.
A rejection from this level could push price back toward the lower boundary of the channel, keeping the bearish structure intact. Traders should stay cautious and watch for confirmation signals before engaging.
⚠️ Always remember: patience pays. Let the market come to you.
📚 Always follow your trading plan regarding entry, risk management, and trade management.
Good luck!
All Strategies Are Good; If Managed Properly!
~Richard Nasr

EURJPY: FakeoutEURJPY is currently undergoing an interesting transition. While the EMAs indicate that this pair is in an uptrend (where EMA20 is above EMA60), there's early indication that we might be seeing a downtrend soon.
Daily Timeframe:
Price attempted to cross above the daily level, but it failed to close above it. It's also a lower high after a strong run-up, which indicates to me that the upside momentum might be exhausting.
H1 Timeframe:
We see an intraday double top formation, which indicates that price is having a hard time pushing higher. Price also crossed below the intraday neckline.
While it tried to pull back above the intraday neckline, it quickly reverted below, indicating quite a bit of selling pressure.

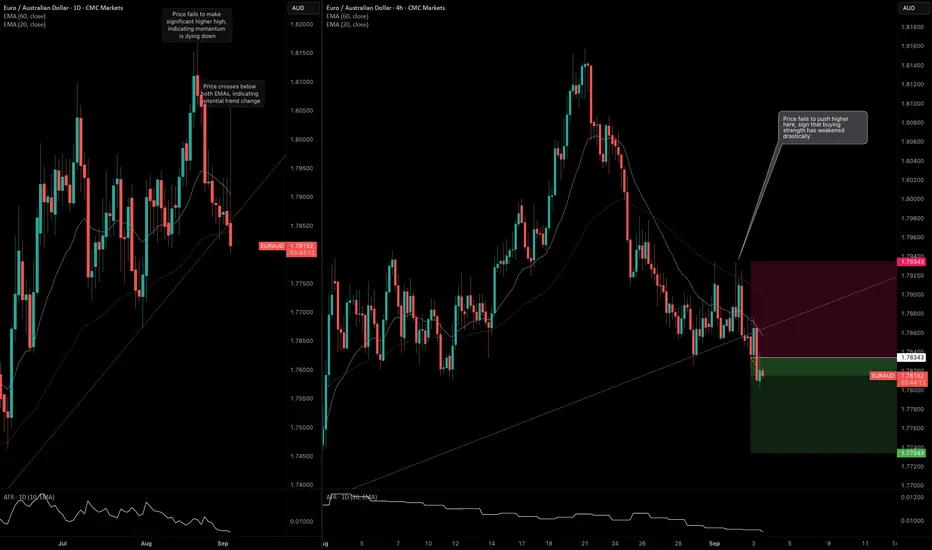
EURAUD: Ascending Trendline BreakThis is a counter-trend trade as I see exhaustion on the daily timeframe.
Daily Timeframe:
I plotted an ascending trendline on the daily timeframe. Price attempted to push to a new high on August 20th, but failed to hold. That was the first indication that the uptrend might be over.
The signal occurred when price crossed below the ascending trendline. Currently, the daily bar is active. If the current bar manages to close below the ascending trendline and tomorrow's daily bar does the same, it's safe to say that we can expect further downside.
H4 Timeframe
The bearish signal is also supported on the 4-hour timeframe. In the intraday timeframe, price made a "double top" indicating that it's not able to push higher to the upside. I'm anticipating that momentum will build up throughout the rest of the day and into tomorrow as well.
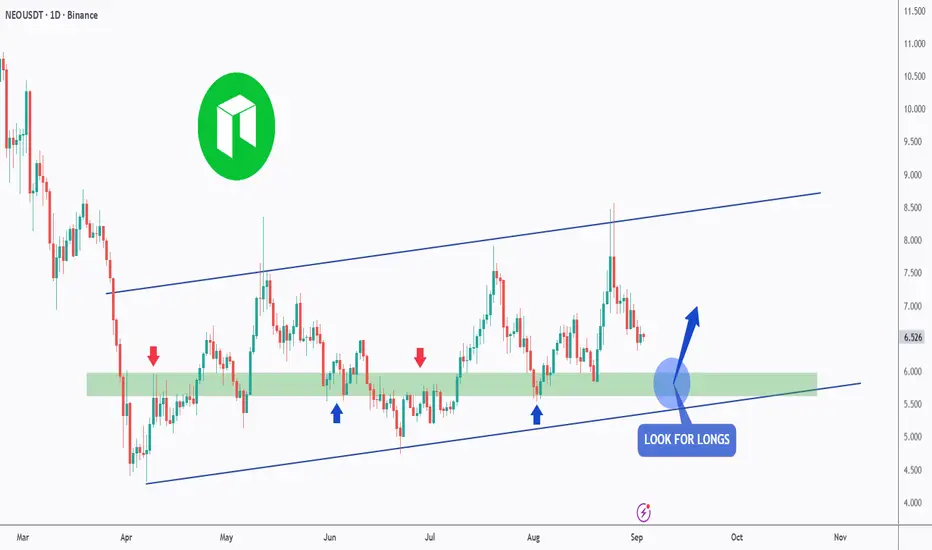
NEO - Will the Bulls take over?Hello TradingView Family / Fellow Traders. This is Richard, also known as theSignalyst.
📈NEO has been overall bullish trading within the flat rising channel marked in blue.
This week, NEO has been retesting the lower bound of the channel.
Moreover, the green zone is a strong support and structure.
🏹 Thus, the highlighted blue circle is a strong area to look for buy setups as it is the intersection of the lower blue trendline and green support.
📚 As per my trading style:
As #NEO approaches the blue circle zone, I will be looking for trend-following bullish reversal setups (like a double bottom pattern, trendline break , and so on...)
📚 Always follow your trading plan regarding entry, risk management, and trade management.
Good luck!
All Strategies Are Good; If Managed Properly!
~Richard Nasr
Gold | H1 Double Bottom | GTradingMethodHello Traders.
Welcome to today's trade idea by GTradingMethod.
🧐 Market Overview
Gold has been making higher highs while RSI has been making lower highs, which is known as negative RSI divergence. This is an indication of weakening buying strength. For further confluence, this potential double top is at the ATH level, which could provide further resistance.
📊 Trade Plan
Risk/reward = 2.9
Entry price = 3 497.6
Stop loss price = 3 515.5
Take profit level 1 (50%) = 3 456.4
Take profit level 2 (50%) = 3 431.9
💡 GTradingMethod Tip
Always predefine your risk for every trade and always accept this risk. If you accept the risk, there can be no emotional pain. If you do not get emotional, you will interpret the market's information objectively.
🙏 Thanks for checking out my post!
Make sure to follow me to catch the next idea and please share your thoughts - I would like to hear them.
📌 Please note:
This is not financial advice. This content is to track my trading journey and for educational purposes only.

Dow Jones Holds Pressure Under Pivot Zone 45,530–45,590US30 – Overview
The Dow Jones remains under bearish momentum, having stabilized in the bearish zone with downside potential toward 45,285.
Technical Outlook:
🔻 Bearish scenario: As long as price trades below the pivot zone 45,590 – 45,530, pressure will remain to the downside, targeting 45,430 → 45,285 → 45,100.
🔺 Bullish scenario: A reversal and stabilization above 45,590 would open the way to 45,680, and a confirmed breakout higher could extend toward 45,860.
Key Levels:
Pivot zone: 45,530 – 45,590
Support: 45,430 – 45,285 – 45,100
Resistance: 45,680 – 45,860
📌 Bias: Bearish below 45,530–45,590; bullish only above 45,590 with confirmation.

SOL - Retest the Zone, Reload the Longs!Solana continues to trade within a well-defined ascending channel on the daily timeframe. After a strong bullish leg, price is now pulling back toward the highlighted support zone, which also aligns with the lower bound of the short-term channel.
As long as this area holds, it offers an attractive spot to look for fresh long opportunities. A confirmed bounce here could set the stage for continuation higher toward the channel’s upper boundary.
The structure remains bullish, and dips into demand are where the best risk-to-reward setups lie. Keep an eye on this zone for the next move.
⚠️ Disclaimer: This is not financial advice. Always do your own research and manage risk properly.
📚 Stick to your trading plan regarding entries, risk management, and trade execution.
Good luck!
All Strategies Are Good; If Managed Properly!
~Richard Nasr

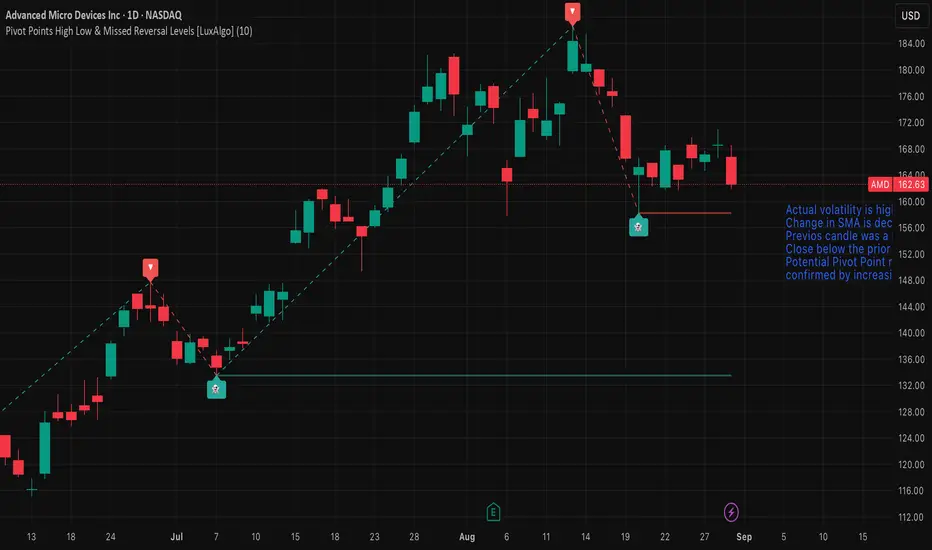
AMD — Watch for Pivot Reversal or Trend ContinuationMarket view
Actual volatility is high, confirmed by the Volatility Bars indicator.
The rate of change in the SMA is decreasing, suggesting momentum is weakening.
The previous candle was a Doji, indicating short-term indecision.
Price closed below the prior day’s low, adding bearish pressure.
A potential Pivot Point reversal is forming.
This reversal setup is confirmed by increasing Convolution Probability, supporting a higher chance of a directional move.
Trade plan
Long (trend continuation): buy on a break above the August 19, 2025 open.
Short (reversal): sell on a break below the pivot reversal at 158.25.
Stop-loss and position sizing: use volatility-based stops (e.g., ATR multiple) and risk no more than a small fixed percentage of capital per trade.
USDCHF - Demand Zone Meets Falling Wedge!USDCHF is approaching a key demand zone while trading inside a falling wedge pattern.
The price is now retesting the intersection of support and structure, a high-probability area where buyers may step in.
As long as this zone holds, I’ll be looking for long opportunities targeting a potential bounce back toward the upper boundary of the wedge.
⚠️ A break below the demand zone would invalidate this bullish setup and open the door for lower levels.
📚 Always follow your trading plan regarding entry, risk management, and trade management.
Good luck!
All Strategies Are Good; If Managed Properly!
~Richard Nasr

Review and plan for 1st SEPTEMBER 2025Nifty future and banknifty future analysis and intraday plan.
This video is for information/education purpose only. you are 100% responsible for any actions you take by reading/viewing this post.
please consult your financial advisor before taking any action.
----Vinaykumar hiremath, CMT

USDCAD – Shift in Momentum!USDCAD has moved from a strong bullish rally into a clear shift in momentum. After breaking structure with an aggressive drop, price is now moving inside a rising channel that looks more corrective than impulsive.
The previous bullish phase was defined by higher highs and higher lows, but the sharp decline highlighted a potential change in sentiment. Since then, the market has been consolidating, with price pushing higher in a slower and corrective manner.
As long as price remains inside this channel, the bias stays bearish, and I’ll be looking for shorts from the upper boundary around the 1.3880–1.3900 zone. A break below the lower bound near 1.3820 could confirm continuation to the downside.
This is a critical zone for USDCAD, where sellers may step in to regain control.
📚 Always follow your trading plan regarding entry, risk management, and trade management.
Good luck!
All Strategies Are Good; If Managed Properly!
~Richard Nasr

BTC NEW WHALE CANDLE CAN BRING BTC TO 117KBTC did fail to confirm the 113K Target.
But there is still a good chance BTC will return with a whale buying effect to 117K.
117K is an important test level.

THIS CAN BE THE CANDLE THAT WILL BRING BTC BACK TO 117KTHIS CAN BE THE CANDLE THAT CAN BRING BTC BACK TO 117K
Following it with 100% focus.
High chance BTC is going to 117K after confirmation 113K
