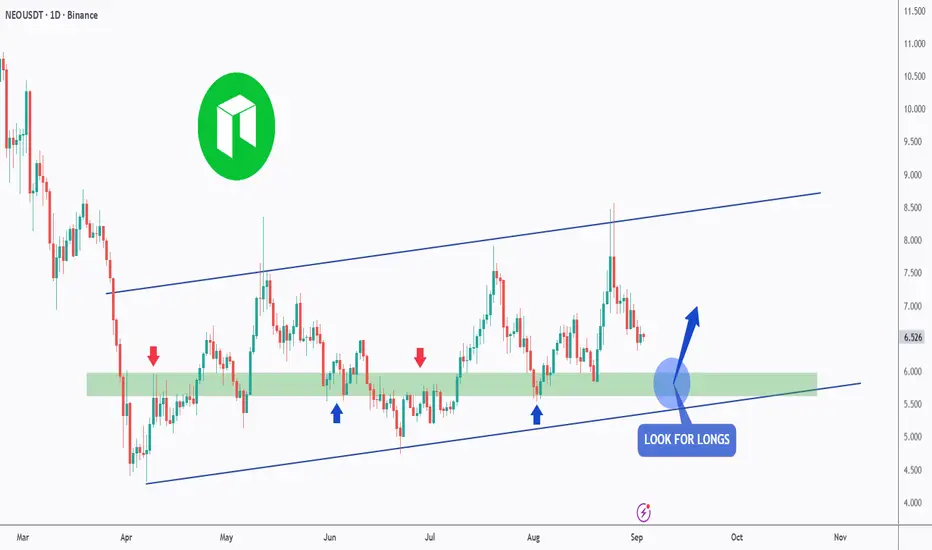
NEO - Will the Bulls take over?Hello TradingView Family / Fellow Traders. This is Richard, also known as theSignalyst.
📈NEO has been overall bullish trading within the flat rising channel marked in blue.
This week, NEO has been retesting the lower bound of the channel.
Moreover, the green zone is a strong support and structure.
🏹 Thus, the highlighted blue circle is a strong area to look for buy setups as it is the intersection of the lower blue trendline and green support.
📚 As per my trading style:
As #NEO approaches the blue circle zone, I will be looking for trend-following bullish reversal setups (like a double bottom pattern, trendline break , and so on...)
📚 Always follow your trading plan regarding entry, risk management, and trade management.
Good luck!
All Strategies Are Good; If Managed Properly!
~Richard Nasr
Trend
Gold | H1 Double Bottom | GTradingMethodHello Traders.
Welcome to today's trade idea by GTradingMethod.
🧐 Market Overview
Gold has been making higher highs while RSI has been making lower highs, which is known as negative RSI divergence. This is an indication of weakening buying strength. For further confluence, this potential double top is at the ATH level, which could provide further resistance.
📊 Trade Plan
Risk/reward = 2.9
Entry price = 3 497.6
Stop loss price = 3 515.5
Take profit level 1 (50%) = 3 456.4
Take profit level 2 (50%) = 3 431.9
💡 GTradingMethod Tip
Always predefine your risk for every trade and always accept this risk. If you accept the risk, there can be no emotional pain. If you do not get emotional, you will interpret the market's information objectively.
🙏 Thanks for checking out my post!
Make sure to follow me to catch the next idea and please share your thoughts - I would like to hear them.
📌 Please note:
This is not financial advice. This content is to track my trading journey and for educational purposes only.

Dow Jones Holds Pressure Under Pivot Zone 45,530–45,590US30 – Overview
The Dow Jones remains under bearish momentum, having stabilized in the bearish zone with downside potential toward 45,285.
Technical Outlook:
🔻 Bearish scenario: As long as price trades below the pivot zone 45,590 – 45,530, pressure will remain to the downside, targeting 45,430 → 45,285 → 45,100.
🔺 Bullish scenario: A reversal and stabilization above 45,590 would open the way to 45,680, and a confirmed breakout higher could extend toward 45,860.
Key Levels:
Pivot zone: 45,530 – 45,590
Support: 45,430 – 45,285 – 45,100
Resistance: 45,680 – 45,860
📌 Bias: Bearish below 45,530–45,590; bullish only above 45,590 with confirmation.

SOL - Retest the Zone, Reload the Longs!Solana continues to trade within a well-defined ascending channel on the daily timeframe. After a strong bullish leg, price is now pulling back toward the highlighted support zone, which also aligns with the lower bound of the short-term channel.
As long as this area holds, it offers an attractive spot to look for fresh long opportunities. A confirmed bounce here could set the stage for continuation higher toward the channel’s upper boundary.
The structure remains bullish, and dips into demand are where the best risk-to-reward setups lie. Keep an eye on this zone for the next move.
⚠️ Disclaimer: This is not financial advice. Always do your own research and manage risk properly.
📚 Stick to your trading plan regarding entries, risk management, and trade execution.
Good luck!
All Strategies Are Good; If Managed Properly!
~Richard Nasr

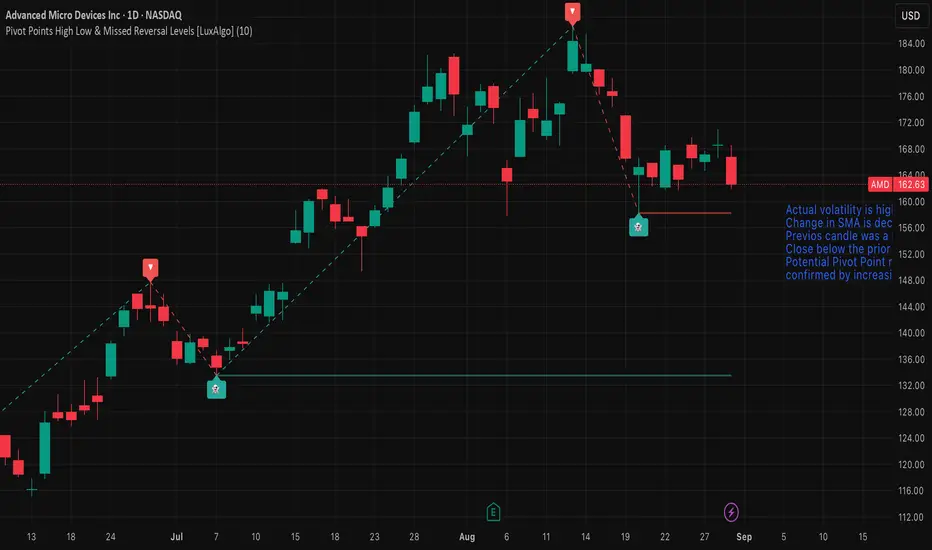
AMD — Watch for Pivot Reversal or Trend ContinuationMarket view
Actual volatility is high, confirmed by the Volatility Bars indicator.
The rate of change in the SMA is decreasing, suggesting momentum is weakening.
The previous candle was a Doji, indicating short-term indecision.
Price closed below the prior day’s low, adding bearish pressure.
A potential Pivot Point reversal is forming.
This reversal setup is confirmed by increasing Convolution Probability, supporting a higher chance of a directional move.
Trade plan
Long (trend continuation): buy on a break above the August 19, 2025 open.
Short (reversal): sell on a break below the pivot reversal at 158.25.
Stop-loss and position sizing: use volatility-based stops (e.g., ATR multiple) and risk no more than a small fixed percentage of capital per trade.
USDCHF - Demand Zone Meets Falling Wedge!USDCHF is approaching a key demand zone while trading inside a falling wedge pattern.
The price is now retesting the intersection of support and structure, a high-probability area where buyers may step in.
As long as this zone holds, I’ll be looking for long opportunities targeting a potential bounce back toward the upper boundary of the wedge.
⚠️ A break below the demand zone would invalidate this bullish setup and open the door for lower levels.
📚 Always follow your trading plan regarding entry, risk management, and trade management.
Good luck!
All Strategies Are Good; If Managed Properly!
~Richard Nasr

Review and plan for 1st SEPTEMBER 2025Nifty future and banknifty future analysis and intraday plan.
This video is for information/education purpose only. you are 100% responsible for any actions you take by reading/viewing this post.
please consult your financial advisor before taking any action.
----Vinaykumar hiremath, CMT

USDCAD – Shift in Momentum!USDCAD has moved from a strong bullish rally into a clear shift in momentum. After breaking structure with an aggressive drop, price is now moving inside a rising channel that looks more corrective than impulsive.
The previous bullish phase was defined by higher highs and higher lows, but the sharp decline highlighted a potential change in sentiment. Since then, the market has been consolidating, with price pushing higher in a slower and corrective manner.
As long as price remains inside this channel, the bias stays bearish, and I’ll be looking for shorts from the upper boundary around the 1.3880–1.3900 zone. A break below the lower bound near 1.3820 could confirm continuation to the downside.
This is a critical zone for USDCAD, where sellers may step in to regain control.
📚 Always follow your trading plan regarding entry, risk management, and trade management.
Good luck!
All Strategies Are Good; If Managed Properly!
~Richard Nasr

BTC NEW WHALE CANDLE CAN BRING BTC TO 117KBTC did fail to confirm the 113K Target.
But there is still a good chance BTC will return with a whale buying effect to 117K.
117K is an important test level.

THIS CAN BE THE CANDLE THAT WILL BRING BTC BACK TO 117KTHIS CAN BE THE CANDLE THAT CAN BRING BTC BACK TO 117K
Following it with 100% focus.
High chance BTC is going to 117K after confirmation 113K

ALICE MAINNET ON WAY - PRICE CAN MOON TO $1.97ALICE is interesting coin to follow as swing, the price action can show new targets for the upcoming time.

GBPNZD: Trend ContinuationAugust has been a slow month, which I'm hoping volatility with pick up in September. While most pairs have been ranging, GBPNZD has a relatively cleaner trend.
Daily Timeframe:
Over on the daily timeframe, price crossed above a key level that it held below for several months. After crossing up, it found another minor resistance level, which it made another clean break above.
Given the clean breakouts above the resistance levels, this is an indication that the market is pretty one sided. We're not seeing fakeouts or any other indications that sellers still want control.
Hourly Timeframe:
The intraday timeframe is used to optimized my proposed entry. There are two key details here.
The EMA20 is crossing above EMA 60, which is an indication confluence where the intraday trend is aligned with the daily trend.
The pink trendline helps indicate the end of the counter-trend movement. When price crosses above this trendline, it also indicates that I can expect further upside (or that it's very likely).

AUDJPY - The Bears Are Still Strong!Hello TradingView Family / Fellow Traders. This is Richard, also known as theSignalyst.
📈AUDJPY has been overall bearish trading within the falling broadening wedge pattern marked in red and it is currently retesting the upper bound of the channel acting as a non-horizontal resistance.
Moreover, the blue zone is a strong resistance.
📚 As per my trading style:
As #AUDJPY retests the red circle zone, I will be looking for bearish reversal setups (like a double top pattern, trendline break , and so on...)
📚 Always follow your trading plan regarding entry, risk management, and trade management.
Good luck!
All Strategies Are Good; If Managed Properly!
~Richard Nasr

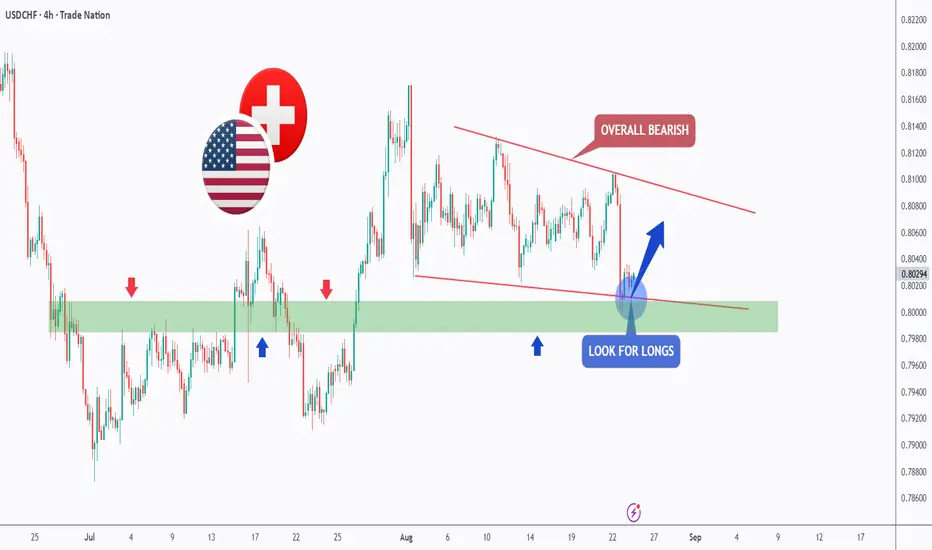
USDCHF – Bearish Channel, But Bulls Eye This Zone!USDCHF has been sliding within a falling channel 📉 , keeping the broader outlook bearish. Yet, the pair is once again testing the 🟩 demand zone, an area that has acted as a strong base in the past.
If buyers manage to hold this level 💪 , we could see a short-term rebound toward the upper bound of the channel.
For now, the plan is simple: while the macro bias stays bearish, this zone offers a potential window for trend-following longs before the sellers step back in.
⚠️ Risk management remains key, as a clean break below the zone would signal that bears 🐻 are tightening their grip.
📚 Always follow your trading plan regarding entry, risk management, and trade management.
Good luck!
All Strategies Are Good; If Managed Properly!
~Richard Nasr
Disclosure: I am part of Trade Nation's Influencer program and receive a monthly fee for using their TradingView charts in my analysis.
NZDCHF: Downtrend MomentumSimilar to NZDCAD, there's a very similar signal on NZDCHF.
Daily Timeframe:
Unlike with NZDCAD, price broke through support very cleanly. It is currently holding below with no indication of a fakeout.
Likewise, EMA20 remains firmly below EMA60, which is the other indication that this is a downtrend.
Hourly Timeframe:
I use an ascending intraday trendline to indicate when the counter-trend movement is coming to an end. As price breaks below the intraday trendline, that's a good indication of confluence in the overall trend direction.
The EMA crossover is not great, which is a little bit of a concern to me. Will need to reduce risk and potential scale into a position depending on how this trade goes.

NZDCAD: Price Holding Below SupportNZDCAD has been in a messy daily range. The daily levels do not hold cleanly. However, I do think there's an opportunity here regardless.
The first trendline break indicates weakness. The second trendline break is cleaner as price is able to hold below this level on the daily timeframe.
Looking at the intraday timeframe, I plotted a trendline to look for confluence. Price crosses below this trendline and is somewhat supported by an exponential moving average crossover.
There is an opportunity to scale into this trade provided that it starts trending cleanly.

S&P (CASH500) | 30min Inverse Head & Shoulders | GTradingMethodHello Traders.
Welcome to today’s trade idea by GTradingMethod.
🧐 Market Overview:
Following Friday’s sharp rally after Jackson Hole, the S&P 500 may be forming a bull flag. If confirmed, this setup could drive an equal measured move higher, with the inverse head & shoulders pattern acting as a potential breakout structure.
📊 Trade Plan:
Risk/Reward: 3.6
Entry: 6460.1
Stop Loss: 6453.8
Take Profit 1 (50%): 6481
Take Profit 2 (50%): 6489
💡 GTradingMethod Tip:
Always wait for confirmation of breakout patterns to avoid false moves.
📌 Please note:
This is not financial advice. This content is to track my trading journey and for educational purposes only.

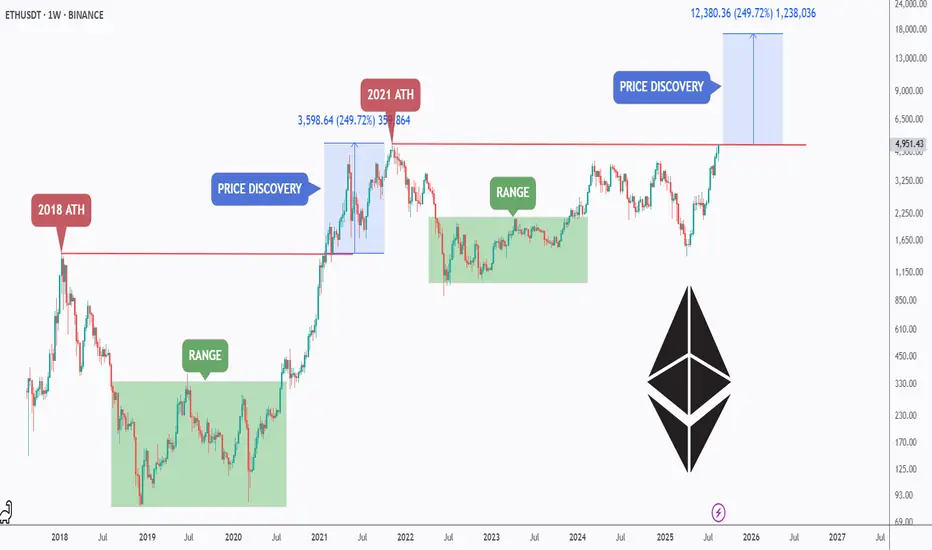
ETH – History Doesn’t Repeat, but It Often Rhymes!Ethereum has officially broken out above its previous ATH structure, entering a new price discovery phase.
📅 In 2018, ETH peaked, then spent years consolidating in a broad range before launching into the 2021 bull cycle.
Once the 2018 ATH was broken, ETH rallied nearly +250% in discovery mode, printing its 2021 ATH.
🏹After another extended range, ETH is now repeating history: breaking out again with room for another price discovery rally.
⏱️If ETH mirrors the last cycle’s percentage gain, the next optimistic target sits around $17,000–$18,000, aligning with a potential +250% leg from current breakout levels. 🚀
Cycles may not repeat perfectly, but they often rhyme — and Ethereum’s structure suggests we could be on the verge of another explosive move.
What do you think — can ETH surprise the market again this cycle? 👀🔥
📚 Always follow your trading plan regarding entry, risk management, and trade management.
Good luck!
All Strategies Are Good; If Managed Properly!
~Richard Nasr
AVAX NEW INCREASE VOLUMEOn the lower time frame, AVAX appears to be building new levels, with a high probability of breaking out soon. We will be following this A-setup coin closely in the coming period
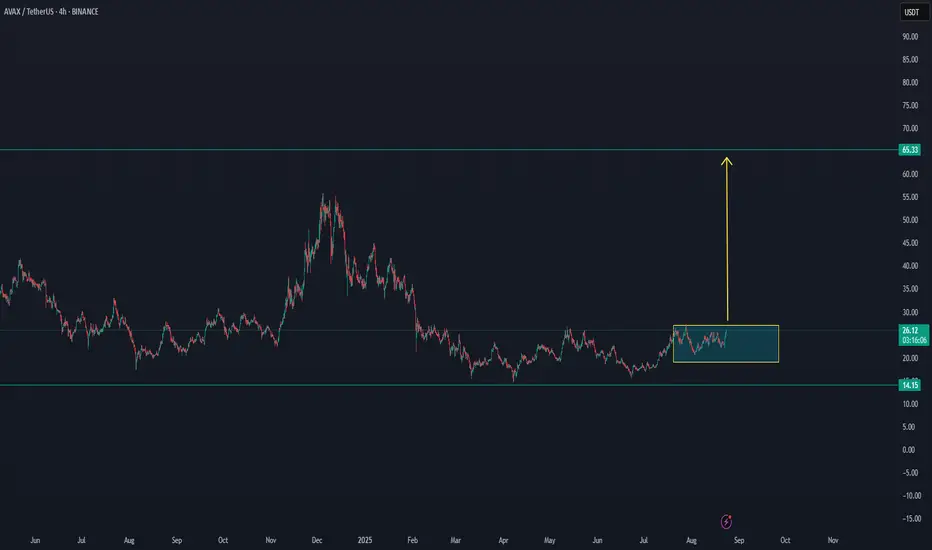
BNC - Where Cycles Meet Opportunity!In our last updates, we tracked how BNC NASDAQ:BNC shifted momentum and entered a bullish structure. Now, price is consolidating at a key support zone, a normal phase in bigger cycles, while the fundamentals continue to strengthen behind the scenes.
📊 Technical Analysis
- Cyclic rhythm: Price continues to respect cyclical lows (highlighted in green), suggesting we’re in a repeating accumulation/rebound structure.
- Support in play: The $20 - $21 level is being tested again, with the stronger $15 support zone still intact as a line in the sand for bulls.
- RSI confluence: Momentum indicators (RSI) are once again dipping into oversold territory, just as they did at the last local low, hinting at potential buyer re-entry.
- 200 MA: Price is sitting near the 200-period MA, adding another layer of dynamic support to watch.
If bulls hold the $20 area, we could see another cyclical rebound play out, targeting higher highs in the weeks ahead.
💡 Bigger Picture
What makes BNC stand out isn’t just its bold BNB strategy — it’s the timing . The crypto market is maturing, yet most U.S. investors are still locked out of direct BNB exposure. ETFs and sovereign funds are circling, but haven’t moved yet.
That means BNC is positioning itself ahead of the institutions - offering retail investors the rare chance to front-run Wall Street. It’s the kind of countercultural setup that often leads to the biggest asymmetrical gains: buy before the herd, hold before the headlines.
📌 Previous BNC analysis is attached for context.
➡ ️ Talk to your financial advisor and start your due diligence on CEA Industries (NASDAQ: BNC) before the institutions move in.
📚 Always follow your trading plan => including entry, risk management, and trade execution.
Good luck!
All Strategies Are Good, If Managed Properly.
~ Richard Nasr

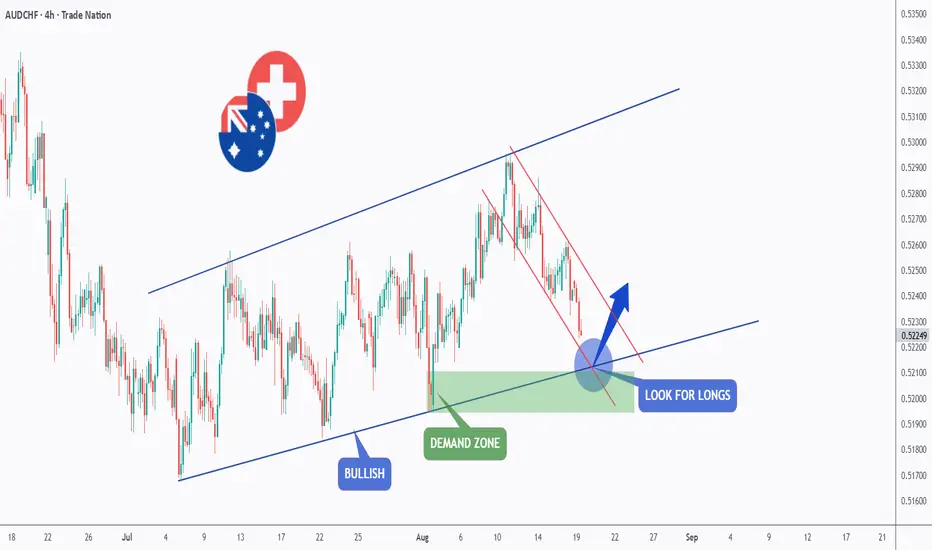
AUDCHF – Bulls Preparing for a Comeback?AUDCHF has been trading inside a broad ascending channel, showing a clear bullish structure. Recently, price pulled back within a corrective descending channel and is now approaching a key demand zone aligned with the lower bound of the channel.
🔎 If buyers step in here, we could see a potential reversal and continuation of the overall bullish trend.
👉 Plan: Look for long opportunities as price reacts around the demand zone and channel support.
📚 Always follow your trading plan regarding entry, risk management, and trade management.
Good luck!
All Strategies Are Good; If Managed Properly!
~Rich
Disclosure: I am part of Trade Nation's Influencer program and receive a monthly fee for using their TradingView charts in my analysis.
AUDCAD At Make-or-Break Zone – Time to Ride the Bulls?AUDCAD has been overall bullish trading within this rising channel 📈
Right now, price is retesting the lower bound acting as support 🔑
As long as this zone holds, I’ll be looking for longs targeting the upper bound 🎯
Patience is key here ⏳ — let the bulls step in, then ride the next impulse 🚀
📚 Always follow your trading plan regarding entry, risk management, and trade management.
Good luck!
All Strategies Are Good; If Managed Properly!
~Rich
Disclosure: I am part of Trade Nation's Influencer program and receive a monthly fee for using their TradingView charts in my analysis.

GBPJPY – Bulls Knocked Out, Bears Step In!After rejecting the 200.00 resistance, GBPJPY broke below key structure and shifted momentum to bearish.
Price is now retesting the broken support turned resistance, aligned with a descending trendline.
🔎 As long as this area holds, the bias remains bearish with potential for another downward leg.
👉 Plan: Look for short opportunities around the retest zone.
📚 Always follow your trading plan regarding entry, risk management, and trade management.
Good luck!
All Strategies Are Good; If Managed Properly!
~Rich
Disclosure: I am part of Trade Nation's Influencer program and receive a monthly fee for using their TradingView charts in my analysis.
