Review and plan for 9th February 2026Nifty future and banknifty future analysis and intraday plan.
This video is for information/education purpose only. you are 100% responsible for any actions you take by reading/viewing this post.
please consult your financial advisor before taking any action.
----Vinaykumar hiremath, CMT
Trend

ZEC: bounce or trap? key levels and targets for todayZECUSDT. Thinking this old privacy coin is dead, or is this where the dead cat actually jumps? Fresh headlines about regulators circling privacy projects again plus weakness across alts pushed ZEC into a real flush, but today we finally got a sharp bounce off the lows and traders woke up.
On the 4H chart price knifed down into a demand area near 210 and snapped back, with RSI coming out of extreme oversold - classic short squeeze setup. VPVR on the right shows a low volume pocket above, then chunky volume around 250-270 that can act like a magnet if buyers keep pressing. I lean long for a relief move, not a full trend reversal.
My base plan: look for dips toward 230-235 to build a small long with invalidation under 215, first target around 253, stretch target 270 ✅. If 215 fails and price falls back into the lows, the door opens to the next support zone near 190 ⚠️. I might be wrong, but for me this is a spot where bears start to get greedy and I prefer to fade that.

Litecoin: potential bounce or deeper drop? key levels to watchLitecoin. Catching the falling knife or loading a discount alt bluechip here? While the whole crypto market just got washed out on fresh regulatory noise and another wave of BTC volatility, LTC dumped into multi‑month lows and finally printed a nasty but promising wick from the 44–45 area. According to market chatter, majors are seeing rotation back in as panic cools off.
On the 4H chart price bounced to 52–53 after a vertical selloff, RSI was buried under 30 and is curling up, and there’s a clear volume gap above current levels. I’m leaning toward a relief rally: first magnet for me is the 57–58 zone, then stronger supply around 60–62 where the big volume shelf starts. Trend is still bearish overall, so I treat this as a counter‑trend squeeze, not a new bull market… yet. I might be wrong, but dead cats usually bounce higher than this.
My base plan: ✅ look for longs only while price holds above 50–51, targeting 57–58 and possibly 60–62 if momentum stays hot. ⚠️ If 50 gives way again, I expect sellers to drag LTC back to 45–46 and maybe sweep that spike low. I’m stalking a small long on dips toward 51 with stops tucked below 49, and I’ll happily flip bias if we lose that support with volume.

Stellar: bounce ahead or more pain? key levels to watchStellar. Knife catching or discount hunting? Recently the whole alt sector got hit as traders rotated out of risk after fresh macro comments, and according to market news Stellar just rode that same liquidation wave. Price flushed into fresh lows, sentiment is in the gutter... exactly where interesting bounces usually start.
On the 4H chart we have a waterfall drop into the 0.15 area with a volume spike and RSI buried in oversold, starting to curl up. Local HVN sits around 0.17, so any short squeeze has a natural magnet there, with heavier supply stacked higher near 0.185-0.19. Technically I lean to a relief long scenario, not a fresh trend reversal yet. ✅
My base plan: watch 0.15-0.152 as a bounce zone, with intraday targets at 0.17 first, then 0.185 if buyers stay brave. If 0.145 gives way and price can't reclaim 0.16 quickly, I drop the long idea and expect continuation toward 0.14-0.135 instead. I might be wrong, but this looks more like late capitulation than a comfortable place to open new shorts, so I’m only interested in tactical longs here with tight risk.

OKLO 1D: Transition phase after declineOn the daily chart OKLO has shifted from a prolonged downtrend into a basing phase. After a sequence of lower highs and lower lows, price broke out of a falling wedge and pulled back into a demand zone. Selling pressure failed to resume and recent lows remain intact.
From a structural perspective, price action reflects a complex base following the decline. The 80–90 area remains pivotal, aligning with the 200-day moving average and the 0.786 Fibonacci retracement. This confluence has already produced multiple reactions, reinforcing its relevance. Momentum indicators confirm stabilization rather than trend continuation, with MACD exiting negative territory while ADX remains subdued.
The primary structural reaction level sits near 115, marking the upper boundary of the current base. Acceptance above this area would open the door for structural expansion toward the 160 region. Failure to hold the 80–90 zone would invalidate the basing scenario and return price to a neutral structure.
From a fundamental standpoint the company remains early stage. EPS TTM stands at −9.68, with Q4 2025 EPS estimated at −0.17. Revenue remains absent, while cash flow stays negative, with operating cash flow at −62.2M and free cash flow at −68.5M. Liquidity remains strong, with cash per share at 6.13 and minimal debt, supported by recent capital inflows. Enterprise value is currently estimated at 13.8B.
At this stage the market is pricing structure and expectations rather than earnings. Price behavior within the base will define the next directional phase.
Price action leads before fundamentals follow.

Chainlink: bounce or break? key levels to watch aheadChainlink. Who’s trying to catch this falling knife and actually grab the handle? After the latest risk‑off wave in crypto, LINK got hammered as traders rotated out of DeFi names, and according to market chatter funding flipped heavily negative and sentiment went full doom mode.
On the 4H chart we’re in a clean downtrend, but the last leg looks like a selling climax: long lower wick, big volume, RSI stuck in oversold around 25. Price is sitting below a fat volume node around 8.8–9.0 that used to be support and now looks like the first serious supply zone. So my base case is a relief bounce into that 8.8–9.5 pocket before bears decide what’s next.
✅ Plan: I’m only interested in a counter‑trend long if price holds above 8.0 and starts building a small base, with targets 8.8 then 9.5. ⚠️ If 8.0 gives way on strong volume, I expect a slide toward 7.2–7.0 where the next demand cluster sits. I might be wrong, but shorting straight into an exhausted dump has rarely been a profitable hobby for me.

Why Market ChangesMarkets change because participation changes. Price is not driven by patterns. It is driven by order flow, liquidity conditions, and shifting incentives across timeframes. When those inputs change, the behaviour of the chart changes with them. The same strategy can look flawless for weeks and then feel unusable, not because the market became random, but because the environment that supported the edge is no longer present.
One driver is liquidity. Crypto liquidity is not stable. Depth increases during overlap sessions and dries up during dead zones. When liquidity is thick, moves are cleaner, levels respect more often, and retests tend to hold. When liquidity thins, spreads widen, stops get tagged more frequently, and structure becomes less reliable on lower timeframes. Many traders call this manipulation. It is often just a liquidity problem.
Another driver is volatility regime. Volatility expands when uncertainty rises, new information enters, or leverage builds and gets forced out. Volatility compresses when participation slows and the market waits for fuel. Strategies that rely on tight invalidation distance struggle during expansion because candle ranges widen and execution becomes less precise. Strategies that rely on momentum struggle during compression because price rotates without follow-through. A strategy does not stop working. It becomes mismatched with the regime.
Market phase also matters. Trends, ranges, and transitions behave differently because the market is doing different work. Trends move between liquidity pools with momentum. Ranges build inventory and sweep both sides repeatedly. Transitions are messy because control is shifting and both sides are active. Traders lose most money in transitions because they apply trend logic to a market that is no longer trending.
Timeframe alignment is another source of change. A clean intraday trend can exist inside a higher timeframe range. A strong lower timeframe breakout can occur while the higher timeframe is still completing a liquidity objective in the opposite direction. When timeframes are aligned, trades feel easy. When timeframes conflict, trades feel like constant stop hunts.
Finally, participants adapt. When one side becomes crowded, the market seeks the liquidity created by that crowd. Retail tends to chase clean breakouts and obvious levels. Larger participants use those obvious levels to fill positions. As positioning shifts, the market shifts with it. Price changes behaviour because the incentives behind price change.
The practical takeaway is simple: your job is not to predict direction. Your job is to diagnose environment before you execute. Liquidity conditions, volatility regime, market phase, and timeframe alignment should decide whether you trade aggressively, trade selectively, or stay flat. Consistency comes from adapting exposure to conditions, not forcing the same behaviour onto every chart.

Cardano: dip to buy or more downside? key levels to watchCardano – dip to buy or just another dead cat bounce? Altcoins are still lagging while the market focuses on majors, and Cardano got hit harder than most, now chopping right around 0.30. According to industry chatter, interest is there, but real money is waiting for a clear signal, not a hope-and-pray bounce.
On the 4H chart I see a clean downtrend with a small sideways range that looks more like a bear flag than a bottom. RSI bounced from oversold but is still below the 50 zone, and the volume profile shows heavy supply stacked above 0.31–0.34, exactly where those red resistance blocks sit. That combo makes me lean short term bearish, expecting sellers to fade any spike.
My base plan: watch for a push into 0.305–0.315 and look for rejection candles, with downside targets near 0.285 and then the 0.27 support area ✅ Invalidation for this idea is a firm 4H close above 0.32, which could squeeze price toward 0.335–0.345 instead. I might be wrong, but I’d rather ride the existing trend than try to play hero catching knives.

Gold Price Analysis – Sell Setup ActiveXAUUSD – H4 Analysis
Gold prices have respected the old lower order block and are seen pushing upwards from there.
However, the price is still trading below the 50 DEMA, so the overall trend is still bearish (down).
Entry: Sell 4965
Targets:
First Target: 4800
Final Target: 4780
Stop Loss: 5080 Above 50 DEMA
As long as the price does not sustain above the 50 DEMA, the upside should only be considered a pullback, and the trend is not changed.
Disclaimer:
This analysis is for educational purposes only. It is not financial advice. Trading involves risk, so always do your own research and manage risk properly before taking any trade.

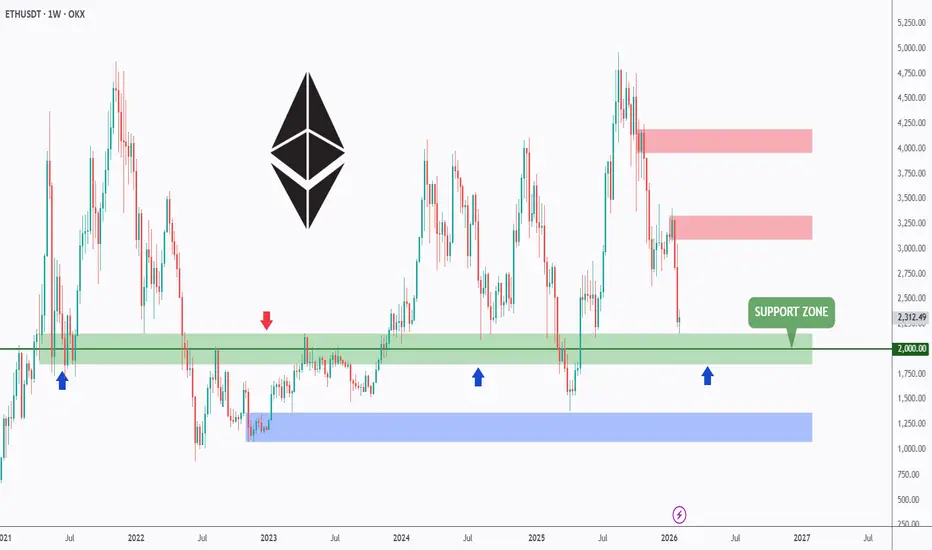
ETH at Big Support: Hold or Break?ETH is now retesting the $2000 support zone, a level that has acted as a major decision point multiple times in the past.
Each time ETH reached this area, the market paused, reacted, and chose its next direction carefully.
From a structure perspective, this is not a random level. It’s a long-term support that previously flipped roles between resistance and support, making it a key battlefield between buyers and sellers.
As long as this support holds, the focus remains on stabilization and potential recovery attempts from this zone.📈
But if this level fails, the door opens for a deeper move toward the lower demand area highlighted below.📉
Will buyers defend it one more time… or is this where the structure finally gives way? 👀
⚠️ Disclaimer: This is not financial advice. Always do your own research and manage risk properly.
📚 Stick to your trading plan regarding entries, risk, and management.
Good luck! 🍀
All Strategies Are Good; If Managed Properly!
~Richard Nasr.
GBPNZD - Two Magnets, Two Clear JobsGBPNZD is trading between two zones that keep acting like magnets:
On the upside, the red structure has been attracting price again and again. Every time price reaches that area, sellers show up. As long as that structure holds, that’s where I’ll be looking for shorts.📉
On the downside , the blue demand zone keeps pulling price back in. That’s where buyers previously stepped in with strength. As price approaches that zone, I’ll be looking for longs.📈
For now, we wait!⏱️
Which magnet do you think price hits next? 🤔
⚠️ Disclaimer: This is not financial advice. Always do your own research and manage risk properly.
📚 Stick to your trading plan regarding entries, risk, and management.
Good luck! 🍀
All Strategies Are Good; If Managed Properly!
~Richard Nasr

Nifty - Bearish After hitting our previous targets.. as per my study i believe the markets will consolidate from here. It will definitely touch 25458 in the near term.

A Supply-and-Demand View of the Japanese YenPattern recognition and technical analysis are the foundations of price action in forex trading. Supply and demand dictate that for markets to be in equilibrium, demand must equal supply. Excessive supply without compensatory demand causes prices to crater, vice versa is true.
Post Covid, the Japanese Yen has been on a steady decline mimicking the Yen futures. The price decline for the 5-year period caused a price imbalance that markets must correct via bullish price action targeting the supply zone at 0.0089 price handle.
Presently, on the daily charts, we have a confirmed signal of bullish reversal. Once price contacts the short-term imbalance/fair value gap at 0.0064 we will be on the look out for buying opportunities at the liquidity levels of 0.0063 price handle.

BTC Dominance: crucial resistance ahead? key levels to monitorBTC Dominance. Tired of watching your alts bleed while BTC soaks up all the liquidity? According to market sources, fresh spot inflows and a bit of risk-off mood just pushed dominance back to the big psychological 60 zone, right into a thick resistance band that has been capping price for weeks.
On the 4H chart we’re sitting under a heavy red supply at 60-60.5 with a bunch of long upper wicks - clear sign of aggressive sellers. RSI is making a lower high while price retests the top, classic bearish divergence, and there’s a fat volume shelf below 59 that often drags price back. So I’m leaning toward a short-term drop in dominance, which usually means some breathing room for alts.
✅ Base case: rejection from 60-60.5 and a move back toward 59, then 58-57 if rotation into alts really kicks in. ⚠️ If dominance closes and holds above 60.5 with strong momentum, I scrap the alt-bounce idea and look for 61+ and more pain for laggards. I don’t trade BTC.D directly, but I’m slowly tilting from BTC into stronger alts here - I might be wrong, but that’s the hill I’m willing to stand on.

APGO - Trend Intact, Pullbacks Are Opportunities!In the previous update, we highlighted APGO’s transition out of long-term accumulation and into early markup.
Zooming into the Daily timeframe, now price is doing exactly what strong trends tend to do next: pause, reset, and offer structure-based entries.
📊 Technical Analysis
TSXV:APGO remains inside a rising price channel , confirming that the long-term trend is still bullish.
⚔️The current retracement is unfolding toward a confluence support zone, what I call “TRIO RETEST” , where multiple technical factors align:
- The lower boundary of the rising channel
- The rising EMA , acting as dynamic support
- The $5 round-number , now acting as a key structural level
This area represents a classic trend-following zone , where buyers typically look for continuation opportunities rather than reversals.
As long as price holds above channel support and above the $5 level, the technical bias remains to the upside.📈
🧠 Structure Perspective
In strong trends, price rarely moves vertically.
Pullbacks are part of the process, they reset momentum and reinforce structure before the next impulse.📈
📌 Bottom Line
APGO remains in a bullish technical structure , with the current pullback unfolding as a normal correction within an established uptrend.
From a fundamental standpoint, Apollo Silver is directly leveraged to silver🥈 , a metal at the core of energy transition, AI infrastructure, and defense applications.
With one of the largest undeveloped silver resources in the U.S. , and additional exposure to critical minerals like barite and zinc🗻, the company sits at the intersection of macro demand and strategic supply constraints.🔎
As long as price holds above key structure, the combination of trend alignment and supportive fundamentals keeps the focus on continuation rather than distribution.
⚠️ Always do your own research and speak with your financial advisor before investing.
📚 Stick to your trading plan, entry, risk management, and execution.
All strategies are good; if managed properly.
~ Richard Nasr
Disclaimer: I have been paid $900 by CDMG, funded by Apollo Silver Corp., to disseminate this message.

Gold - A Healthy Reset, Not a Breakdown!Gold just went through a ~20% corrective move, and honestly… this is exactly what strong trends tend to do. They don’t go straight up forever. They pause, reset, and shake out weak hands.
What matters now is where this correction is happening.
Price is reacting off a major confluence:
- The rising blue trendline
- The $4500 round number
- The demand zone in blue
That intersection is doing its job. Buyers stepped in right where they were supposed to.
As long as this zone holds, the bullish structure remains intact, and the bias stays the same:
👉 look for trend-following longs on lower timeframes!
⚠️ Disclaimer: This is not financial advice. Always do your own research and manage risk properly.
📚 Stick to your trading plan regarding entries, risk, and management.
Good luck! 🍀
All Strategies Are Good; If Managed Properly!
~Richard Nasr

Ethereum: relief rally or more downside? key levels to watchEthereum. Who else watching this knife finally stop spinning? After the brutal flush from the 3k area toward 2.2k, headlines talk about forced liquidations and a reset in leverage according to market sources. On that backdrop ETH on the 4H is parking right inside a major demand zone from December.
On the 4H chart we see price bouncing off 2.2k with a fat volume shelf below and a VPVR gap above into 2.4k. RSI was ultra oversold and is now turning up while price holds a slightly higher low - early bullish divergence. That combo for me points to a relief move rather than an instant new crash. I am leaning long toward 2.38k first, then 2.5k if shorts start to cover.
✅ Base plan: as long as 2.23k-2.25k support holds on 4H closes, I treat dips to 2.3k as buy-the-dip territory with targets 2.38k and 2.5k. More cautious traders can wait for a clean break and retest of 2.38k from above before stepping in. ⚠️ If 2.23k snaps and RSI dumps back under oversold, the structure flips and opens the door to 2.1k and maybe lower - I might be wrong, but I would not want to be holding longs there. I am flat for now, stalking either a sweep of 2.2k with strong rejection or a confirmed higher low before committing capital.

#XAUUSD (Gold) -Trend Analysis: 26/01/26 to 30/01/26#XAUUSD 1H chart illustrates the performance of the Ryan-Trend Pulse indicator during the final week of January 2026. showing how a systematic approach can navigate both parabolic rallies and sharp trend reversals.
The market maintained a strong bullish posture through January 29th, where successfully captured the upward momentum. However, as the market reached local exhaustion & price shifted. Following a hit to our Stop Loss on the long side, the indicator immediately identified a structural shift, provided an instant reversal entry.
By transitioning from a Long position to a Short as the trend reversal, we were able to capitalize on the subsequent sell entries, effectively recovering the initial loss and moving into significant profit.
Consistency in trading comes from the math, not just the entries. I maintained a strict 1:1 Risk-Reward Ratio, Risk per Trade: 3% of total capital.
Despite the mid-week reversal and the SL hit, the high-probability nature of the trend-following signals resulted in a 15% net profit for the week.
The currently the price shows the market in a sustained bearish correction following the blow-off top near $5,600. We currently have one Short position running in profit, with the indicator maintaining a bearish bias as we head into February 2026.
Disclaimer: Past performance does not guarantee future results. This indicator is a tool for technical analysis and should be used in conjunction with a complete trading plan and proper risk management.


Review and plan for 30th January 2026Nifty future and banknifty future analysis and intraday plan.
This video is for information/education purpose only. you are 100% responsible for any actions you take by reading/viewing this post.
please consult your financial advisor before taking any action.
----Vinaykumar hiremath, CMT

BTC - Building BlocksRight now, BTC is short-term bearish, trading below the green structure around $90,000. As long as price remains under this level, upside momentum stays capped and the market is vulnerable to more downside.
The key risk level is clear:
If BTC breaks below the lower blue trendline, this would signal a shift into a long-term bearish phase, opening the door for a deeper move toward the $80,000 area.
On the flip side, there’s still a bullish path:
If BTC manages to reclaim and hold above the $90,000 structure, momentum flips back in favor of the bulls, with price targeting the upper bound of the wedge near $100,000.
⚠️ Disclaimer: This is not financial advice. Always do your own research and manage risk properly.
📚 Stick to your trading plan regarding entries, risk, and management.
Good luck! 🍀
All Strategies Are Good; If Managed Properly!
~Richard Nasr

AUDUSD - When Structure Meets RealityAUDUSD is now retesting a strong technical intersection:
the weekly resistance marked in green is lining up perfectly with the upper bound of the weekly rising channel in blue.⚔️
On top of that, price is sitting in an over-bought zone after an extended push higher.
As long as this intersection holds, the odds favor a bearish correction, with price rotating lower toward the lower bound of the channel. This wouldn’t be a trend reversal, but a healthy reset within the bigger structure.
If this zone gets cleanly broken and accepted above, then the narrative changes.
Until then, I’m respecting resistance and letting structure lead the bias.
⚠️ Disclaimer: This is not financial advice. Always do your own research and manage risk properly.
📚 Stick to your trading plan regarding entries, risk, and management.
Good luck! 🍀
All Strategies Are Good; If Managed Properly!
~Richard Nasr

Review and plan for 29th January 2026Nifty future and banknifty future analysis and intraday plan.
This video is for information/education purpose only. you are 100% responsible for any actions you take by reading/viewing this post.
please consult your financial advisor before taking any action.
----Vinaykumar hiremath, CMT
