USDJPY - Red Low or Orange Resistance: Your Trigger Map!USDJPY squeezed off 146.0 and is testing the 148.8–149.2 orange resistance on the 4H while momentum cools.
Here’s the plan 🔑
If the last low in red is broken downward, the bears take over, and I’ll look for 147.2 first, then the 146.0 support zone.
If the orange resistance is broken upward and holds, I’ll expect continuation toward the upper supply at 150.7–151.0 (with 150.0 as a waypoint).
What’s your move => fade a failure at the orange band, or buy a clean break and hold into 150s? 🤔
⚠️ Disclaimer: This is not financial advice. Always do your own research and manage risk properly.
📚 Stick to your trading plan regarding entries, risk, and management.
Good luck! 🍀
All Strategies Are Good; If Managed Properly!
~Richard Nasr
Trend

USDJPY - Support Holding Strong!📈USDJPY has been overall bullish trading within the rising channel marked in blue.
This week, USDJPY has been bearish trading within the falling red wedge and it is currently rejecting the lower bound of it!
Moreover, the orange zone is a strong support.
🏹 Thus, the highlighted blue circle is a strong area to look for buy setups as it is the intersection of the lower red trendline and orange support.
📚 As per my trading style:
As #USDJPY is around the blue circle zone, I will be looking for trend-following bullish reversal setups (like a double bottom pattern, trendline break , and so on...)
📚 Always follow your trading plan regarding entry, risk management, and trade management.
Good luck!
All Strategies Are Good; If Managed Properly!
~Richard Nasr

S&P500: Flash dump continues, short bias remains!
📝 1. Market Context
BLUEBERRY:SP500 Yesterday’s analysis highlighted the weakness after the market failed at resistance. Today, that scenario was confirmed with a flash dump and a sequence of strong red candles, signaling sellers remain firmly in control. The short-term structure continues to print lower highs and lower lows, which clearly reflects the dominance of the bearish trend.
🟥 2. Resistance Zone
The 6,651 – 6,658 area (red zone on the chart) continues to act as a critical resistance. This zone is reinforced by 4 levels of resistance combined with moving averages (MA). Moreover, the latest bounce is still contained within a large red candle, signaling that buyers lack the strength to shift momentum.
Each time price tested this zone, it faced strong rejection. As long as the market trades below this red zone, the dominant trend remains bearish.
📉 3. Bearish Trend & Downside Targets
Currently, the market has confirmed the bearish trend by consistently forming lower highs. This is already the third bearish leg since the downtrend began – and according to wave logic, the third leg often turns out to be the strongest one, provided resistance at 6,658 holds.
• Immediate target: 6,629 – 6,615 (a key support cluster that previously rejected price).
• If broken: selling pressure could push the market further down toward 6,578 and even 6,560 – both strong technical and psychological support levels.
✅ 4. Conclusion
The S&P500 has confirmed its bearish trend with a flash dump. The 6,651 – 6,658 area remains the critical resistance, and as long as price stays below this zone, sellers have the upper hand. The bearish scenario remains valid with the first target at 6,629 – 6,615, and if this support fails, the move could extend toward 6,578 – 6,560.
Please like and comment below to support our traders. Your reactions will motivate us to do more analysis in the future 🙏✨

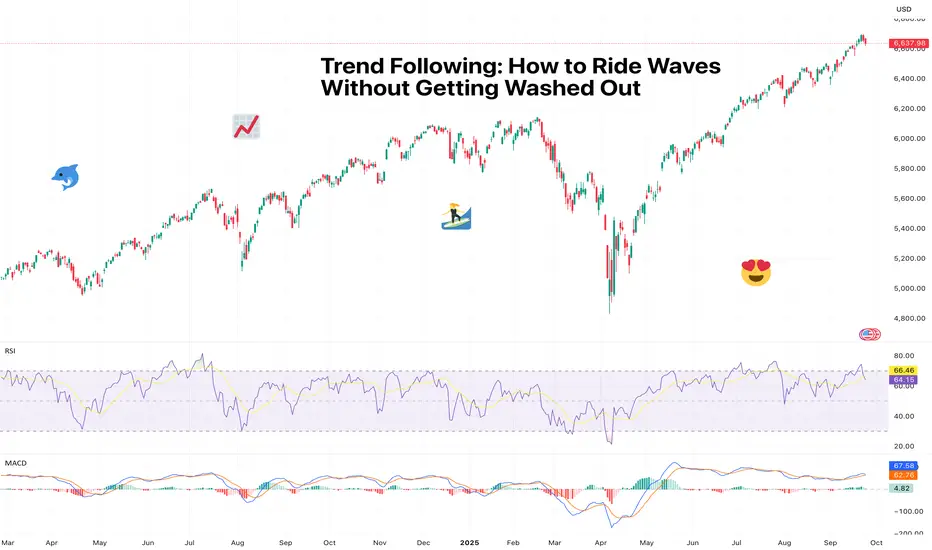
Trend Following: How to Ride Waves Without Getting Washed OutMarkets move in waves. Easy, right? But if you’ve tried catching one only to find out you get washed out, you’ve realized it ain’t’ that easy.
Sometimes there are gentle ripples that lull traders into boredom, other times they’re tsunamis that wipe out everything in sight.
The trick isn’t predicting when the next big set will hit – it’s learning how to catch it without falling off your board from the get-go. That’s where trend following comes in. Simple, structured, and surprisingly effective, it’s a strategy that says: stop guessing, start riding.
🌊 Catching It, Not Fighting It
At its core, trend following is about spotting momentum and sticking with it. If prices are climbing, you’re a buyer. If they’re falling, you’re a seller. No need to argue with the market about “fair value.” The trend follower’s mantra is: Mr. Market is always right, I’m just here to hitch a ride.
Why does this work? Because markets are essentially a bunch of thinking participants who move in herds. They share the same fears, hopes, expectations, and goals.
Traders, funds, and algorithms pile into the same ideas, technical patterns, and price levels, pushing valuations higher or lower. Your job isn’t to outsmart the herd – it’s to ride with it until the stampede loses steam.
Or better yet, spot the opportunity before the herd. "I am the animal at the head of the pack. I either get eaten, or I get the good grass,” says David Tepper, hedge fund manager.
🤫 Why It’s Harder Than It Sounds
“Buy high, sell higher” feels wrong anywhere but in the market. Human brains are usually wired to hunt for bargains, not chase expensive things. But there’s something about a record high that pulls you in and makes you say “Take my money!”
Traders love to bet on success. So when they see that Bitcoin BITSTAMP:BTCUSD is at $117,000 , near a record, it’s easier to throw cash than when it’s crashing and burning at a 60% discount.
True, no trend stays intact after a huge drop. But sometimes it’s better to see confirmation that the trend is exhausted than to exit during a mild dip and risk missing out on the big move.
Trend following isn’t about catching every top or bottom. It’s about accepting that you’ll never time it perfectly, but if you stay disciplined and let the trend play out, you’ll capture at least some of the move.
But in trading everything’s possible – some prefer to catch tops and bottoms, and that’s completely fine as long as it works.
“For twelve years I have been missing the meat in the middle but I have made a lot of money at tops and bottoms,” says Paul Tudor Jones, another big name in the industry.
📈 Tools of the Trade
So how do you know a trend is worth following? Traders lean on a few classics:
• Moving averages : If the 50-day is above the 200-day, that’s your green light. Prices above both? Bullish trend intact. Prices dive below the 200-day? Cue that a bear market is here.
• Support and resistance : Connect the dots (literally) and see if the price is respecting an upward or downward slope.
• Breakouts : When the price pops above resistance or drops below support on big volume, that’s the market saying, “Watch this.”
• Reversals : For those that like to live on the edge, spotting reversals might be a good way to catch a move from start to finish.
The trick isn’t in the tool itself, but in sticking to the plan when the inevitable wiggles and pullbacks happen.
🚤 Don’t Mistake Chop for Trend
Not every chart with bars pointing up is a trend. Sometimes you’re just looking at chop – those sideways, back-and-forth price moves that exist to chew up stop-losses and ruin Fridays.
Trend followers learn to wait for confirmation. That could mean a clean breakout with volume, or a moving average crossover with conviction. Enter too early, and you may find yourself drowning in false signals.
A confirmation is oftentimes triggered by economic news and reports. So pay attention to big and small releases stacked in the Economic Calendar .
🛟 The Stop-Loss Lifeboat
Here’s a little secret of trend following: you’ll be wrong a lot. The method is built around small losses and (occasional) big wins. That’s why stop-losses are essential . You’re not trying to win every trade, you’re trying to catch the few monster trends that more than pay for the slip-ups.
Think of it like surfing: you’ll get wiped out plenty of times, but you only need one clean wave to make the day worthwhile.
📊 The Math Behind the Swings
Why does this work over time? Because of asymmetric returns. If you risk $1 to make $3, you only need to be right 30% of the time to profit. Trend followers build systems where the losers are cut quickly, but the winners are allowed to run. That’s where the proper risk-reward ratio comes in.
Most traders do the opposite. They cut winners too early (“I’ll take my quick profit!”) and let losers drag on (“It’ll bounce, right?”).
🧩 Famous Trend Followers
This isn’t just theory. The Turtle Traders in the 1980s—an experiment by Richard Dennis and William Eckhardt—proved that complete novices could learn a rules-based trend following system and make millions. Fast forward, and big CTAs (Commodity Trading Advisors) still run billions using similar strategies today.
They all share one principle: don’t predict, only follow.
⏳ Patience Pays
The hardest part isn’t identifying trends. It’s sticking with them. Every pullback will tempt you to bail. Every analyst estimate, every scary headline, even your cousin at Thanksgiving telling you “Ether’s going to zero” will test your patience.
But trends don’t end because you got nervous. They end when the move breaks. Patience is what separates the trend followers who catch the big wave from the ones stuck paddling.
🎯 Final Take: Ride It Out
Trend following may not make you look like Paul Tudor Jones calling tops and bottoms. But it will keep you aligned with where the money is flowing. And when you’re on the right side of a trend, the ride is smoother, the wins are bigger, and the stress is lower.
Off to you : When’s the last time you got a nice wave and surfed it out to completion? Share your experience in the comments!
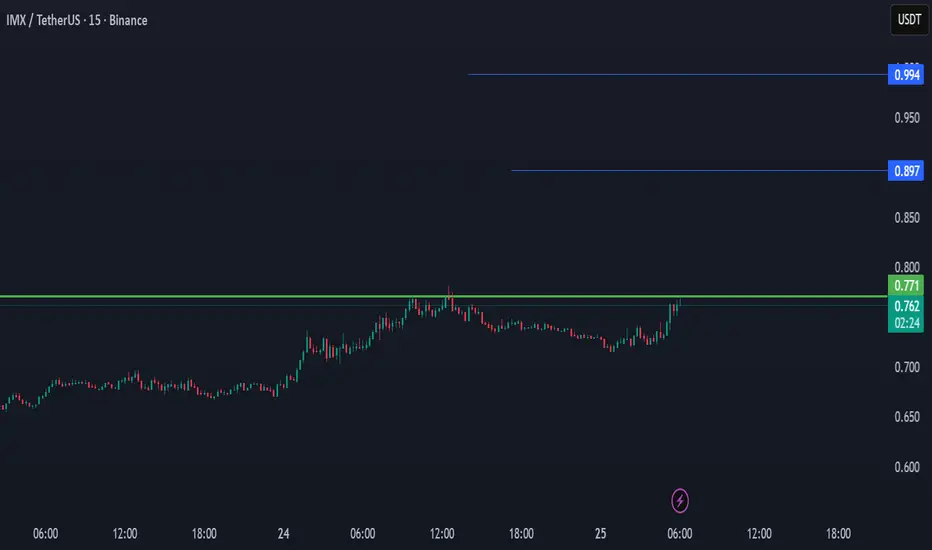
IMX NEW INCREASE VOLUME📊IMX has a pre-scan increase, which could build to a real increase in the coming time frame.
With the View of 2 levels, what IMX can target
Between $0,73 and $0,75, possibility of new uptrend volume
With the data study, this coin comes out as a coin that can show a new increase, even with the breakdown of the main market.
We will follow it to see what the possibilities are
AUDCAD: Trend ContinuationThere's a trend continuation opportunity present on the AUDCAD pair. Here's my breakdown by timeframe.
Daily Timeframe:
Price pulled back and held supported at EMA20, which isn't a strong indication of support
Strong uptrend is indicated by EMA20 above EMA60
H1 Timeframe:
There's confluence here where Price is exiting the EMA20/60 band
EMA20 also remains above EMA60 for a strong uptrend
Pricing breaking DTL also remains valid as there was upside momentum

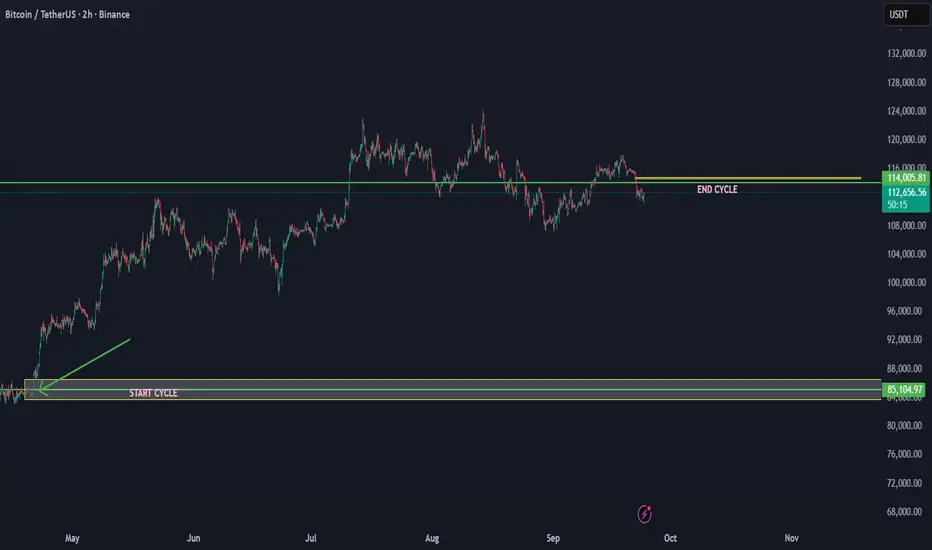
The BTC cycle that started at 84K is projected end at 114K This is a cycle update for BTC/USDT. Based on the cycle data, the cycle that started at 84K has ended at 114K. This indicates that we are now entering a new major trend breakdown in the cycle. It can take time, but when there is a new uptrend cycle, we will add.
This time frame and action made the end of the cycle that started from 84K
This could mean that btc can enter below 110K in the coming time. We have seen more times in the history of BTC that by the cycle end, the trend breaks down in steps.
US100 Trend Watch – Critical LevelsUS100 Update
On the low time frame, US100 is consolidating around the 24,603 – 24,655 zone after rejecting higher levels.
Key levels:
24,655 – 24,603 → short-term resistance zone. A breakout and hold above would confirm bullish continuation.
24,158 → main trend support. As long as this level holds, the broader bullish structure remains intact.
Upside scenario: If price breaks and sustains above 24,655, momentum could extend further to test 25,000+.
Downside risk: If price falls below 24,603 and especially under 24,158, risk increases for a deeper pullback toward 23,800 – 23,400.
📌 Summary
Above 24,655 → bullish continuation toward new highs.
Hold above 24,158 → uptrend structure remains safe.
Below 24,158 → deeper correction risk, next support at 23,400.

ETH - Near ATH… Price Discovery Reload?BINANCE:ETHUSDT ETH has marched back to its cycle ceiling on the weekly after a long range. We’re now pressing the final resistance band around $4,880–$5,000—where a clean breakout would shift ETH into price discovery again.
Confluence is strong here: prior ATH supply + round-number magnet + momentum structure. If buyers clear $5K with a weekly close, I’ll look for the next leg toward $6.5K–$7.25K, then a stretch path into five digits as discovery unfolds. If rejected, a healthy retest toward $4,100–$3,550 would keep the uptrend intact while the range persists.
What’s your plan => buy the weekly breakout above $5K, or wait for a dip into $4.1K for better risk–reward? 🤔
⚠️ Disclaimer: This is not financial advice. Always do your own research and manage risk properly.
📚 Stick to your trading plan regarding entries, risk, and management.
Good luck! 🍀
All Strategies Are Good; If Managed Properly!
~Richard Nasr

Gold (XAU/USD) Cycle & Trend OutlookXAU/USD Update
On the low time frame, Gold is testing the 3,776 resistance zone after a strong rally.
Key levels:
3,776 → local resistance. A breakout and hold above this level would confirm continuation toward higher targets (3,800+).
3,762 – 3,657 → key support range. Holding this zone keeps the main uptrend intact.
Upside scenario: If price breaks and confirms above 3,776, bullish momentum continues, extending the rally.
Downside risk: Failure to hold 3,762 could trigger a pullback toward 3,657. A deeper breakdown below 3,657 would shift momentum bearish, targeting 3,314.
Cycle support: 3,314 is the major cycle trend level that Gold must protect to maintain its broader bullish structure.
📌 Summary
Above 3,776 → bullish continuation with potential new highs.
Hold above 3,762 – 3,657 → main uptrend remains safe.
Below 3,657 → correction risk toward 3,314 cycle level.

US30 Update On the low time frame, US30 is consolidating aroundUS30 Update
On the low time frame, US30 is consolidating around 46,351 – 46,398 after testing the breakout zone.
Key levels:
46,398 – 46,351 → short-term decision zone. A breakout above this area could confirm bullish continuation toward 47,170.
46,177 – 45,796 → support zone for the main uptrend. As long as price holds above this, the bullish cycle remains intact.
Upside scenario: If price reclaims and holds above 46,398, momentum strengthens for another push higher, with 47,170 as the next major resistance.
Downside risk: If price fails to hold above 46,177, deeper correction could follow, with 45,796 as first support.
Cycle level: 41,097 is the cycle start and a critical must-hold area for the long-term bullish structure.
📌 Summary
Above 46,398 → bullish continuation toward 47,170.
Hold above 46,177 – 45,796 → main uptrend safe.
Break below 45,796 → correction risk, broader weakness possible.
41,097 → cycle start and major long-term support.

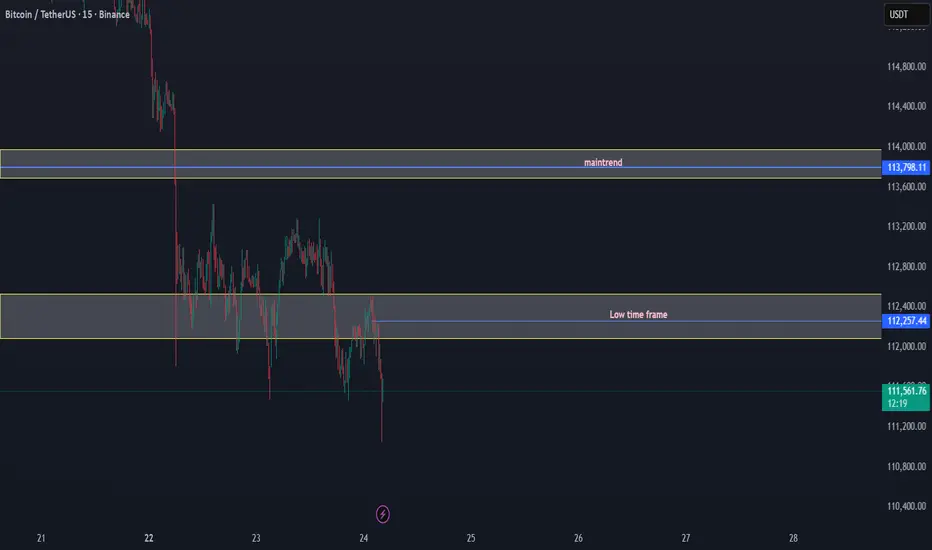
BTC/USDT Breakdown: Loss of Key Levels Confirms Bearish Structur📉 BTC/USDT Market Update
Bitcoin has broken down key structural levels, confirming a bearish outlook in the short to mid-term.
✅ Low Time Frame Support Lost: The $112,083 – $112,531 demand zone has failed to hold, indicating that buyers are losing control on lower time frames.
✅ Main Trend Zone Rejected: The $113,798 – $114,000 supply area acted as strong resistance, and BTC was unable to reclaim this key trend level.
✅ Momentum: Current price action shows continuation to the downside, with sellers stepping in aggressively after repeated failed attempts to sustain higher levels.
Bias: Bearish
As long as BTC trades below $113,800, the market structure favors sellers. Further downside pressure may target the $111,000 – $110,800 range in the near term.
⚠️ Key Levels to Watch:
Resistance: $113,800 – $114,000 (Main trend rejection zone)
Support: $111,000 – $110,800 (Next liquidity pool)
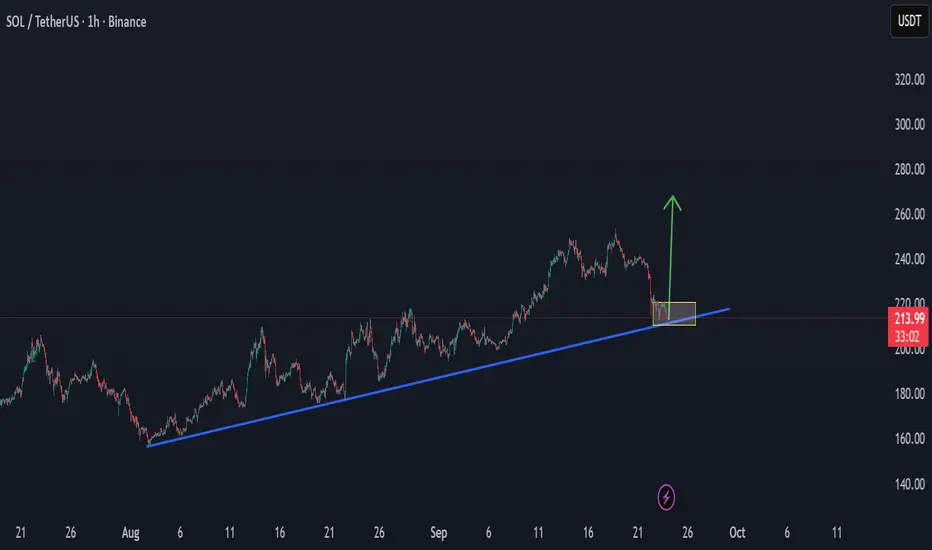
SOLANA can hold the cycle trend to up $250Solana is now at an important level of trend, and can hold in the coming time the cycle key level for a new power trend increase to up $250 in the coming time.
On the low time frame $220 can be the next target, when BTC has a stability trend or an increase trend.
UDS - Correction Inside an Uptrend: Eyes on 1.45–1.35UDS remains overall bullish on the 4H , riding a rising channel. After the impulse, price is drifting in a falling channel and inching toward the lower blue trendline.
The 1.45–1.35 area is key 🔑. It lines up with channel support and a prior structure base—clean confluence for buyers to step in. As long as it holds, I’ll look for trend-following longs toward 1.80 first, then 2.00–2.20 on momentum 🚀.
If 1.35 breaks and holds, I’ll step aside and reassess a deeper pullback toward 1.25 before looking for fresh confirmation ⏳.
What’s your move here => buy the dip at confluence or wait for a break of the red channel before joining? 🤔
⚠️ Disclaimer: This is not financial advice. Always do your own research and manage risk properly.
📚 Stick to your trading plan regarding entries, risk, and management.
Good luck! 🍀
All Strategies Are Good; If Managed Properly!
~Richard Nasr

NZDCAD: Weak Bearish SignalThis pair is interesting, but must be approached with caution.
Daily Timeframe:
Price crosses below HTL, but the overall daily price action is quite chaotic so should proceed with caution
H1 Timeframe:
Price fails to make a new higher high on the intraday timeframe, which is a good sign that this uptrend is weakening
There's also greater confluence with the overall downtrend as price crosses below ATL
Another indication of downtrend is price below EMA20 and EMA20 is pushing below EMA60

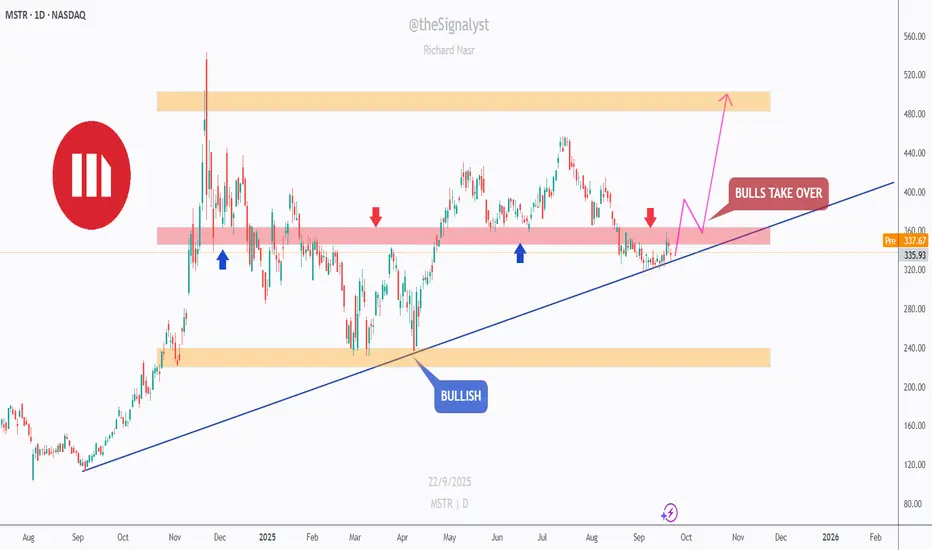
MSTR - Trendline Support vs. Supply Cap!MSTR has been overall bullish on the daily, respecting a rising trendline since last year. Price is coiling right beneath the 330–350 supply band after multiple rejections.
This area is key 🔑. It overlaps prior supply and the rising trendline—clean confluence. If bulls defend the trendline and we see a clean daily close above 350, momentum could extend toward 400 first, then 470–520 inside the broader range 🚀.
If the trendline gives way, I’ll look for a deeper dip toward 260–240 demand before bulls try again. Until then, structure favors the upside while the line holds.
What’s your plan => buy strength above 350 or wait for a retest on the trendline first? 🤔
⚠️ Disclaimer: This is not financial advice. Always do your own research and manage risk properly.
📚 Stick to your trading plan regarding entries, risk, and management.
Good luck! 🍀
All Strategies Are Good; If Managed Properly!
~Richard Nasr
GBPNZD: Trend ContinuationMomentum is picking again on the GBPNZD pair. Here are my observations on the daily and H1 timeframes.
Daily Timeframe:
HTL marks a resistance turned support
Price is also exiting the EMA areas, which is an indication of momentum
H1 Timeframe:
Price shows momentum as it crossed above the DTL
Price shows confluence with higher timeframe trend as it holds above EMA20
Uptrend is signaled by EMA20 remaining above EMA60

AUDCHF: Weak TrendMomentum is beginning to pick up on the AUDCHF pair. This is based on the EMA behavior along with price's behavior around the ATLs plotted. Here are my observations across two key timeframes.
Daily Timeframe:
Price crosses below ATL > first indication of momentum picking up
EMA20 is beginning to move away from EMA60 > second indication of momentum
H1 Timeframe:
EMA20 diverges away from EMA60 > indication of momentum
Price crosses below intraday HTL > confluence with overall downtrend if there isn't a liquidity trap

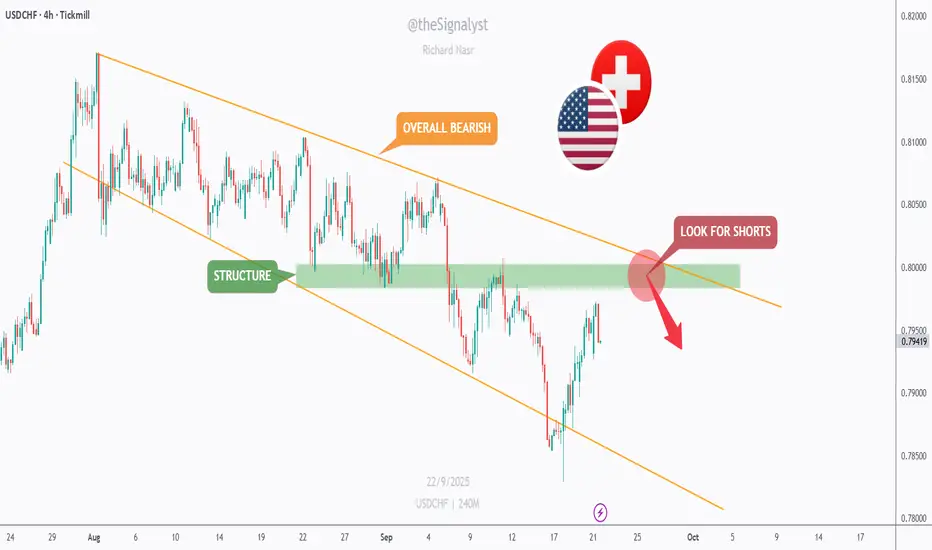
USDCHF — Rally Into Structure, Short the Retest?USDCHF has been overall bearish on the 4H, sliding inside a falling channel. After a bounce, price is rotating back into the 0.798–0.802 structure zone, right at the channel’s upper bound.
This confluence is key 🔑. If sellers react here, I’ll look for rejection shorts toward 0.790 first, then 0.785–0.780 near the channel floor. A clean 4H close and hold above 0.802 would invalidate the idea and expose 0.806–0.810 next ⏳.
What’s your plan => fade the rally at supply, or wait for confirmation before jumping in? 🤔
⚠️ Disclaimer: This is not financial advice. Always do your own research and manage risk properly.
📚 Stick to your trading plan regarding entries, risk, and management.
Good luck! 🍀
All Strategies Are Good; If Managed Properly!
~Richard Nasr
EURAUD: Counter-Trend TradeNot my conventional signal as this one is looking to trade in the opposite of the trend.
Daily Timeframe:
EMA20 is barely below EMA60 > downside momentum might pick up
Price is barely crossing below EMA20 > another indication of downside momentum
Price crossed below ATL, pulled back, and now seems to be continuing lower
H1 Timeframe:
Price crosses below ATL > first indication of uptrend failing to continue
Note that EMA20 is above EMA60 still > there is a risk that this will trap sellers

GBP/USD - 1H Forecast - YoYo Trade Setups🇬🇧🇺🇸 GBP/USD – 1H Breakdown
Cable’s been wildin’ 🤯 — we smashed into that daily imbalance, tapped supply, and now price is bleeding lower straight into demand.
🔑 What’s Cooking:
Price tagged the Daily IMB + 71% retrace, then dumped.
Now chilling near demand around 1.345 – 1.348 (possible snack stop 🍫).
If bulls defend here → we get a bounce back toward 1.357 – 1.360 supply for a cheeky liquidity grab 🏹.
From there? Expect a heavy distribution dump back toward 1.3350 lows 📉
🎯 Playbook:
Demand bounce → push into 1H / 4H supply.
Reject at supply → sell-off continuation.
🔍 Outlook
Short-term: Relief bounce incoming 🕺
Mid-term: Looking heavy, bears wanna drag this lower.
Bias : Bounce first → then bigger dump 🚀🔪

AUD/USD - Forecast (To fall further)🇦🇺🇺🇸 AUD/USD – 8H Breakdown
AUD/USD just wrapped up that juicy Wave 3 run and topped near 0.6780. Now we’re cooling off with a corrective pullback — perfect spot to hunt buys 👀
🎯 Buy Zones
Buy Zone 1: 0.6520 – 0.6530 → first bounce area ⚡
Buy Zone 2 (Preferred): 0.6460 – 0.6480 → 71% retrace + wedge support 🏹
📈 Playbook
Let price dip into demand (ideally Buy Zone 2).
Load up → ride it back toward 0.6700.
If bulls flex, we sweep those 0.6780 highs for liquidity. 🚀
🔍 Outlook
Short-term: Expect deeper retrace into demand.
Mid-term: Bulls looking for another leg higher.
Bias : Pullback → Buy continuation 🔥

USD/JPY - Fake Breakout. Is price Distributing💹 USD/JPY – 4H Forecast
Weekly Structure:
Price is still holding strong above demand, with 151.0 acting as the big liquidity magnet.
Daily Structure:
We’ve been stuck in a wide consolidation range between 146.0 support and 150.9 resistance. Market keeps faking both sides, but bulls are slowly regaining control.
4H Structure:
Recent fake breakout/manipulation flushed stops before shifting bullish.
Imbalances (Daily + Weekly) got filled on the push up.
Price is now respecting the bullish structure, eyeing a move higher.
Buy Zone 1 (Preferred): 146.7 – 147.0
Buy Zone 2 (Needs confirmation): 146.1 – 146.2
Upside liquidity target sits around 150.9 – 151.0 BSL.
🔍 Outlook
Short-term: Pullback into demand zones.
Mid-term: Bullish continuation → eyes on 150.9 – 151.0.
Bias : Short-term retrace → Mid-term bullish.
