another BuySide QuickScalp #GBPJPY 📌 Market Insight: {#GBPJPY }
⚠️ Risk Assessment: {High}
🚀 Approach:
Lets see , does it give us another QuickScalp or not ... its More Riskier than Yesterday
#Ash_TheTrader #Forex #GBPJPY #MarketAnalysis #TradingSetup #RiskManagement #GOLD #Scalper #NQ #EURUSD
Trend

GBPUSD: Testing Daily HTLKey Observations
- On the D1 TF, price is in a downtrend; however, it's currently testing a key HTL
- If price is able to hold below this level, this is a good indication of keeping my bearish bias
- However, the bullish daily bars is not a great sign for downside strength
- ATL had to be drawn multiple times, which is signaling a weaker price action and a point of concern for the downtrend strength

Congress Set to End Shutdown | SPX500 Holds Strong Above 6877SPX500 | Overview
U.S. Congress Poised to Get Back to Work
The U.S. government is on the verge of reopening, potentially restoring pay to federal workers and reviving key economic data releases that have been halted for weeks — leaving the Federal Reserve operating with limited visibility.
Renewed optimism over a resolution in Washington has boosted investor sentiment, supporting further upside in U.S. equities.
Technically:
The SPX500 has pushed higher and is now stabilized above the pivot level at 6877, indicating continuation of the bullish trend toward 6918 and 6941, with potential to reach new all-time highs (ATH) if momentum persists.
However, if the price closes a 1H candle below 6866, it would signal short-term weakness, leading to a bearish correction toward 6844 and 6814.
Pivot Line: 6877
Resistance: 6918 · 6941 · 6991
Support: 6845 · 6814 · 6797

GBPCAD: Price Cross Below H1 ATLKey Observations
On the D1 TF, price is showing a weak bearish trend
EMA20 barely crossed below EMA60, however, price is showing more inside bars than what I'd like to see
On the H1 TF, price crossed below the ATL
Price is also accelerating away from the EMA band

Exxon Mobil Exxon Mobil is going up strong to the all time high,
Expecting strong reaction from that area,
Volume is going down in the last 2 3 weeks witch means bulls are getting weaker,
If we look into the valuation ratios , the company is getting overvalued,
If we look at the 10 Ma on weekly we can see that price is getting away from MA fast witch indicates that the company is getting overvalued quickly,
It will be interesting to see how price will react from that area when it goes up, But overall trend is bullish,

ETH - Still Bearish BUT...📉ETH has been trading inside a falling red channel , keeping the short-term outlook bearish for now. As long as price remains within this structure, sellers continue to dominate.
⚔️However, ETH is now approaching a massive confluence zone between $2850 and $3000, which aligns with the lower bound of the channel, an area that has acted as a powerful support in the past.
🏹From here, I’ll be looking for potential long setups, anticipating a rebound toward the $3850–$4000 resistance area. But for the bulls to fully take over long-term, a confirmed break above $4000 is essential.
Could this be the last dip before Ethereum’s next explosive move? 👀
⚠️ Disclaimer: This is not financial advice. Always do your own research and manage risk properly.
📊All Strategies Are Good; If Managed Properly!
~Richard Nasr

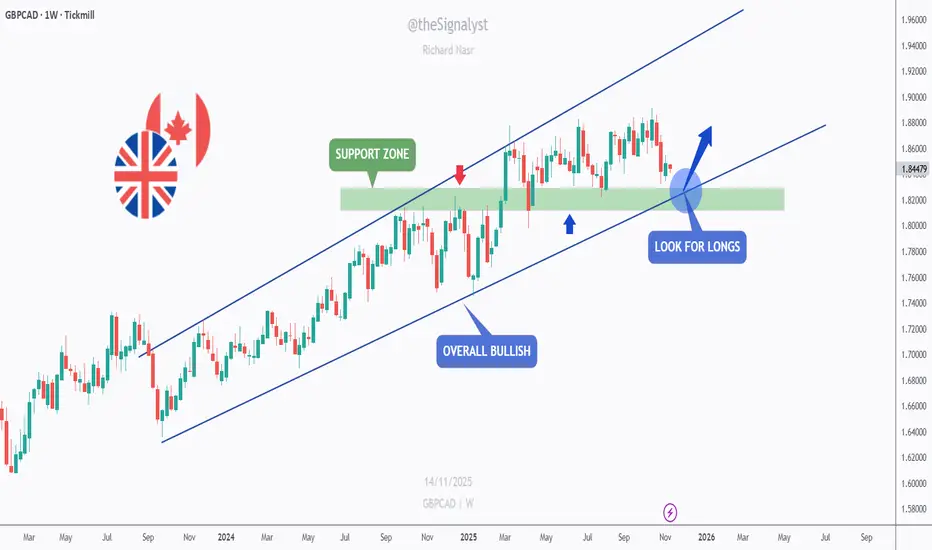
GBPCAD - Bulls Setting Up for a Comeback!📈 GBPCAD has been trading within a steady rising channel , maintaining a clear bullish structure for months. Recently, price retraced toward a strong confluence area where the green support zone aligns perfectly with the lower bound of the channel — a region that has repeatedly attracted buyers in the past.
⚔️As long as price holds above this zone , the pair remains overall bullish, and I’ll be looking for long setups in anticipation of another push toward the upper boundary of the channel.
🏹If the bulls take control from this intersection , we could witness the next impulsive move continuing the long-term uptrend.
⚠️ Disclaimer: This is not financial advice. Always do your own research and manage risk properly.
📊All Strategies Are Good; If Managed Properly!
~Richard Nasr
USDCAD - Bulls Preparing to Reload!📈USDCAD has been moving within a clear ascending channel, maintaining a well-defined bullish structure over the past months.
After rejecting the upper bound, price is now pulling back toward a key confluence area, the intersection of the orange support zone and the lower trendline of the channel.
🏹This zone is crucial, as it has acted as a strong demand area in the past, where buyers consistently regained control. From here, I’ll be looking for long setups, aiming for a continuation toward the upper bound of the channel once more.
⚔️As long as the price holds above the orange zone, the overall bullish momentum remains intact.
⚠️ Disclaimer: This is not financial advice. Always do your own research and manage risk properly.
📊All Strategies Are Good; If Managed Properly!
~Richard Nasr

Will Bitcoin goes for 14500? WeeklyThis is the last analysis's weekly time frame chart.
Everything is clarified in the chart you can see upgoing and downgoing cycles after every bitcoin halving.
RSI had a downward breakout the red RSI trend line named T1 and pull backed to it in the weekly timeframe where you can see a little red rectangle and arrow there. The continuation of the RSI path is probably like the blue line drawn named R1.
About the BTC price, I am expecting the price to reach 14500 - 19000 dollars until Dec 2022. of course, it can reach that target a few months earlier or late.
Note that before Halving 2024 bitcoin will not have ATH. It means before Apr 2024 bitcoins price will be under the 69000 and even maybe 50000 dollars. After that time the price will go to 120000 dollars.
Do not forget that the trend of the bitcoin and crypto market is still downward and bearish.
You can see my idea about this analysis in a monthly time frame in another published idea on my profile page.

CHFJPY: Trend Continuation on Market OpenKey Observations
Pair is in a very structural uptrend according to the D1 TF
Price crossed and closed above DTL last Friday on the H1 TF
Current expectation is for price to continue upside momentum; however, reduced position size due to lower volatility during market open

Mastering Market Momentum with ONE IndicatorLearn how to use the 21 EMA like a pro!
This video walks you through the exact setup I use — plus a unique twist that helps identify momentum shifts and reversals earlier than most traders spot them.
Whether you’re day trading or swing trading, this indicator can become your foundation for better trade timing.
Like and Follow For more Tutorials and Analysis Friends!

DCR - The Calm Before the Next Impulse!📈DCR has recently surged in a parabolic manner, posting one of its strongest rallies in months. However, after such a vertical move, a correction phase was inevitable, and that’s exactly what we’re seeing now.
📉At the moment, price is retracing within a clear descending channel, approaching a massive confluence zone marked by the demand area and the lower red trendline. This intersection represents a key area of interest to look for potential long setups.
⚔️If buyers manage to defend this zone, DCR could soon resume its next impulsive leg upward, potentially breaking out of the correction structure and extending the broader bullish momentum.
⚠️ Disclaimer: This is not financial advice. Always do your own research and manage risk properly.
📊All Strategies Are Good; If Managed Properly!
~Richard Nasr

USD/CAD - Sell off ready🧭 Bias: Bearish correction incoming
After a strong bullish leg into higher-timeframe supply, USD/CAD looks primed for a deeper pullback before any continuation move.
🕰 Weekly Outlook
Context : Price just tapped into a weekly supply zone sitting inside the 1.41–1.42 range — exactly where previous sell pressure originated.
Structure : Market has completed a corrective move into the 71% retracement of the prior swing range (a key reversal zone).
Expectation : A rejection from this area could kick off a weekly distribution phase, with potential downside targeting 1.33–1.32 demand.
Key Level: 1.4140 – watch this as the “make or break” ceiling for the bears to defend.
⏱ 8H Technical Breakdown
Trend : Price broke short-term structure (BOS) after sweeping external buy-side liquidity — a classic liquidity grab setup.
Zones of Interest:
🔵 8H Supply: 1.4050–1.4100 — the rejection point confirming short-term bearish orderflow.
🟢 Demand Zone: 1.3920–1.3970 — potential retracement area before further drop.
Moving Average: Price rejected the 200 EMA, reinforcing bearish bias.
Projection: Expect a corrective retest into the 1.40 region before continuation down toward 1.38–1.37 (next demand zone).
⚖️ Risk Management
Maintain stops above 1.4150 (weekly high).
Consider scaling partials near 1.39 and 1.36.
A clean close above 1.42 invalidates the bearish setup.
🧩 Summary
USD/CAD just hit a big liquidity pocket up top 🧱 — signs point to exhaustion. If the 1.41 zone holds, we could be looking at a multi-week bearish correction toward 1.33. For now, watch for a retest into supply before taking the short ride down. 🚀⬇️

Potential BUY Trade Idea GOLD (xauusd) 15mins TFLooking forward to go Long as a trend reversal trade setup.
Counter Trade- Highly Risk but tradable as long as we get the green light
Will update you soon when trade executed or becomes invalid.

EUR/USD - Bearish Correction 🧠 Bias: Bearish continuation after correction
After a strong impulsive drop, EUR/USD is now pausing to retrace and correct before the next leg lower. Price is showing all the classic correction signs — structure shift, smaller candles, reduced volume, and internal pullbacks.
📉 Dai ly Breakdown
The pair completed a 5-wave bearish impulse (ending around 1.1500).
Current movement is wave (iv) correction — a retracement leg after that drop.
We’re reacting to a minor 4H demand zone, but overall, structure remains bearish under the descending trendline.
There’s a liquidity void just above (orange zone), which price might fill before continuing downward.
The next major buy zone sits around 1.1350–1.1400, aligning with daily + weekly demand and 200 EMA confluence.
⏱ Weekly Context
Weekly chart shows a clean rejection from 1.1800 weekly supply (BSL sweep → BOS down).
As long as we trade below that 1.1600–1.1650 weekly zone, bias remains bearish.
The long-term target aligns with 1.0700, the next untouched weekly demand area.
🎯 Expectations
Short-term:
Correction toward 1.1600 – 1.1650 possible (liquidity fill + premium zone).
Medium-term:
From that area, expect a continuation leg down toward 1.1350 (daily demand) or even 1.0700 (weekly demand).
⚙️ Risk Management
Avoid early longs — the correction could still push lower to retest previous lows.
Look for a premium retracement entry (71% fib + OB confluence) for the next swing short.
Stops above 1.1700, targeting 1.1350 then 1.0700.
🧩 Summary
EUR/USD is cooling off after a solid bearish wave — a textbook correctional stage before the next impulse down. Expect a slow climb into premium pricing before the bears reload for another leg south.

Gold 8H Forecast- Price will continue to sell off🔥 GOLD (XAU/USD) – 8H Forecast 🔥
Alright fam, let’s break this one down nice and clean 👇
🧠 Bias : Short-term bearish → Long-term bullish
Gold’s cooking a classic pullback setup right now — we’re in a mid-range squeeze after that massive rally and rejection from the external BSL (Buy-Side Liquidity) at the top.
📉 Technical Breakdown
Price broke structure at the top and started forming lower highs under that descending trendline.
We’ve already taken external SSL (Sell-Side Liquidity) below recent lows, showing signs of a cleanup phase.
The current compression looks like a bearish continuation pattern that could push into the 8H demand zone around $3,750 – $3,800.
That zone also aligns perfectly with the 200 EMA, making it a juicy liquidity magnet before any major reversal.
🎯 Potential Play
Short-term:
Watch for a breakdown below current structure → ride it down to that $3,750 demand area.
Ideal short confirmation = rejection at the $3,950 – $4,000 supply zone.
Medium to Long-term:
Once price taps that HTF demand, expect bulls to step back in hard.
A clean rebound from there could launch us toward $4,300 – $4,500, following the red arrow projection. 🚀
⚙️ Risk Management
Avoid early longs until the sweep and reaction from demand confirm a shift.
Keep stops tight above the 8H swing high if shorting.
Wait for structure + volume confirmation before flipping bias long.
🧩 Summary
Gold’s chilling mid-range after a big rally — expect one more dip into demand before the next bullish leg ignites. HTF structure remains intact, but we’re not done with the correction yet. Patience pays here.

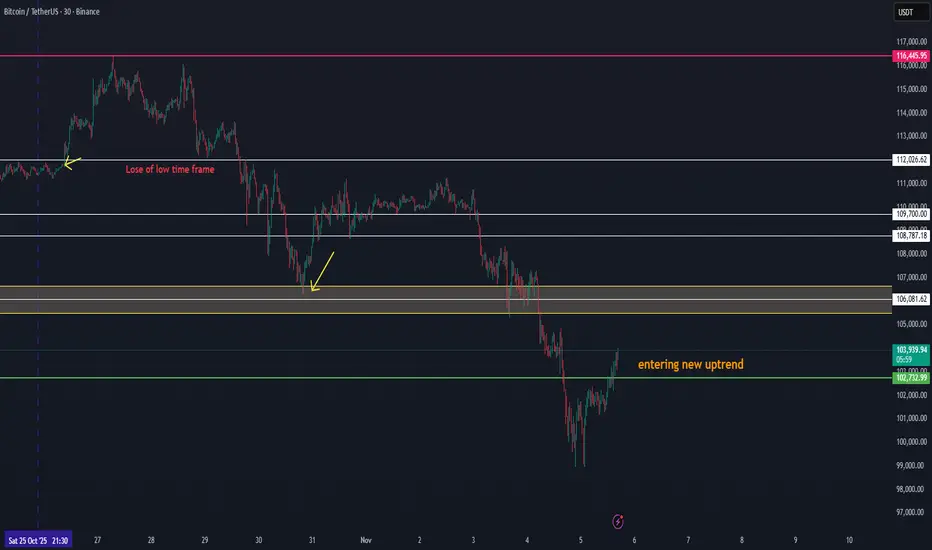
BTC Showing Early Signs of a New Uptrend Volume FormationBTC Showing Early Signs of a New Uptrend Volume Formation
Bitcoin is beginning to show new uptrend volume structure after a long corrective phase. This current movement around the 103K zone could be the first confirmation of renewed bullish momentum forming after the 110K area breakdown.
Here’s the technical context:
🔹 Structure: BTC has established a short-term higher low and is now attempting to build a new rising channel.
🔹 Volume Confirmation: The growing buy volume around 103K suggests early accumulation — this could mark the start of a new volume phase.
🔹 Targets: A sustained move above 103.8K–104.2K may confirm continuation toward 105K+, which would act as the first key resistance and validation of renewed market strength.
💡 Outlook:
If BTC maintains its current momentum and volume continues to rise, this could be the first stage of a new uptrend, with 105K+ as the initial upside target and potential re-entry toward the broader 110K recovery structure later.
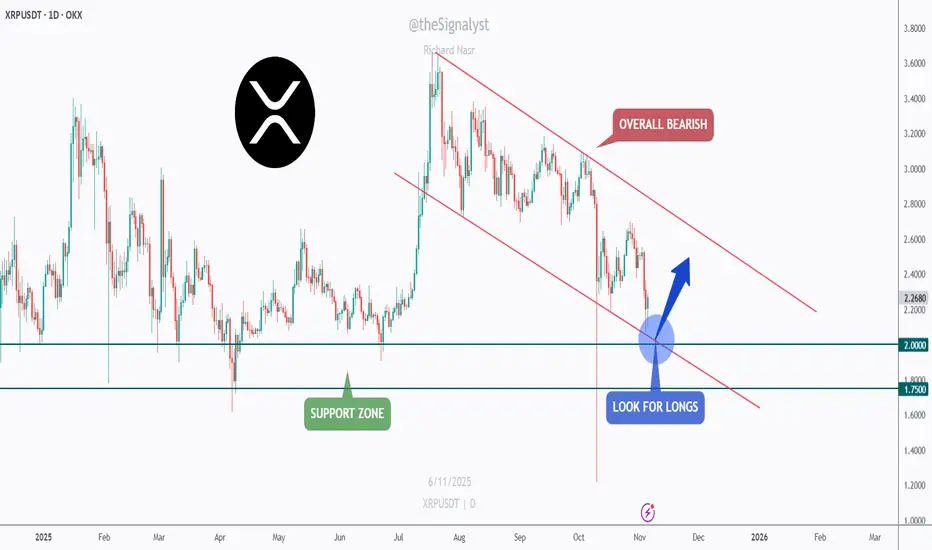
XRP - Watching the Confluence Zone for a Bullish Rebound!📉XRP has been in a clear bearish channel for months , forming consistent lower highs and lower lows.
However, the current structure is approaching a critical confluence zone, where the lower bound of the red channel meets the major green support area between $1.75 and $2.00.
⚔️As long as this intersection holds, I’ll be looking for potential long opportunities, anticipating a short-term bullish correction toward the upper boundary of the channel.
This setup offers a clean risk-to-reward opportunity if the bulls manage to defend the zone and regain momentum.
If the support gives way, further downside could follow, but for now, this area remains a key decision point for XRP’s next move.
⚠️ Disclaimer: This is not financial advice. Always do your own research and manage risk properly.
📊All Strategies Are Good; If Managed Properly!
~Richard Nasr
GBPUSD within Bearish StructureHi Traders!
With price failing to swing higher I'm still seeing it's within bearish structure. The 1.35000 area looks like a strong resistance/supply zone. If price fails to break and close above it, that reinforces my bearish bias.
As of now, the current bounce looks corrective- possibly a retracement toward the 1.3500 zone before sellers step in again.
If price rejects near 1.35000 and continues to break below, then the next level I'd be considering would be 1.30000.
In addition, DXY is sitting at a higher low zone on a higher TF. It hasn't broken its longer-term uptrend yet. The price action looks like it's attempting a base/reversal. If it holds within 98.000-98.500 and starts pushing up, that could align with GBPUSD weakness.
*DISCLAIMER: I am not a financial advisor. The ideas and trades I take on my page are for educational and entertainment purposes only. I'm just showing you guys how I trade. Remember, trading of any kind involves risk. Your investments are solely your responsibility and not mine.*

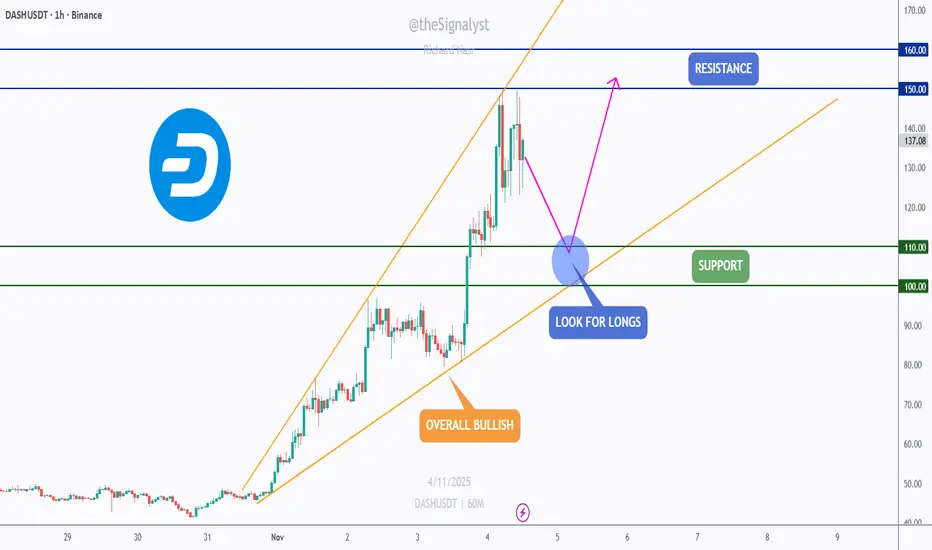
DASH - Top Performer Setting Up for the Next Leg!🏹DASH has been one of the top-performing altcoins this month, showing strong momentum and clear leadership among mid-cap assets.
💣After an explosive rally, price is now pulling back within a well-structured rising wedge, a healthy correction within an overall bullish trend.
As DASH approaches the intersection of support and the lower bound of the wedge, this confluence zone will be key to watch.
I’ll be looking for trend-following long opportunities from that area, targeting a continuation toward the $150–$160 resistance zone.
⚔️As long as the $100 support holds, the bulls remain firmly in control, and this dip could be the perfect opportunity to join the next wave up.
⚠️ Disclaimer: This is not financial advice. Always do your own research and manage risk properly.
📊All Strategies Are Good; If Managed Properly!
~Richard Nasr
AFTER THE BREAKDOWN 105K IS THE KEY LEVEL FOR RECOVERYWe have seen an unexpected breakdown in BTC, even despite the positive news about the China deal. BTC continued to decline further, although the data has generally been pointing in the right direction.
At the moment of writing, BTC is still in a downtrend. However, the $105K level could be a key point that triggers a potential recovery, depending on how the upcoming data unfolds.
We will continue to monitor whether BTC can enter the $105K zone in the coming time frames.

GBP/JPY Bullish Breakout SetupGBP/JPY is forming a bullish structure above the trend line after a break of structure (BoS). Price is consolidating and showing potential for an upward move toward the marked target zones near 203.00.

CADJPY - The Trio Retest Setup!📈CADJPY has been on a strong bullish run lately, but price is now approaching a critical confluence zone, the perfect Trio Retest Setup.
The red circle highlights the intersection of two upper trendlines (the rising channel and the short-term wedge) together with a major horizontal resistance at 111.00.
⚔️This trio intersection creates a powerful technical barrier, suggesting that the pair is overbought in the short term. From here, I’ll be looking for signs of exhaustion or reversal patterns to catch the next corrective leg down.
🔎A potential retracement could send CADJPY back toward the 106.00–105.00 support zone, which also aligns with the lower boundary of the main ascending channel.
Until the trio zone is broken decisively to the upside, the bears might step in to cool off the momentum.
⚠️ Disclaimer: This is not financial advice. Always do your own research and manage risk properly.
📊All Strategies Are Good; If Managed Properly!
~Richard Nasr
