Bitcoin Faces Rejection — Bearish Continuation SetupKey Observations:
Price Action & Rejection Zone:
The highlighted green area represents a short-term supply zone, where previous buying momentum weakened and sellers re-entered the market. Price briefly retested this zone and faced rejection, confirming bearish intent.
Stop Loss Placement:
The red zone above, around $114,300, marks the stop-loss level, strategically set just above the rejection wick to protect against a false breakout.
Bearish Confirmation:
A clear lower high structure has formed, signaling weakening bullish momentum and potential continuation of the downward move.
Target Zone:
The blue dotted line near $111,070 identifies the target level, aligning with a prior support zone and liquidity area — a likely destination for bearish momentum to complete its next leg.
Projected Path:
The curved black and white arrows indicate the expected retracement and continuation pattern, showing price potentially retesting the supply zone before dropping toward the target.
Trendanalyse

BTCUSD 1D chart review• Bitcoin remains in a broad uptrend, but is currently seeing a correction following a strong breakout from around $109,000 → $124,000.
• The daily candle shows a large decline from the upper level, which may suggest strong resistance and profit-taking.
⸻
📈 Key technical levels
🟩 Resistances:
• USD 117,828 – the nearest strong resistance, marked by previous local highs.
• USD 120,000–124,000 – last peak zone and potential sales area.
🟥 Support:
• USD 113,600 – first short-term support (price is currently testing it).
• USD 108,968 – strong support aligned with EMA 50 and yellow trend line.
• USD 104,366 – another strong support, consistent with the previous low and EMA 200 level.
⸻
🧭 Trend and moving averages
• EMA 50 (yellow) is trending upwards - the medium-term trend is still upwards.
• EMA 200 (blue) is also climbing - long-term trend maintained.
• Price above EMA 200, but above EMA 50 only slightly - the market is in the equilibrium zone (there may be a larger move in one direction).
⸻
📊 Technical indicators
🔹 MACD:
• The MACD line begins to approach the signal line from above → bearish crossover.
• The histogram with red bars confirms the slowdown in momentum.
➡️ Suggests that there may be a continuation of correction to lower support levels.
🔹RSI:
• RSI ~50, neutral but heading down.
• There is no oversold yet, but the momentum is waning - the market is losing buyer power.
➡️ If the RSI drops below 45, it will confirm downward pressure.
⸻
📉 Pricing scenarios
✅ Growth scenario (rebound)
• Price remains above USD 109,000 (EMA 50 + trendline).
• Breakout and closing of the daily candle above USD 117,800 → opens the way to USD 122-124,000.
• Condition: MACD must turn upwards and RSI >55.
⚠️ Downside scenario (correction)
• If price breaks above $109,000, we could see a test of $104,000-105,000 (EMA 200).
• Loss of USD 104,000 → possible move towards USD 98,000–100,000 (previous consolidation zone).

The LINK/USDT will probably go lower📉 Trend and Structure
The price is currently trading within a descending channel (yellow lines), which has been in place since late August.
The price attempted to break out of the channel at the top around $23.40, but buyers lacked strength – it was rejected at resistance and fell back below the downtrend line.
Currently, the price is just below the upper edge of the channel and below the 50/200 EMA, confirming that the medium-term trend remains downward.
🔹 Key Technical Levels
Support:
$21.40 – local support, which is currently being tested.
$20.80 – strong support from previous price reactions.
$19.68 – lower boundary of the channel, a very important level for bulls.
Resistance:
$22.20–$22.70 – zone of the 50/200 EMA and previous rejections.
USD 23.40 – the last local high and the point of the false breakout.
USD 24.90 and USD 25.50 – key breakout levels from the channel, paving the way to USD 27–28.
⚙️ Technical Indicators
MACD:
The MACD line has crossed the upside signal → sell signal.
The histogram has turned slightly negative, indicating a loss of upward momentum.
RSI (14):
Currently around 51, with a slight downward slope.
Neutral, but with a strong upside – a drop to around 40 is possible before the bulls attempt a rebound.
🧭 Scenarios
🔻 Bearish Scenario (more likely)
If the price remains below $22 and the channel is not broken, a further decline to $20.80 is possible, or even a test of the lower band of the channel at $19.70.
Confirmation will be a close of the 4-hour candle below $21.40.
🔺 Bullish Scenario (less likely at this time)
If the bulls reclaim $22.70–$23.00 and close the 4-hour candle above it, a breakout from the channel could occur.
The targets will then be $23.40, $24.90, and $25.50, respectively.
Increased volume and confirmation on the MACD (bullish cross) are required.

BTC Short-Term 1H🔹 General Context
On the chart, we see that Bitcoin:
Has broken the local downtrend line (yellow line), suggesting an attempt to change the short-term trend.
It is currently consolidating just above the 50/200 EMA, which is a positive sign for bulls.
We also see a MACD crossover in the positive zone and an RSI rising, but not yet overloaded (around 52–60).
🔸 Key Technical Levels
Support:
122.460 USDT – strong local support, aligned with previous lows and the 200 EMA.
121.900 USDT – next support, also marked by the blue 200 EMA.
120.600 USDT – deeper support, recent significant low.
Resistance:
123,700 – 123,900 USDT – resistance zone where the price is currently stalling (there was a reaction after the trendline breakout).
124,700 USDT – next resistance level (local high).
125,700 USDT – strong resistance resulting from previous swing highs.
🔸 Technical Indicators
📈 EMA 50/200 (golden cross on 1 hour):
The 50 EMA is breaking below the 200 EMA – a classic bullish signal (Golden Cross).
Confirmation requires the price to stay above 122,800 USDT for several H1 candles.
📊 MACD:
The histogram has turned positive, the MACD line is breaking above the signal line – momentum is increasing.
There is no strong negative divergence yet, so the signal is clear.
💪 RSI:
Value ~52–60 – moderately bullish.
It is not overbought yet, so there is potential for further upward movement.
🔹 Scenarios
✅ Bullish Scenario:
Sustainability above 122,800 USDT.
A breakout and retest of the 123,700–123,900 USDT resistance could open the way to 124,700 USDT and then 125,700 USDT.
The MACD and RSI support this scenario.
❌ Bearish Scenario:
A reversal from the current level and a decline below 122,400 USDT.
A retest of 121,900 USDT and a possible deepening correction to 120,600 USDT is possible.

ETHUSDT 1D chart review📊 1. Main trend
• The chart shows a long -term movement in the inheritance trend channel in which the price is currently fighting for the mountain, but here you can see that the inferior canal limit is a strong resistance for the price.
⸻
🧠 2. Medium walking
• We see the cut SMA 50 and SMA 200 (so -called Golden Cross) - this is an upward signal in day interval.
• EMA 50 (green) is approaching the intersection of EMA 200 (red) - if the growth cross is confirmed, it may mean further growth time.
⸻
💹 3. Horizers of support and resistance
Support:
• 4,034 USDT - strong level, defended after the last inheritance.
• 4,252 USDT - short -term support (after breaking above trendline).
Resistance:
• 4 720 USDT - local resistance, previously rejected several times.
• 4,966 USDT - next strong resistance (local peak).
If ETH pierces 4 720 with a volume, the road opens towards 4,950-5,000 USDT.
⸻
⚙️ 4. Indicators
Macd:
• The histogram grows green → growth momentum.
• The MacD line cut the signal line from the bottom → buy signal.
RSI:
• RSI around 60, which indicates the advantage of bulls, but without buying out.
• If the RSI pierces 70, a short -term pullback may occur.

BTCUSD 1W chart review• Currently BTC is at ~ USD 123,000 (+1.97%).
• Strong support visible in the area of 113 400 USD and USD 106,800.
• The next resistance is USD 124,500, and the next important is USD 133,500.
2. Trend:
• You can see the growing trend line (orange), which supports increases.
• The weekly candle is green and quite strong - suggests that the demand persists.
3. Medium walking (SMA / EMA):
• SMA 50/200 shows the Golden Cross (EMA CROSS 50/200), which is a long -term bull signal.
• SMA (red) is below the price → pro-rectification signal.
4. RSI (Relative Strength Index):
• Currently approx. 60 → Neutral-BYCZECZE territory.
• Not bought yet (> 70), so there is space for further increases.
5. MacD / Histogram:
• The histogram begins to grow green - growth moment is growing.
• This confirms that the buyers are taking over the initiative.
⸻
📈 Scenarios:
1. Bull (greater likelihood at the moment)
• If BTC pierces and stays above USD 124,500, the goal may be USD 133,500.
• Breaking over 133K opens the road even to around 140k.
2. Bear
• If the price does not pierce 124.5k and reject the resistance, it may drop to $ 113,400.
• Punction below this zone will give a signal of declines up to USD 106,800.

LINKUSDT 12H1. Trend Structure
The price is in a descending channel (marked in orange) – the upper line acts as resistance, the lower line as support.
Currently, the price has rebounded from the lower boundary and is approaching the middle resistance levels.
2. Key Levels
Support:
21.73 USDT (the closest local support – already broken upwards, now being retested).
20.17 USDT (stronger support that previously halted the decline).
18.10 USDT (bottom of the channel – the main defense for the bulls).
Resistance:
23.22 USDT (local resistance, the price is very close to this level).
24.14 USDT (important horizontal resistance).
25.54 USDT (key level, a breakout of which could negate the descending channel).
3. Indicators (Stoch RSI)
The Stoch RSI is in the overbought zone (>80).
This suggests that upward momentum is slowly fading and a correction or consolidation near resistance levels (23–24 USDT) is possible.
4. Scenarios
Bullish:
If the price breaks and holds above 23.22 USDT, the next target will be 24.14 USDT, followed by 25.54 USDT (the upper boundary of the channel).
A break above 25.54 USDT could signal the end of the downward channel and a transition to a sideways/upward trend.
Bearish:
If the price rejects the 23.22 level and the Stoch RSI begins to decline, we could return to 21.73 USDT.
Losing this level will reopen the road towards 20.17 USDT and even test the lower limit of the channel (around 18-19 USDT).

BNB/USDT 4h chart review1. Trend and structure
• The price struck the relegation (orange) line, which is a positive signal.
• Currently, the course oscillates around 1007 USDT after reflection from holes ~ 930.
2. Key levels
• Support: 995, 971, 930.
• Resistance: 1026, 1051, 1084.
3. MacD
• The histogram grows, but begins to slightly weaken.
• MacD line still above the signal → slightly bullish signal, but with braking signs.
4. RSI (4H)
• RSI around 55–60 → neutral/bullish, not yet burdened.
5. Simple interpretation
• As long as the course lasts above 995, the upward scenario is possible.
• Breaking above 1026 will open the road to 1051 and 1084.
• decrease below 995 → Risk of retests 971, and later 930.

Will BTC come out of the downward channel?• In the chart you can see how we are close to the upper limit of the downward channel. This is a key signal - if the breaking persists, it may mean a change in the trend.
• We have several support levels from below (marked with red lines):
• 112,238 USD
• USD 108,981
• USD 107,040
• From the top you can see resistance (green lines):
• 115,266 USD (local resistance - the course is just approaching)
• 117 395 USD
• 119 404 USD
⸻
🔹 Medium walking (SMA/EMA)
• You can see EMA Cross 50/200 (yellow label) - a classic signal "Golden Cross" / "Death Cross". It seems that the average is raised recently, which the market often interprets as a signal of a potential change of trend.
• SMA #1 and #2 (red and green lines) - the course tries to stay above the average, which is positive.
• SMA #5 (blue line below) shows long -term support ~ 107k USD.
⸻
🔹 MacD (below)
• The histogram shows reversal - red posts decrease, and the lines (blue and orange) are approaching each other → possible buy signal.
• If the signal line is intersected up, this will be confirmed by the growth moment.
⸻
🔹 RSI (Relative Strength Index)
• RSI is currently around 40-50 →, i.e. a neutral level (neither purchase nor selling).
• It slightly reflects from below, which suggests that there may still be space for further growth before we enter the purchase zone (> 70).
⸻
📌 Summary
• Short -term (1-7 days): it looks like BTC is trying to stand out from the downward trend. If it pierces 115,266 USD and persists above, subsequent goals are 117 395 USD and 119 404 USD.
• Medium -term (weeks): support levels 112K - 108K are key. A decrease below 107k would negate a bull scenario.
• Technical signals: MacD and RSI give the first signs of reflection. The course balances on the border of breaking the trend.
👉 It looks at the beginning of a potential growth movement, but it will be crucial whether BTC will stay above 115K.

ETHUSDT 1D chart Review1. Trendline (orange) - was clearly pierced down → it is a signal of weakening the growth moment.
2. Horizers of support / resistance:
• Resistance: $ 4,604 (strong), above $ 4,960.
• Support: $ 4 150 (currently tested), next $ 3,958 and $ 3,696.
3. Price - currently ~ 4 169 $, i.e. right with the support of $ 4 150.
4. Candles - a strong inheritance candle after piercing the trend → weakness signal.
5. STOCHASTIC RSI - in the sales zone (<20), which may suggest the possibility of short -term reflection.
⸻
🔹 Application:
• Short date: possible reflection from $ 4 150 thanks to the sale (technical bounce).
• average date: If level $ 4 150 breaks and the candle closes below → the road opens to $ 3,958 and even $ 3,696.
• Only a return above $ 4 272 and a retest trendline from below would give a signal of buyers.
⸻
👉 To sum up: The market is in the critical zone - support $ 4 150 decides.
• Bull: keeping the defense of this level + reflection from the sale.
• Bear: loss $ 4 150 = greater correction in the direction of $ 3 950–3 700.

BTC/USD 12H local downtrend📊 Chart structure
• BTC price: ~ 112,765 USD (decrease -2.18%).
• Trend: after prior reflection from the holes (~ 107k), BTC is approaching the resistance zone.
• Inheritance channel: The marked yellow line suggests that the price is still in a medium -term inheritance trend
⸻
🔑 levels of support and resistance
• Support:
• USD 111,461 (close to support - if it falls, a quick test below).
• USD 107,346 (key support - its loss opens the road towards 103-105k).
• resistance:
• USD 118.004 (important level of resistance).
• USD 124.619 (strong resistance - local peaks).
⸻
📈 indicators
• SMA (movable average):
• Red (SMA #1) - short -term, currently acts as dynamic resistance.
• Green (SMA #2) - average, the price fights around it.
• Blue (SMA #5) - long -term, still above the price, which means inheritance pressure.
• MacD:
• You can see a slight weakening of the growth moment. If there is no strong demand, it is possible to cut the signal down (inheritance signal).
• RSI (12H):
• fell from the level close to buying (~ 70) to ~ 45–50.
• Neutral, but with a slight tendency to further weakness.
⸻
🧭 Scenarios
1. Bullish:
• Support defense 111,400 USD → Reflection up.
• If $ 118,000 stands out, the next target is USD 124,600.
• Breaking over 125K will negate the inheritance channel and can open the road to 130K+.
2. Bearish:
• Support loss 111,400 USD → test 107,300 USD.
• If the 107K does not stand, a further decrease is possible to 103-105k.

BNB/USD 1D Chart Review UpTrend1. Trend Structure
The price was in a long-term uptrend (marked by the orange lines).
The last breakout occurred at the top of this channel, which is a strong signal of trend continuation.
A breakout from the channel usually means that the market is gaining additional momentum – not only maintaining the current growth rate, but even accelerating it.
2. Breakout Range
The height of the channel (the difference between the lower and upper orange lines) is approximately ~$300–$320.
It is assumed that after breaking out of the channel, the price can cover a distance equal to its height.
This indicates a potential target around:
$1,100–$1,150 (the first key resistance level, aligned with the green zone on the chart).
The next range is as high as $1,280–$1,300 (the upper level marked by the green line).
3. Key Technical Levels
Support (red lines):
USD 899
USD 775
USD 702
These levels are most important for potential corrections.
Resistance (green lines):
USD 1,116 (nearest target after the breakout)
USD 1,280–1,300 (full range of the channel height)
4. Oscillators and Momentum
Stoch RSI (at the bottom of the chart): heavily overbought, which may suggest a short-term correction before further upward movement.
In uptrends, overbought levels do not always lead to large declines – often only to sideways consolidation.
5. Scenarios
Bullish:
Price remains above USD 900, consolidates, and then tests USD 1,116, with a target of USD 1,280–1,300.
Bearish:
If the market fails to maintain the breakout and returns below $900, a return to the middle of the channel to the $775–$800 area is possible.
✅ Summary:
A breakout from the channel to the upside is a very positive signal, and the technical upside range reaches $1,100–$1,300. However, due to the overbought position (Stoch RSI), a correction or short-term consolidation is possible before the price continues towards the full target.

BTCUSD 4H chart short-term1. Trendline breakthrough
• In the chart you have a drawn orange relegation line (downward trend).
• The current candle struck above this line, which is the first signal of a change of sentiment from short -term inheritance to more bullshit.
2. Horizers of support and resistance
• Support:
• USD 115,426
• 114,487 USD (below, strong support, where price reactions can be seen)
• Resistance:
• 116,826 USD (the price came there)
• 117,717 USD (next resistance - an important destination point, if the moment is maintained).
3. Volume
• The last candles have a growing volume when struck. This is healthy, confirms that breaking from Trendline is not "empty".
4. STOCHASTIC RSI (below)
• You can see a dynamic break from the level of sale (<20) in the direction of 60+.
• This is a signal of growth, but note: the indicator begins to enter the purchase zone. A correction may appear in the short term.
5.
• Long (aggressive): entry around the retestation around 116k as support, target ~ 117.7k, SL below 115.4k.
• Short (versus): If the price rejects 116.8-117K and returns below 116k, you can consider Shorta with Target 115.4k → 114.5k.

Nike 1W - Just buy it?Nike is showing signs of a reversal after a prolonged downtrend, holding the key buy zone at 69.52, which aligns with the 0.618 Fibo retracement. The breakout of the descending channel adds weight to a structural shift, with the first target seen around 97.63, where the 1.618 Fibo extension and a major resistance zone converge. A successful breakout above this level would open the path toward 125.73, coinciding with the MA200 and a significant volume cluster. While the MA50 still hovers under price, suggesting caution in the short term, the overall structure points toward a bullish scenario.
Fundamentally , Nike remains solid, supported by recovering consumer demand and cost optimization, while its strong brand and institutional interest create a backdrop for sustained growth.
The tactical outlook favors a bullish continuation as long as price holds above the 69.5 zone, with upside targets at 97.6 and 125.7.
If buyers manage to maintain momentum, the market might just rewrite Nike’s slogan: “Just buy it.”

ETH/USDT 1D chart review🔎 Technical analysis
1. Trend
• You can see a clear growth trend line (orange). The price consistently reflected from her, which means that the buyers defend this level.
• Currently, the price is above trendline, which is a bull signal.
2. Support and resistance
• Support:
• $ 4,429
• USDT $ 4,556
• resistance:
• $ 4.687 USDT (current price fight - this is where the market is testing)
• USD 4,793 (strong resistance)
• USD 4,954 (key psychological resistance - nearly 5K)
3. Candles
• We have a long green up move - the momentum is strong.
• The last candles show a little indecisive at 4.687 (upper shadows), i.e. possible consolidation or back.
4. STOCHASTIC RSI (oscillator at the bottom of the chart)
• enters the purchase zone (> 80).
• This often heralds correction, but in strong trends the indicator can last long.
⸻
📊 Scenarios
• bull (continuation of growth):
If ETH stays above 4.687 and pierces 4.793, the next goal is 4.954 (and then psychological 5,000).
• Bear (correction):
Rejection 4.687 and descent below 4.556 can open the way to the Trendline test around 4.430.
Puncting the trend down is a reversal signal and a possible drop towards 4.200.
⸻
📌 Summary
• Main trend: upward.
• Momentum: Strong, but the indicators show buying.
• Strategy:
• Careful entrances with support (4.556 / 4.430).
• confirmed breaking 4.793 = strong signal for further increases.
• Stop loss below Trendline (~ 4,400), because it will negate the current script of the bull

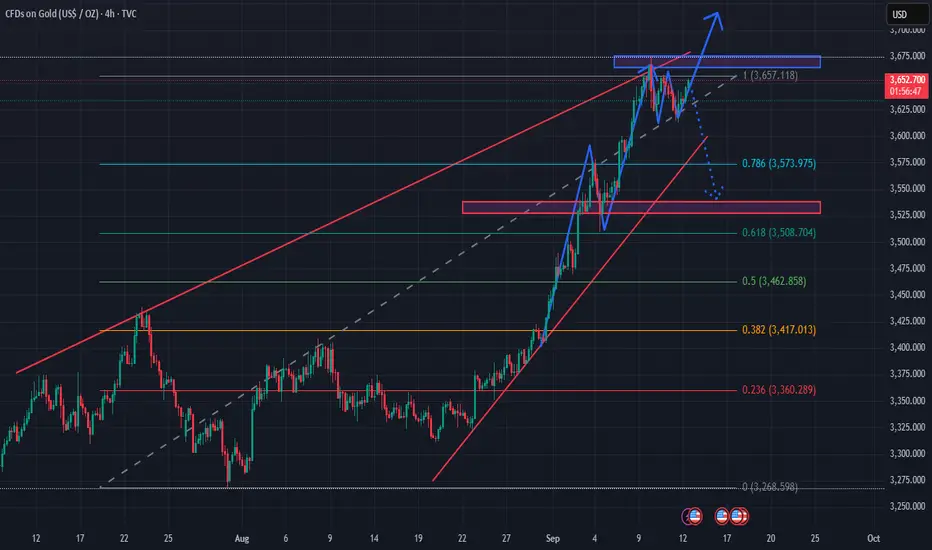
Buy if price breaks above 3,670 with confirmation, target around1. Main Trend
Gold remains in a strong uptrend, forming higher highs and higher lows.
The rising channel (red trendlines) is still intact, though price is now testing a strong resistance zone.
2. Resistance Zone & Upside Target
Key resistance area: 3,650 – 3,670 USD/oz (blue box on the chart).
If price breaks clearly above 3,670, the next target will likely be 3,700 – 3,720 (psychological level and Fibonacci extension zone).
3. Pullback Scenario
If price fails to break resistance, a pullback may occur toward Fibonacci retracement levels:
Fib 0.786 ≈ 3,574 USD (nearest support).
Fib 0.618 ≈ 3,509 USD (major support, aligning with previous demand zone – red box).
Fib 0.5 ≈ 3,463 USD (intermediate support).
The 3,500 – 3,510 USD zone is a critical support area; if broken, a deeper correction could unfold.
4. Technical Signals
Price is forming a small triangle/pennant pattern right at resistance → suggesting a strong breakout is likely soon.
RSI/Momentum (not shown here but typically at these levels) may be in overbought territory, increasing the chance of a short-term correction before resuming higher.
5. Trading Scenarios
Bullish case (preferred): Buy if price breaks above 3,670 with confirmation, target around 3,700 – 3,720.
Bearish case: If price gets rejected at resistance and breaks below the rising trendline, short-term selling may target 3,574 – 3,510.
📌 Summary:
The main trend remains bullish, but the 3,650 – 3,670 zone is the decision point.
A confirmed breakout → 3,700+.
Failure to hold → correction toward 3,574 or deeper to 3,510.
BTC/USD 4H Chart Review1. Growth channel (orange lines)
• The price moves inside the growing channel.
• Currently testing the upper part of this channel → potential resistance.
2. Horizers of support and resistance (red and green lines)
• Support:
• $ 111 632
• 110 019 $ (key support, breaking down can deny an upward trend).
• resistance:
• $ 113 255 (local, currently tested).
• 115 197 $
• 117 416 $ (strong target resistance in the channel).
3. STOCHASTIC RSI (bottom of the chart)
• The oscillator is in the bribe zone (80-100) → possible short -term withdrawal.
• But - if the upward trend is strong, the indicator may remain in this zone for a long time.
⸻
📊 Scenarios
• Bull (continuation of the trend):
• Benefinage above 113K and a breakdown of 115.2k → opens the road to 117.4k.
• The growth channel acts as a guide - as long as the lower line is maintained, the upward trend continues.
• Bear (correction):
• Rejection from 113–115K with a simultaneous signal with RSI → decrease towards 111.6k.
• If 111.6k falls, the goal is 110k.
⸻
⚠️ Applications
• The short -term market looks bought (Stoch RSI), so the correction cannot be ruled out.
• medium -term - as long as the price stays in the growth canal and above 111K, the advantage is on the buyers' side.
• Key level for observation now: 113K -115K. Breaking up = continuation, jet = correction.

ETH/USDT (4H) 1. Trend
• The price is in the downward channel (designated orange lines).
• The last candle tests the lower restriction of the channel → Possible reflections or breaking down.
2. Horizers of support and resistance
• resistance (green lines):
• 4,440 USDT
• 4,382 USDT
• Support (red lines):
• 4,268 USDT (currently tested)
• 4,247 USDT
• 4,176 USDT
• 4 090 USDT (stronger support)
If 4,268 is pierced and maintained below, a further exit can be around 4 176–4 090.
3. RSI (Relative Strength Index)
• Currently RSI oscillates below 50 → Bear advantage.
• There is still a strong sale signal (<30), so theoretically there is still a space to decline.
4. Chop (Choppiness Index)
• The indicator shows a fairly "jagged" market → no strong trend, but from the current context of more bear pressure.
⸻
📊 Scenarios:
• Bull (reflection): If the price stays above 4 268 and reflects from the bottom line of the channel → possible traffic towards 4 382 and 4 440.
• Bear (continuation of declines): closing the candle 4h below 4,268 → a signal for further drop to 4 176 and even 4 090.

XRP/USD 1D Chart ReviewFormation
The chart shows a narrowing symmetrical triangle (orange lines).
The price is now in the lower part of the triangle, with support around $2.80–2.79.
If the price breaks out of this consolidation, we could see a larger trend move.
Supports
$2.80–2.79 – local support (lower line of the triangle).
$2.63 – strong horizontal support, reinforced by the earlier rebound.
$2.46 (SMA200) – key intermediate-term level.
Resistances
$3.00–3.08 (SMA50) – first major resistance.
$3.17 – next barrier.
$3.42 – strong resistance from July.
Indicators
MACD: below the 0 line, negative histogram → bearish signal, but no strong downward momentum yet.
RSI (41): close to the oversold zone, but still neutral-weak – no clear divergence.
SMA50 (red) is falling and is above the price → selling pressure.
SMA200 (blue) is rising and acting as medium-term support.
Scenarios
Bullish – a rebound from the lower boundary of the triangle (2.80) and an attack on $3.00–3.08. A breakout from the upper boundary of the formation will open the way to $3.42.
Bearish – a breakout below the $2.80–2.79 zone → a test of $2.63 and deeper into $2.46 (SMA200).
Summary
The market is at a critical juncture – price is squeezed within the triangle, indicators are neutral-weak, and volume is decreasing. A breakout from this consolidation (most likely in early September) will set the course for the next move.
👉 If you're trading short term, maintaining the $2.80 level is key.
👉 If you're trading medium/long term, only a break above $3.08–3.17 will provide a strong bullish signal.

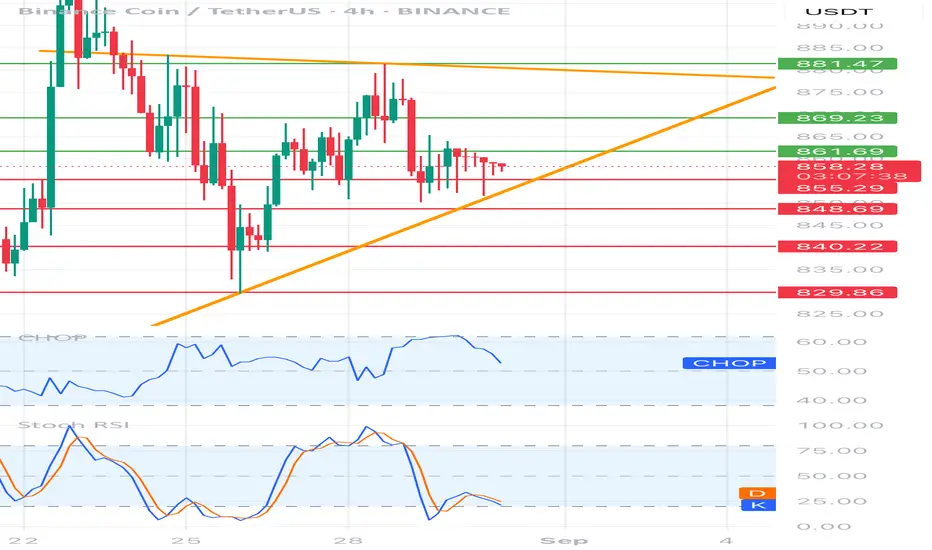
BNBUSDT 4H Chart 1. Price structure
• Current price: ~ 858 USDT
• The price moves in the clinic in a lowering (yellow lines). Upper inheritance trend (~ 881) + lower growth line (~ 848).
• We see consolidation - the market is "squeezed" between supports and resistance.
2. Horizers of support and resistance
• Support:
• 855 (local, this is where the price stopped)
• 848 (Important - lower wedge + demand level)
• 840 and 829 (key with a larger decline).
• resistance:
• 861 (first test, short -term)
• 869 (stronger resistance, earlier reflections)
• 881 (upper wedge line, strategic resistance).
3. Oscillators
• RSI (Chop) - around 50, i.e. neutral → no clear advantage of bulls/bears.
• STOCHASTIC RSI - is located at the bottom of the zone (approx. 20-25), which suggests the possibility of reflecting up (bull signal, but only after the candle confirmation).
4. Scenarios
Bullish (reflection up):
• If the price persists over 855–848 → possible reflection to 861 and 869.
• Breaking above 869 → opens the road to 881 (Test of the upper line of Klina).
• Only closure of the 4h candle above 881 → a signal of a kick from the wedge and a stronger upward movement.
Bearish (continuation of the inheritance):
• If the price drops below 848 and closes the candle at this level → strong inheritance signal, tarpapers: 840 and 829.
• 829 is key support - its bursting down can deepen the declines.
⸻
📊 Summary
BNB is now in the Departing Clinic, in the uncertainty zone:
• Maintenance 848–855 = chance of reflection.
• Punction down 848 = signal to a stronger decrease.
• Only breaking above 881 = signal of stronger growth movement.
BTCUSD 1D Chart1. Price Trend and Structure
The BTC price has fallen below the yellow uptrend line – this indicates a break in the bullish structure and signals weakening buyers.
Currently, the price is hovering around $107,950, which is local support (red zone ~108k).
Next important supports:
$104,500 – $103,900
$98,400 (recent stronger demand level + near the 200 SMA).
Resistance to break:
$113,500 (green line, previous support now acts as resistance).
$118,000 (key level for a return to the uptrend).
$124,500 (highs).
2. Moving Averages
SMA 50 (green) and SMA 200 (blue) → classic trend analysis:
The price is currently below the SMA 50, confirming short-term weakness.
The SMA 200 (~$100,300) is still maintaining the long-term trend – only a break below would signal a more serious bear market.
Possible scenario: If the SMA 50 begins to decline and approaches the SMA 200 → a Death Cross threatens.
3. MACD
Negative histogram, signal line below zero → downward momentum continues.
No signs of a reversal (no positive divergence yet).
4. RSI
RSI ~47 – neutral zone, slightly below 50 → not oversold, but showing an oversold market.
The RSI previously rebounded from the ~70 line (overheating) and is now heading down.
5. Key Levels
Support:
108,000 (current)
104,500
98,400 (strategic)
Resistance:
113,500
118,000
124,500
📊 Scenarios
Bearish (more likely now):
If 108,000 fails → a test of 104,500, and in the longer term, 98,400 USD.
A break below 98,000 would signal a long-term downtrend.
Bullish (less likely at this point):
A return above 113,500 and a daily candle closing above this level → a signal for a reversal and a possible re-entry into the 118–124k range.

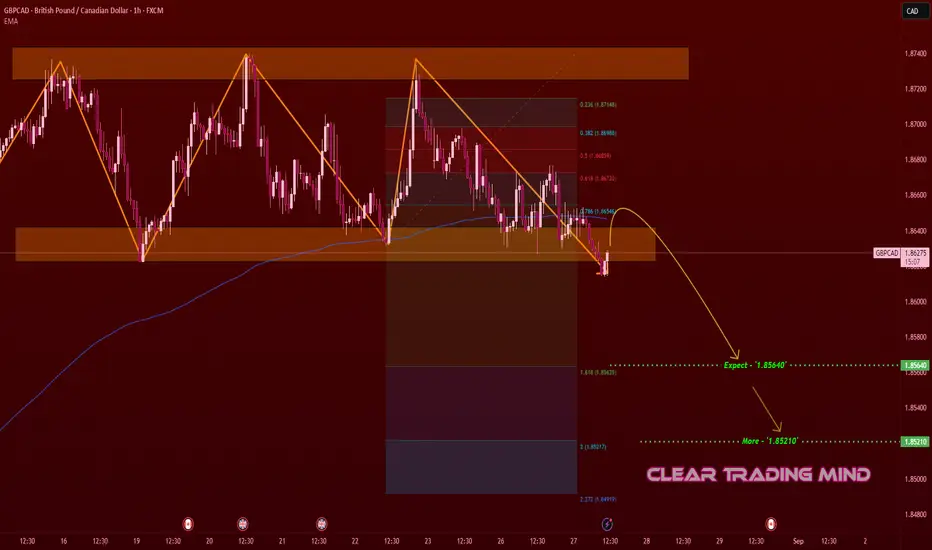
GBPCAD – Fresh Breakout, Short SetupThis time I am looking for a short sell in GBPCAD.
After many days the pair was just ranging, but now a clear breakout has happened and also price broke below the 200 MA, which shows weakness.
From this point, I expect the market to continue down and my short targets are based on Fibonacci extension levels:
- First target around 1.8540
- If sellers stay strong, the next target is 1.8521
For me, this is a good setup to follow the bearish move after the range is broken.
BTC/USD 4h Chart🔹 Trend and Price Action
• There was a downward trend on the chart (orange trend line).
• The price creates above the inheritance trend line, which is the first signal of the potential change of direction.
• Currently, the course oscillates around USD 111.9.
⸻
🔹 levels of support and resistance
You have key zones marked:
• resistance:
• $ 112 236 (local resistance - the price is currently struggling with it),
• $ 113 171,
• 114 481 $.
• Support:
• 110 677 $,
• $ 109 430,
• $ 107 309 (stronger support).
👉 If the price lasts above $ 112 $ 236 - we can see the test 113-114K.
👉 If it does not pierce, possible retest 110.6k or lower.
⸻
🔹 indicators
• MacD - I see that the blue line cut the orange from below → Bycza signal (confirms the attempt to change the trend).
• Stochastic RSI - is high (exit from the hole), but already close to the purchase zone → possible light withdrawal or consolidation before it moves further.
⸻
🔹 Scenarios
1. Bull (more likely now):
• Maintenance above 111.9k - 112.2k → Movement up to 113.1k and 114.4k.
• Breaking 114.4k opens the way to 116K+.
2. Bear (if he doesn't beat 112.2k):
• Rejection → descent to 110.6k.
• Breaking 110.6k → test 109.4k.
