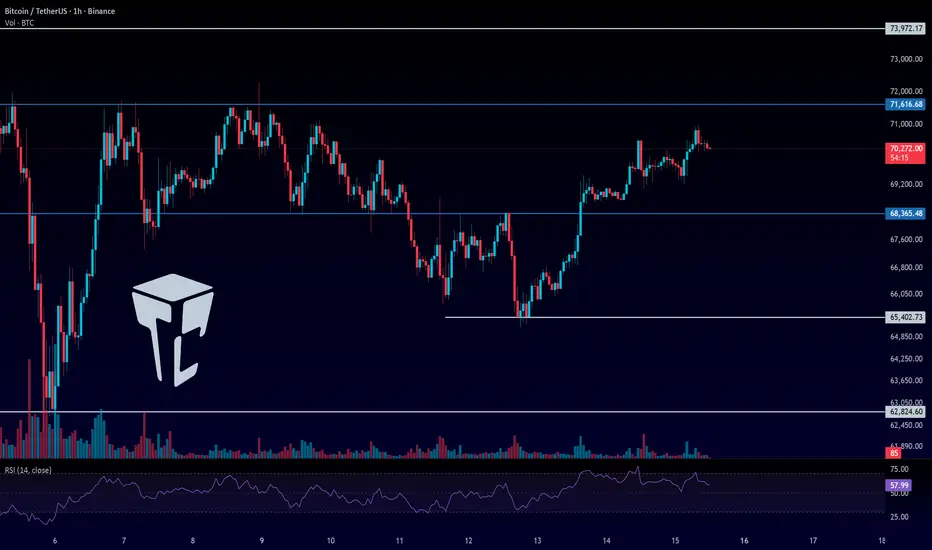
Bitcoin Rejects Resistance, Eyes Support Test Around $65KHello traders! Here’s my technical outlook on BTCUSDT (1H) based on the current chart structure. Bitcoin previously traded within a well-defined descending channel, where price respected both the resistance and support boundaries, confirming controlled bearish pressure rather than impulsive selling. This channel structure guided the market lower with consistent lower highs and lower lows, reflecting steady seller dominance. The decline eventually culminated in a sharp sell-off that swept liquidity and formed a clear turning point, where price reacted strongly from the Buyer Zone. This reaction marked the first sign of demand stepping in and weakening the bearish momentum. Following this reversal, BTC staged a strong impulsive recovery and broke back above the Buyer Zone, signaling a temporary structural shift and attracting renewed bullish interest. After this move, price entered a consolidation phase, forming a clean range where buyers and sellers temporarily found equilibrium. This ranging structure acted as a redistribution zone before the market rotated lower again. The rejection from the upper boundary of the range aligned with the descending resistance line, confirming that sellers were still active within the broader channel context. Currently, BTC is trading below the Seller Zone and remains inside the descending structure, with price recently breaking down from resistance and rotating toward the channel support. This move suggests that the recent bounce was corrective rather than the start of a sustained bullish reversal. Price action shows controlled downside continuation, with the market now approaching the Buyer Zone around 65,000, which also aligns with the lower boundary of the descending channel and a key support area. My primary scenario favors a continuation toward the support region, as long as BTC remains below the Seller Zone and continues respecting the descending resistance line. A clean reaction from the 65,000 Buyer Zone (TP1) could trigger another bounce, as this level represents a confluence of structural support and potential liquidity. On the other hand, a decisive breakdown and acceptance below this Buyer Zone would confirm bearish continuation and open the path toward deeper downside expansion. Until buyers reclaim the Seller Zone and break the descending structure, the broader short-term bias remains cautiously bearish. Please share this idea with your friends and click Boost 🚀
Trend Analysis

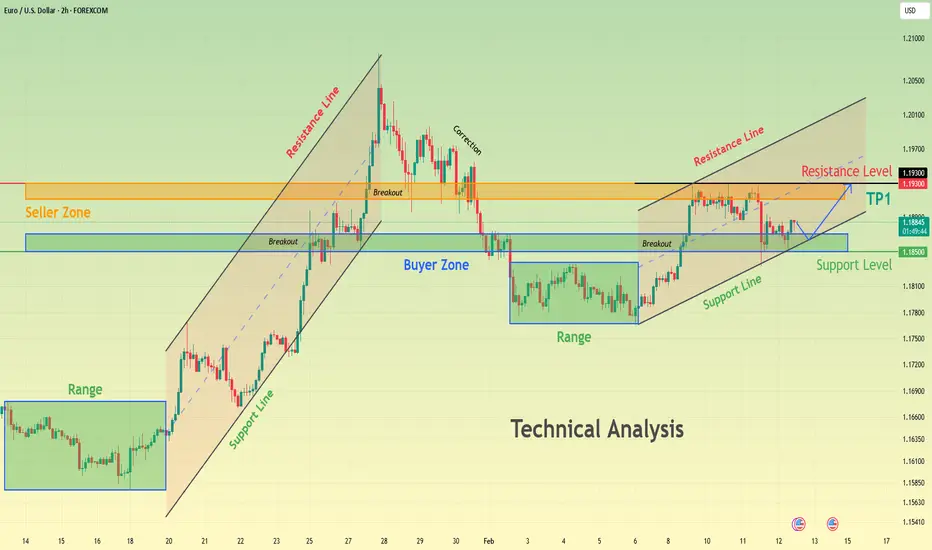
EURUSD Compressing Above Demand - Next Move IncomingHello traders! Here’s my technical outlook on EURUSD (2H) based on the current chart structure. The pair is trading within a broader bullish environment, supported by a clearly defined rising support line that has guided price higher over time. Earlier in the move, EURUSD entered a consolidation phase, forming a clean range where buyers and sellers were temporarily balanced. This range acted as an accumulation zone before a strong impulsive breakout to the upside, confirming buyer dominance and continuation of the bullish trend. Following the breakout, price accelerated aggressively and pushed into the Seller Zone / Resistance area around 1.1930, where selling pressure increased significantly. This led to a corrective pullback, as sellers defended the resistance and price retraced lower. However, the decline found support at the Buyer Zone near 1.1850, which also aligns with the broader support level and rising structure. This reaction signaled that buyers were still active and willing to defend demand, preventing a deeper breakdown and maintaining the overall bullish structure. Currently, EURUSD is consolidating above the Buyer Zone and holding above the key support level, while respecting the rising channel structure. Price action shows compression just above support, suggesting absorption of selling pressure rather than distribution. Multiple breakout attempts from this area indicate that buyers are gradually regaining control, while sellers are struggling to push price decisively below demand. This type of consolidation after a corrective move often precedes another impulsive leg higher. My primary scenario favors bullish continuation, as long as EURUSD holds above the 1.1850 Buyer Zone and continues to respect the ascending support line. A confirmed breakout and acceptance above the current consolidation would open the path toward the 1.1930 Resistance / Seller Zone (TP1), where sellers may attempt to react again. A clean breakout above this resistance would further strengthen the bullish case and signal continuation of the broader uptrend. On the other hand, a decisive breakdown below the Buyer Zone and loss of structural support would invalidate the bullish setup and shift focus toward a deeper corrective phase. For now, structure, trend, and price behavior continue to favor buyers. Please share this idea with your friends and click Boost 🚀
The price of gold might experience a significant drop!The bear is quite straight forward if 5119 is to hold and we are within a c down we have various tps. Cannot pre determine how such correction unfolds. but expect we end up within the area of previous wave 4 triangle before next bull is posisble.

COW/USDC - Bounce from SupportOn the COW/USDC chart, we're seeing a potential bounce after testing the lower range of consolidation (blue rectangle). The price has reacted to support and is forming upward momentum, indicated by the trendline.

Stock markets go side ways for a decade?I would not be surprised to see the stock markets go side ways for a decade...

EURUSD: Long Signal with Entry/SL/TP
EURUSD
- Classic bullish setup
- Our team expects bullish continuation
SUGGESTED TRADE:
Swing Trade
Long EURUSD
Entry Point - 1.1862
Stop Loss - 1.1858
Take Profit - 1.1868
Our Risk - 1%
Start protection of your profits from lower levels
Disclosure: I am part of Trade Nation's Influencer program and receive a monthly fee for using their TradingView charts in my analysis.
❤️ Please, support our work with like & comment! ❤️

positive pullback Positive pullback stocks are high-momentum, long-term uptrending stocks that experience temporary, short-lived price declines (typically 5%–10%) before resuming their upward movement, providing a buying opportunity
.
SPY: Week of Feb 17🥱
Most boring market yet.
I haven't updated since the beginning of the year because I have been waiting for the market to make its move. But alas, it has chosen to be aggressively mean reverty and ranging.
Because of this, I will hone in on the short term for now. In the chart are the weekly levels for next week. Remember, it is a condensed week.
I have shared the 2 day forecast (which would be Tuesday 4 am till Wednesday 8 pm).
Some upside initially, and then, again, mean reverting.
We are in this, well it looks kind of like it wants to be a bullish megaphone but doesn't meet the characteristics of that quite perfectly. So we'll call it a channel. We are in this channel, which is easier to visualize on the 4-Hour chart. Since its snagged the bottom, one would anticipate it to make the next rangy move towards the top.
The biggest question is, is it bearish? And, looking at the chart that would be a resounding yes. This type of pattern usually leads to a mass capitulation event or MCE as I call them. However, if you followed the analysis I posted on understanding Shiller ratio, there is a chance that we actually break out higher from here.
A Review of the progress on the Year
Let's review the current year situation with our annual forecast:
So far we are not following any path at all. There is more similarity to the bearish path though, as the rallies and tops are aligning, just at different price points, which is okay. But the correlation has dropped completely from any path.
The blue line you see with the cloud is a Bayesian Time series projection. It analyzes the data as more information becomes available to create a probability cloud of direction. You can see it is currently pointing down, but just 2 weeks ago was pointing up. It updates as it learns more from price action.
As of right now, based on this path, if it is correct and stays as is, we could see an annual low of 608.
But wait, there's more
I briefly mentioned above that we could see some more upside ( read my Shiller article if you're curious )
If we use an old algorithm I developed centuries ago, these are the results:
Right now its saying 1993 is our most similar year, which puts our annual high at 733 and no bear market or crash. This aligns well with my hypothesis I articulated in the Shiller article. Essentially, there is no reason for a crash yet, despite the fact the valuations are astronomical.
And if we look at it from an average return perspective, this is around a 8% return on the year, which is an expected and normal return, especially after SPY has grossed over 40% over the last 2 years.
Bullish thesis technically still in play here, imo. But we will see.
In terms of next week, I don't see any reason for it to rug pull and start a catastrophic collapse unless heavy hitter MMs suddenly grew logic and rationality overnight. Absent this miracle, I suspect we continue to see incredibly mean reverting based behavior with a grind up.
Best tip I can give you, is to use Mean Reversion based strategies if you are trading the indices, such as Z-Score or Bollinger bands.
That's it for now! Safe trades everyone!

Cello Longif you look at prise it have stable itself now , chances are it will go bullish from here with littel stop loss

SNOW — Livermore Accumulation Cylinder | Weekly AnalysisSNOW — Livermore Accumulation Cylinder | Weekly Analysis
🔬 Pattern: Livermore Accumulation Cylinder with Widening Mouth
📐 Timeframe: Weekly (multi-year formation since 2022)
🤖 ML Confirmation: VolanX v3 — MEAN REV ↑ | 16.9% P(Pattern) | MC 98%
STRUCTURE:
The weekly chart reveals a textbook Livermore cylinder. Ascending trendline
support (connecting $120 → $155 lows) converges with descending resistance
(from $392 ATH through lower highs at $280, $260). Price has oscillated
between these boundaries 5-6 times — consistent with Livermore's
accumulation phases 1-7.
The compression apex is projected around Q3-Q4 2026, meaning the breakout
window is approaching.
QUANTITATIVE OVERLAY (VolanX v3):
My systematic trading platform ran 80 Monte Carlo passes on a 63-day
horizon. Results:
- Predicted Pattern: Mean Reversion ↑ (bounce expected)
- MC Consensus: 98% directional agreement
- E : +0.39% | E : 3.17%
- Edge at current price: -1.57% (NO EDGE)
- Kelly Criterion: 0.0% — zero position size recommended AT CURRENT LEVELS
The system agrees on direction but says the entry is premature.
The risk-adjusted trade activates at the $155-$168 accumulation zone.
LEVELS:
🟢 Entry Zone: $155-$168 (trendline retest)
🟢 Aggressive Entry: $166-$170
🔴 Stop: $143 (below channel support)
🎯 T1: $220-$225 (descending resistance)
🎯 T2: $280 (analyst median PT)
🎯 T3: $320-$380 (full cylinder projection)
📏 R:R from $166 entry: 1:2.5 to T1
CATALYST WATCH:
- Q4 FY26 Earnings: Feb 25, 2026 (binary event)
- $200M OpenAI multi-year partnership (announced Feb 2026)
- $100M AI revenue run rate achieved one quarter early
- 43 Buy / 8 Hold / 1 Sell analyst consensus
- Median PT: $280 (+53% upside)
THESIS:
Livermore's framework suggests accumulation is nearing completion.
The Feb 25 earnings report is the nearest potential ignition catalyst.
A beat + guide raise could trigger the phase 8 breakout above $225
descending resistance. Conversely, a miss provides a better entry
at $155-$165 support — both outcomes work for the patient systematic trader.
"It never was my thinking that made the big money for me.
It always was my sitting." — Jesse Livermore
📊 Analysis: WaverVanir International LLC | VolanX v3 Protocol
⚠️ Not financial advice. Systematic analysis for educational purposes.

ETH at a Historic Support — Breakdown or Massive Opportunity?Ethereum’s most important support level since 2022 is now at risk of breaking.
As you can see, this level has held ETH multiple times since 2022, and now it’s under serious pressure. If it breaks, it’s unclear how deep the next move could be.
That said, this is a historic support level that has survived many difficult phases and major market cycles.
In any case, whether now or within the next one to two weeks, this could become a strong opportunity for long-term holders — both in Ethereum and Bitcoin.
If you’re actively trading this coin and would like us to track short-term triggers on lower timeframes, let me know so we can add it to the watchlist. Otherwise, we’ll continue reviewing it every few weeks.
#Pouyanfa🔥

USDCAD H4 – Structure Is No Longer One-Sided📌 Market Context
USDCAD has transitioned out of a sustained bearish phase into a more complex H4 environment. The aggressive sell-side delivery has already done its job, and price is now operating within a rebalancing range rather than clean trend continuation.
Current Observation
The prior bearish structure was interrupted after downside objectives were met, followed by a meaningful reaction and internal realignment. Since then, price has been rotating between key levels, showing hesitation and selective participation instead of broad directional conviction. This is typical behavior when positioning replaces momentum.
🎯 Key Zones
🔴 Sell-side area:
1.37244 – 1.37433
Upper range pricing where prior imbalance and structure meet. Attention is on whether price is accepted or rejected here, as this zone sits above recent equilibrium.
SL: 1.38017
🟢 Buy-side reaction area:
1.34815 – 1.34617
Lower boundary of the current range and previous reaction base. If revisited, this area is observed for defensive behavior rather than immediate continuation.
SL: 1.34283
🧭 Forward Awareness
The focus now is on how price behaves between these boundaries. Acceptance above the upper zone or failure back into discount will reveal whether the market is preparing for expansion or remains in rotation. Until then, patience matters more than anticipation.
Market context only. Not a signal. Execution depends on live price behavior.

EUR/USD - Triangle Breakout | Sellers in Control📊 Technical Overview TICKMILL:EURUSD
EUR/USD formed a clear symmetrical triangle pattern on the M30 timeframe, showing consolidation after a strong impulsive move.
✅Price rejected precisely from a higher-timeframe bearish order block, confirming strong supply in that zone.
✅The recent break below the triangle structure signals a potential continuation to the downside. Momentum is now favoring sellers as price trades below the structure.
✅If bearish pressure continues, the next target sits around the 1.1800 psychological level, followed by the lower marked key demand zone.
🎯 Key Levels to Watch
• Bearish Order Block (major resistance)
• 1.1800 Psychological Level
• Lower Key Support Zone
A sustained move below 1.1800 could accelerate downside momentum.
✅ Support this analysis with a
LIKE 👍 | COMMENT 💬 | FOLLOW 🔔
It helps a lot & keeps the ideas coming!
⚠️ Disclaimer: This analysis is for educational purposes only.

GEEJAY LONG FORECAST Q1 FY 26Bullish continuation expectation here as price has rejected our resistance forming 2 dojis (thats a candle stick indication for reversal lads)
im expecting price to hit my tp around the red and yellow targets
with the busy week of news events ahead i see a very rangey swingy
start beore the cleaner impulses begin

Bitcoin is in a RANGE - trade it until it breaksBitcoin is in a RANGE - trade it until it breaks
key buy zone
$60 185
$60 115
key sell zone
72 281
79 378

Possible Trend Reversal SignalAfter long uptrend over a few days, maybe we will see a reversal to go back down.
Can start to build short position on green candle drawbacks

Palantir is Starting the Fear PhasePalantir is Starting the Fear Phase
Wall Street has seen several popular stocks lately.
NASDAQ:NVDA is the clear leader but we've recently seen a Head and Shoulders pattern unconfirmed, but there is a high risk to break it!
We cannot forget Palantir as another leader. The market believes their software model will be totally revolutionary. In reality the business model looks much more like Accenture and recent fundamentals support this view, more consulting and less SaaS.
The stock recently broke a Head and Shoulders pattern .
This signal alone is enough for me to consider a short position. These patterns happen at the end of a trend and offer a very high probability of success . The main question is whether the correction reaches the 50 percent Fibonacci level or the 100 percent level as often happens.
In this article I will analyze the current situation for NASDAQ:PLTR and how far the stock could fall in the coming months.
Chronology
Until last November we saw incredible euphoria with the price rising 200% in just six months.
The earnings report in November provided the first warning sign.
A downward gap formed and the price never recovered. Just before Christmas the price tried to fill that gap but sellers took control immediately, ending the Denial Phase quite fast.
This showed that big institutions were using the strength to exit at good prices rather than buying more. That marked the end of the euphoria phase . A high price to earnings ratio of around 600 and news of Michael Burry taking significant short positions likely added to the pressure.
The Shift to Fear in 2026
As we move through 2026 the Denial phase is ending and Fear is starting to take over. Rapid progress in AI agents is hurting many software and consulting models. Palantir fits right into that category. From my perspective we are currently in the fear zone of the typical market cycle. This suggests that the most difficult phases of the cycle are still ahead of us.
Watching the support levels marked by the Head and Shoulders pattern is essential. These levels align well with areas of high volume.
Key Levels and Support
Breaking the 100% Fibonacci level would mean falling out of the current channel . The next major support sits at $86. This area saw significant volume before the final stages of market madness that pushed financial ratios to extreme levels. It will be an important zone for the long term.
The current channel shows that we are no longer in the aggressive upper section. We are moving into a much more dangerous area . If Palantir continues to disappoint and AI agents keep evolving at this speed the stock could enter a very large free fall.
🤔 Have we ever seen Head and Shoulders Before?
XETR:NOV
NASDAQ:TSLA
NASDAQ:MRNA
Or in some previous ideas shared with you:
NSE:NIFTY
👇 WANT MORE?
🚀 Hit the rocket, read my profile and follow so we can find each other again.

XAG/USD (Silver) on 1-H TF | 15-02-2025 |TCATechnical Analysis of XAG/USD (Silver) on 1-Hour Timeframe
Short Sell / Exit Setup
Overview:
Silver has broken down from the previously established bullish channel (highlighted in light purple). The prior short call reached its target price (TP1) immediately and then retraced to the defined pullback level.
New Entry and Exit Levels:
The current price stands at $77.45. A new short position or exit should be considered at this price, with a pullback level near $77.70.

TradeCityPro | Bitcoin Daily Analysis #269👋 Welcome to TradeCity Pro!
Let’s take another look at Bitcoin. Compared to yesterday, the market hasn’t moved to any major new area, but let’s check the chart again to re-identify potential opportunities.
⌛️ 1-Hour Timeframe
Yesterday was Saturday and market volume was very low. Because of that, Bitcoin didn’t show much volatility. Also, since Bitcoin dominance dropped a bit yesterday, some altcoins managed to make attractive upward moves.
📊 But on Bitcoin itself, as I mentioned, there wasn’t any significant movement and price mostly stayed in a range throughout the day.
✔️ Our long trigger is still the 71,616 area. I’m not paying attention to the RSI divergence that has formed, because just like we saw in the previous analysis, RSI is currently giving false signals and isn’t reliable right now.
🔽 For short positions, my preference is for the market to first form a lower high and lower low below 68,436, and then look for short setups.
🔔 However, if price reacts to this 68,436 area and tests it one or two times, we can also open a short position on the break of that level.
The main short triggers remain 65,402 and 62,824.
❌ Disclaimer ❌
Trading futures is highly risky and dangerous. If you're not an expert, these triggers may not be suitable for you. You should first learn risk and capital management. You can also use the educational content from this channel.
Finally, these triggers reflect my personal opinions on price action, and the market may move completely against this analysis. So, do your own research before opening any position.
GOLD: Bullish-Neutral. Wait For Valid Buy Long Setups!In this Weekly Market Forecast, we will analyze Gold for the week of Feb. 16-20th.
Gold is still bullish, but it is ranging sideways. Last week closed an indecisive week with a doji candle. Not great, but the integrity of the overall uptrend is still intact, despite the flash crash last month.
Look for price to respect the bullish discount arrays, and wait patiently for the buy models to form.
There is no reason to take shorts, as there has not been a bearish BOS event.
Enjoy!
May profits be upon you.
Leave any questions or comments in the comment section.
I appreciate any feedback from my viewers!
Like and/or subscribe if you want more accurate analysis.
Thank you so much!
Disclaimer:
I do not provide personal investment advice and I am not a qualified licensed investment advisor.
All information found here, including any ideas, opinions, views, predictions, forecasts, commentaries, suggestions, expressed or implied herein, are for informational, entertainment or educational purposes only and should not be construed as personal investment advice. While the information provided is believed to be accurate, it may include errors or inaccuracies.
I will not and cannot be held liable for any actions you take as a result of anything you read here.
Conduct your own due diligence, or consult a licensed financial advisor or broker before making any and all investment decisions. Any investments, trades, speculations, or decisions made on the basis of any information found on this channel, expressed or implied herein, are committed at your own risk, financial or otherwise.

XAUUSD SELLPrice is currently consolidating inside a tightening structure with a clear descending resistance and rising support, showing compression right below a key supply zone around the 5,040–5,060 area. The rejection from the top of the range suggests buyers are losing momentum while price remains capped under the trendline and moving averages. If this structure breaks to the downside, the move could accelerate toward the lower liquidity zone and previous imbalance around the mid-4,8xx region, following a typical sweep-and-drop pattern. Overall bias remains bearish unless price can break and hold above the supply zone, which would invalidate the short setup.
ADA (Cardano): Range Holding Above TrendlineHi!
Price is currently consolidating inside a defined horizontal range while respecting the ascending trendline support. The broader structure still shows higher lows, meaning buyers are defending pullbacks and keeping the short-term bullish structure intact.
After the sharp impulse move up, the market shifted into accumulation, forming a balanced range between support and resistance. As long as price holds above the lower boundary and the trendline, continuation toward the upper range boundary remains the higher-probability scenario.
Market Structure
Higher lows maintained
Trendline acting as dynamic support
Range acting as a short-term accumulation
Key Levels
Support Zone: ~0.277
Mid Range Reaction Area: ~0.280 – 0.282
Range High Resistance: ~0.284 – 0.286
Targets
🎯 Target 1: 0.284 – 0.286
🎯 Target 2: ~0.292
Invalidation
❌ Sustained break below 0.277 + loss of trendline support would weaken bullish structure and open downside rotation inside or below the range.

XAU/USD: Gold Under PressureThe current technical analysis of Gold (XAU/USD) on the hourly (1h) timeframe shows a market structure in transition, marked by selling pressure following a failure below a major resistance zone. After reaching a local peak, the price began a correction that brought it back below the psychological level of $5001.10. We observe the use of Fibonacci retracement levels, where the price seems to reject the 0.5 (50%) and 0.618 (61.8%) zones—crucial levels that often serve as reversal points for a bearish continuation within a corrective trend.
The presence of order blocks (gray zones) indicates historical supply and demand areas. Currently, the chart suggests a downward trajectory, illustrated by the gray arrow, pointing toward a liquidity objective located in the lower support zone, around 4680. This target corresponds to an untested demand zone where buyers could potentially re-emerge.
