NZD/USD Builds Momentum As Bulls Target Fresh GainsMarket Analysis: NZD/USD Builds Momentum As Bulls Target Fresh Gains
NZD/USD is also rising and might aim for more gains above 0.6060.
Important Takeaways for NZD USD Analysis Today
- NZD/USD is consolidating gains above the 0.5995 pivot zone.
- There is a major bearish trend line forming with resistance at 0.6030 on the hourly chart of NZD/USD.
NZD/USD Technical Analysis
On the hourly chart of NZD/USD, the pair started a fresh increase from 0.5930. The New Zealand Dollar broke the 0.5950 barrier to start the recent rally against the US Dollar.
The pair settled above 0.6000 and the 50-hour simple moving average. The bulls were able to push the pair above the 61.8% Fib retracement level of the downward move from the 0.6060 swing high to the 0.5928 low.
However, the bears are now protecting the 76.4% Fib retracement at 0.6030. There is also a major bearish trend line forming with resistance at 0.6030. The NZD/USD chart suggests that the RSI is still above 50.
On the downside, immediate support is near the 0.5995 level and the 50-hour simple moving average. The first key zone for the bulls sits at 0.5930.
The next key level is 0.5900. If there is a downside break below 0.5900, the pair might slide toward 0.5865. Any more losses could lead NZD/USD into a bearish zone to 0.5820.
On the upside, the pair might struggle near 0.6030. The next major resistance is near the 0.6060 zone. A clear move above 0.6060 might even push the pair toward 0.6090. Any more gains might clear the path for a move toward the 0.6120 zone in the coming days.
This article represents the opinion of the Companies operating under the FXOpen brand only. It is not to be construed as an offer, solicitation, or recommendation with respect to products and services provided by the Companies operating under the FXOpen brand, nor is it to be considered financial advice.
Trend Analysis

GMEGame Is On,Character Loop Online,Wedge Up,Monthly RSI UncagedThis is a follow-up on my previous harmonic / character / wedge posts ON GME – and so far the roadmap is getting more and more exciting!
What happened in the meanwhile:
The character loop did it again: that rounding top I highlighted in the demand zone actually formed, held, and price has been grinding higher from there. Still a quiet rhythm, but very constructive and, in my view, promising.
The big Bearish Crab + nested Bearish Bat on the higher timeframes are still in play. The 0.618 fib retrace inside major monthly support has held and the spring from the accumulation zone looks like it’s playing out instead of breaking down.
The falling wedge broke to the upside, exactly as mapped. That breakout pushes my first larger technical target toward the 38 USD zone, which lines up nicely with the VWAP from the 2021 high.
On the momentum side, ADX is sloping up on the weekly, with +DI curling higher and –DI pushing down – that’s the kind of backdrop I want to see behind a breakout, not just random noise.
Levels & roadmap I’m watching next:
On the daily fib retrace from the last high-to-low, we’re battling the 0.382. If price can really claim that, the door opens to the 0.618 around ~28.5 USD.
Above that, the wedge target around 38 USD becomes the next big checkpoint.
Further out, the fib extensions from the A to C legs of both harmonics stack into interesting confluence zones around 56 USD, 180 USD and 235 USD – potential areas where this whole harmonic game could start to exhaust if it really goes full script.
For now, the story is simple for me: the spring held, the character loop showed up again, the wedge broke up, and momentum is starting to support the move. As long as those structures stay intact, I’m treating dips as part of the climb rather than the end of the idea.
Not financial advice – just sharing my fantasy

Ethereum turns bullish, confirmed through price action (PP: 40%)Since the start of the drop 14-January, Ethereum never managed to close more than two days green. Clearly showing an overwhelming pressure coming from sellers. This pattern has been broken and this is good news.
Ethereum already closed three days green and today is the fourth. The day started red, but all selling was quickly bought leaving the session with a long lower shadow. Bullish confirmation.
The previous all-time high started from a low 22-June 2025. The end of the correction and recovery is happening right around this level.
Today, Ether is moving back above this low, $2,113, showing that the bulls have gained control of this chart, with the chart the market.
The bulls now have control of the market, which simply means we are going up next. Do you agree?
The first target sits within a range between $2,800 - $3,000. That's a 40% move in the making short-term. Are you ready?
Thank you for reading.
Namaste.

On the long-term supportThe price corrects downward until it reaches the long-term support indicated in blue.
The decline also brings the price to meet the weekly SMA 200 (blue line).
It is very likely that a price reversal will occur from this point.

Bitcoin(BTC), has yet to reach a cyclical low.BINANCE:BTCUSDT
It’s been about four months since my post calling the end of Bitcoin’s bullish season, and here is an updated cycle-based outlook.
(CME chart during the 22-year bear market)
After forming a downside gap near the 81K level, Bitcoin saw a one-way selloff down to around 60K, followed by a technical rebound.
I believe this 81K gap is likely to be filled in the next bullish cycle, similar to the price action observed during the 2022 bear market.
From a cycle perspective, the macro bottom is expected to form around August–September 2026. Until then, Bitcoin may continue moving in a prolonged consolidation phase driven more by time correction than sharp price movements.
My projected downside target zones are:
• Primary zone: 49K–52K
• Deeper correction: below 39K
• Extreme scenario: toward the 32K region
However, if price moves up first and fills the 81K gap, this bearish cycle scenario will be invalidated.
Your follow and boost would mean a lot. 🚀

BITCOIN Could that be the shortest Bear Cycle ever???Bitcoin (BTCUSD) reached (almost) its 1W MA200 (orange trend-line) last week fastest than any other Bear Cycle before. At the same time, its 1W LMACD hit the same symmetrical level (blue) it did every time BTC completed the 1st Stage of the Cycle. Especially in the case of the (previous) 2022 Bear Cycle, it was around the same time the price came close to the 1W MA200 as well.
As this chart shows, the 4-year Cycle bottom occurs around when the 1W LMACD makes a Bullish Cross after its hits -0.21. We are still far from that. But what past Bear Cycles show is that when the 1W LMACD has hit the current level, Bitcoin takes at best the same amount of time to bottom as it did from the start of the Bear Cycle to the moment the LMACD hit the current level (blue Support). That was particularly the case during the previous (2022) Bear Cycle (was 27 weeks from High to LMACD contact, and another 27 weeks until the Cycle bottomed). The two Bear Cycles before it, bottomed in less time.
As a result, given that last week completed 17 weeks from the Cycle Top up until the LMACD contact, the Cycle could bottom in the next 17 weeks (based on that model). This suggests the first week of June 2026, while the 4-year Cycle suggests mid-September. So what do you think is more likely to happen? Could that be BTC's shortest Bear Cycle ever?
Feel free to let us know in the comments section below!
---
** Please LIKE 👍, FOLLOW ✅, SHARE 🙌 and COMMENT ✍ if you enjoy this idea! Also share your ideas and charts in the comments section below! This is best way to keep it relevant, support us, keep the content here free and allow the idea to reach as many people as possible. **
---
💸💸💸💸💸💸
👇 👇 👇 👇 👇 👇

US30 Clear Breakout Done , 300 Pips Ready To Take !Here is my 4H Chart on US30 , We Have A Clear Breakout and the price closed above my old res and new support after more than 4 weeks the price respect the res and touch it and move to downside but for the first time the price closed above it with Daily And Weekly Candle and that prove it`s a real breakout and we have a very good bullish Price Action on 4H /Daily And Weekly T.F Also , the price will try to retest the area and if it give us a good bullish price action on smaller time frames we can enter a buy trade and we can targeting from 200 to 400 pips , if we have a daily closure again below my new res then this idea will not be valid anymore .
Entry Reasons :
1- Clear Daily & Weekly Breakout .
2- Many T.F Confirmations .
3- Perfect Price Action .
4- Clear Bullish P.A .

Ethereum Price Continues to Range, is $946 Next?Ethereum price action continues to trade within a well-defined higher-timeframe trading range, with current conditions suggesting increased downside risk. Price is presently testing the point of control, which has produced a short-term bounce on the lower timeframes. While this reaction is technically valid, it appears weak in nature and lacks strong bullish follow-through.
On the weekly timeframe, this bounce is unfolding directly into a key bearish order block, reinforcing the importance of the current price zone. Historically, reactions into bearish order blocks within range environments often act as supply zones, where sellers reassert control. If Ethereum fails to reclaim acceptance above this region, the probability of rejection increases.
From a structural perspective, loss of the point of control would signal a shift back toward imbalance. Such a move would likely trigger a rotational move lower within the broader range structure. In this scenario, attention turns to the range low support near the $946 level, which represents the next major downside target.
From a technical, price action, and market structure perspective, Ethereum remains vulnerable. A confirmed rejection from the bearish order block combined with acceptance below the point of control would significantly increase the likelihood of a deeper corrective phase unfolding before any meaningful recovery attempt.

$BTC.D are we there yet?closed below the 7 ema on the daily
what goes up must come down hehe
IF we doo loose 57% this is where you want to be getting your entries
pr do the senisible thing and wait for confirmation
either way am in already lower leverage for now with some ammo if given another dippy
60% or above the white line i would be wary again

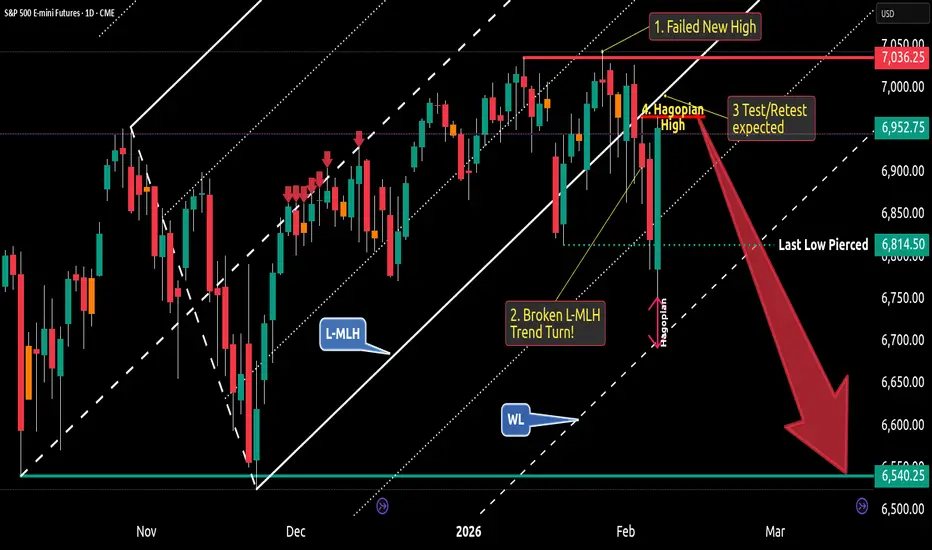
S&P500 Bearish Trend Turn - Here's My Short Trade🔱 As long as price follow the projection of a pitchfork, the trend is OK. But what we see here is a turn - and here's why:
1. The market failed to close above the last high. So, this is a failed new high - or a Double-Top
It is confirmed because the last low is pierced by the last Fridays bar.
2. Price opened & closed below the Lower-Medianline-Parallel = The projection of the fork, which shows the temporary trend, is clearly broken. And this means: Temporary Trend Turn.
3. What we see now with last Fridays bar is a expected Test/Retest of the L-MLH. It's also a slap in the face of early Bears.
4. And if you dig really deep, you also see the Hagopian against the Warning-Line (WL), which confirms the thesis of the Test/Retest of the L-MLH. Because Hagopian says, that price will go farther in the opposite direction than from where price came. In clear words: Price will go higher than the "Hagopian High". And to be precise, I expect the S&P500 to test the L-MLH.
So, week Short hands are completely clueless now. How can it be that price pulls back so hard...?
Thank God I'm trading with the pitchfork. They give me clear rules. And I never have to doubt, because there is zero subjectivity involved.
Can price go higher than the last high at 1. ?
Sure, everything is possible. But - It's not likely to happen, my Pitchfork rules say.
My trade?
I will observe price-action at the L-MLH.
As soon as the markets show it's hand by clear weakness, I'm loading my Boat to the Short side.
My exit? If a full bar is closing above the last high at 1.
There you have it.
👉 FYI: I'm NOT a signal service. I provide educational content. If you want to learn more about trading with the Pitchforks/Medianlines, I'm here for you to help. And of course you can always check out all my links where you find helpful, educational material.
I hope this helps and I wish you all a great and profitable new week.
FEBURARY 9 Bitcoin Bybit chart analysisHello
It's a Bitcoin Guide.
If you "follow"
You can receive real-time movement paths and comment notifications on major sections.
If my analysis was helpful,
Please click the booster button at the bottom.
This is a Bitcoin 30-minute chart.
There are no separate Nasdaq indicators.
When the red finger moves,
*This is a one-way long position strategy.
1. $66,268.1 is the entry point for a long position. / Stop-loss price is set when the green support line is broken.
2. $69,531.5 is the first target for a long position.
-> $71,221 is the second target. -> Target prices are set at Top and Good in that order.
Points 1 and 2 in the middle are used to re-enter a long position.
If the price touches 69.5K at the top first,
it could end in a sideways market within the purple support line of point 1. From the breakout of the green support line, the price remains open to a maximum of $61,222.5, so please be cautious.
Up to this point, please use my analysis for reference only.
Please operate safely, following the rules and setting stop-loss orders.
Thank you.

GOLD | Climbs Ahead of U.S. Jobs and Inflation DataGOLD | Rises Ahead of Key U.S. Jobs and Inflation Data
Gold climbed above $5,010, reaching a one-week high as investors await key U.S. economic data that could shape expectations for the Federal Reserve’s rate path.
Markets now focus on the U.S. jobs report and inflation data, both of which could drive the next major move in precious metals.
Technical Outlook
Gold remains in a range-bound structure near the pivot.
While trading below 5023, price could dip toward 4974, where a potential bullish rebound may begin if support holds.
A 30min or 1H candle close above 5023–5035 would confirm bullish continuation toward 5098 and 5141.
Key Levels
• Pivot: 5023
• Support: 4975 – 4930 – 4893
• Resistance: 5065 – 5098 – 5141

SILVER TRAP SET Premium Zone Rejection → Big Drop LoadingICMARKETS:XAGUSD
Market Bias: BEARISH (4H – Silver / XAGUSD)
Overall market structure is bearish (clear Lower Highs & Lower Lows).
Price is respecting a descending trendline → trend continuation bias.
The recent bullish push failed to break the 61.8%–78.6% Fibonacci retracement zone, which is acting as strong supply.
Price is trading below the 50% Fib equilibrium, confirming sellers still control the market.
Previous impulsive drop shows strong bearish momentum, current move is only a corrective pullback.
Trade Reasoning
HTF Structure
Major bearish leg from the top → impulsive sell-off.
Current price action is a corrective retracement, not a trend reversal.
Fibonacci Confluence
Strong rejection zone between 61.8% (≈81.40) and 78.6% (≈86.17).
Price failed to sustain above this premium zone → ideal sell area.
Trendline Resistance
Descending trendline is intact.
Price is expected to retest and reject this line before continuation lower.
Liquidity Targeting
Equal lows / liquidity resting below 70.40 → 68.00 → 63.80.
Market typically moves to clean downside liquidity in bearish structure.
Trade Plan
Sell Entry (Preferred)
Sell Zone: 78.50 – 80.00
Entry confirmation on LTF (rejection / bearish candle)
Stop Loss
SL: 86.30
Above 78.6% Fib + structure high
This level invalidates bearish idea
Take Profit Targets
TP1: 74.70 (38.2% Fib – partial booking)
TP2: 70.40 (23% Fib + demand zone)
TP3 (Runner): 63.80 (range low / major liquidity)
Trade Summary
Trend: Bearish
Setup: Pullback → Sell from premium
Logic: Structure + Fib + Trendline confluence
Risk-Reward: High (1:3 to 1:5)
As long as price stays below 86.30, the bearish bias remains valid.
A strong close above that level would invalidate the setup.

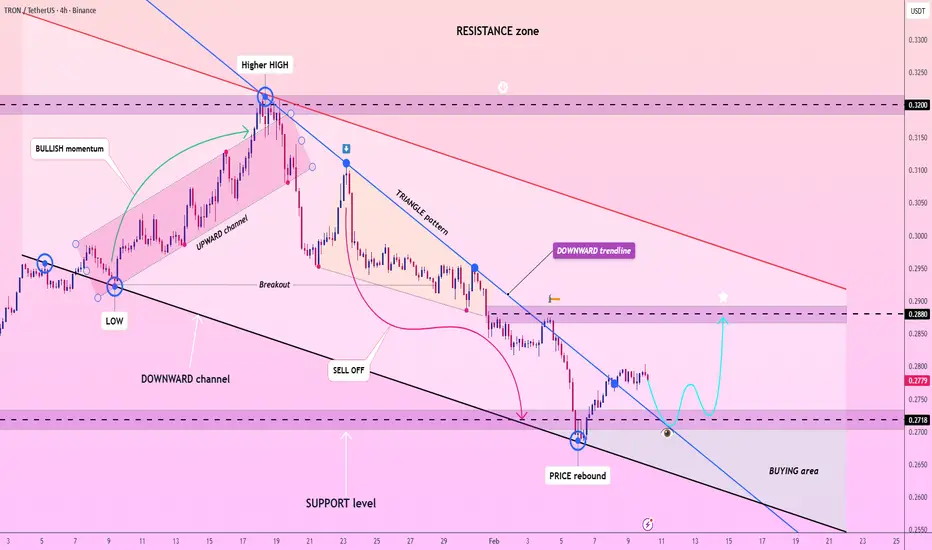
Lingrid | TRXUSDT Price Testing Major Demand SupportBINANCE:TRXUSDT is reacting from a well-defined demand zone after a prolonged decline, with price now stabilizing near the lower boundary of the descending structure. The sharp sell-off appears to have slowed, and recent candles suggest sellers may be losing follow-through as price respects the 0.27 support band. This zone could act as a base for a recovery.
If buyers continue to defend the 0.27–0.272 area, price might rotate higher toward the broken level near 0.288, where prior supply sits. A successful reclaim of that level could shift short-term momentum and open room for a broader corrective push.
➡️ Primary scenario: support holds at 0.27–0.272 → rebound toward 0.288.
⚠️ Risk scenario: failure below 0.27 may invalidate the bounce and expose deeper downside toward the channel base.
If this idea resonates with you or you have your own opinion, traders, hit the comments. I’m excited to read your thoughts!
GBPJPY OUTLOOKOANDA:GBPJPY
Personally expecting to see some buys reactions from that areas, which may likely fail due to the just concluded election from the JPY

EU SELL In terms of market structure M being formed which looks to be the start of the downtrend.RSI divergence also present.

NZDUSD MARKET OUTLOOK Price is building momentum and we’re looking forward to seeing bullish gains in no distance time. Technically, price is retesting a broken trendline and also there’s lot of bullish momentum which could drive price up. We’re looking forward to capitalizing on this opportunity.

#LINK Just Broke Down – And This Move Can Get Ugly FastYello Paradisers! Are you really watching #LINKUSDT closely right now, or are you still pretending nothing serious has happened, even though the market has already made its decision? Let's view #ChainLink setup:
💎#LINK has already confirmed a bearish breakdown from the symmetrical triangle structure. Price lost the ascending support decisively and is now trading around $8.54, below the key structure that had been holding the market together. This breakdown did not happen randomly – it followed multiple weak attempts to push through the descending resistance, clearly showing exhaustion on the bullish side.
💎The structure was very clean: descending resistance + ascending support, and as always, once support gave way, sellers stepped in aggressively. The former support is now acting as resistance for #LINKUSD, which increases the probability that this move is not just a fake-out but a continuation to the downside.
💎With the breakdown already confirmed, the $8.00 demand zone is now under serious pressure. If price fails to reclaim it quickly, the next high-probability downside target becomes the key support around $7.15, where stronger buyers may finally attempt to slow the move. This level is critical and aligns with previous demand and liquidity resting below.
💎This bearish scenario is only invalidated if #LINK reclaims and holds above the resistance zone at $9.28. A clean acceptance above that level would trap late shorts and flip the structure back to bullish, opening the door for a recovery move. Until then, rallies should be treated as corrective and risky.
Trade smart, Paradisers. This setup will reward only the disciplined.
MyCryptoParadise
iFeel the success🌴

TradeCityPro | Bitcoin Daily Analysis #262Welcome to TradeCity Pro!
Let’s move on to Bitcoin analysis. After the recent sharp drop, the market is now going through an upward corrective move.
1-Hour Timeframe
After Bitcoin’s bearish move down to the 62,824 support, it entered a corrective phase and has so far retraced up to 71,670.
During this correction, volume has decreased, which confirms the strength of the bearish trend. Now, as a new bearish leg appears to be starting, selling volume is increasing again, further supporting the continuation of the downtrend.
At the moment, the short trigger we have on Bitcoin is 67,735. This trigger remains valid as long as price does not stabilize above 71,670, and we can open a short position on a clean break of this level.
The main short trigger is still the break of 62,824. That said, in my view, if price continues lower, it will likely react to another low and form a new structure before moving further down—but for now, 62,824 remains our key trigger.
For long positions, we have a very risky trigger at the break of 71,670. This setup is only worth considering if buying volume starts to increase, and even then, it should be taken with minimal risk.
The main long trigger will only be confirmed after a trend change on higher timeframes, such as the 4-hour and daily charts.
❌ Disclaimer ❌
Trading futures is highly risky and dangerous. If you're not an expert, these triggers may not be suitable for you. You should first learn risk and capital management. You can also use the educational content from this channel.
Finally, these triggers reflect my personal opinions on price action, and the market may move completely against this analysis. So, do your own research before opening any position.

Bearish reversal off key resistance?Cable (GBP/USD) is rising towards the pivot and could reverse to the 38.2% Fibonacci support.
Pivot: 1.3710
1st Support: 1.3627
1st Resistance: 1.3782
Disclaimer:
The opinions given above constitute general market commentary and do not constitute the opinion or advice of IC Markets or any form of personal or investment advice.
Any opinions, news, research, analyses, prices, other information, or links to third-party sites contained on this website are provided on an "as-is" basis, are intended to be informative only, and are not advice, a recommendation, research, a record of our trading prices, an offer of, or solicitation for, a transaction in any financial instrument and thus should not be treated as such. The information provided does not involve any specific investment objectives, financial situation, or needs of any specific person who may receive it. Please be aware that past performance is not a reliable indicator of future performance and/or results. Past performance or forward-looking scenarios based upon the reasonable beliefs of the third-party provider are not a guarantee of future performance. Actual results may differ materially from those anticipated in forward-looking or past performance statements. IC Markets makes no representation or warranty and assumes no liability as to the accuracy or completeness of the information provided, nor any loss arising from any investment based on a recommendation, forecast, or any information supplied by any third party

GBP/USD: Volume Profile Rejection + FVG Confluence (1.3532)GBP/USD shows a strong rejection of lower prices and a shift from selloff into an uptrend. Volume Profile highlights a heavy volume zone where buyers aggressively stepped in. The planned long entry is at 1.3532; the start of that volume cluster, which aligns with the beginning of a fair value gap. If price pulls back there, a buyer reaction and bounce are expected.

Boeing May Be Taking OffBoeing was stuck below a key level for two years, but now it may be taking off.
The first pattern on today’s chart is the $233.84 level, the high on January 8, 2024. (That was a key session when the aerospace giant gapped lower after a 737 MAX 9 in-flight incident.)
BA probed that level last summer before sliding back to $180. It climbed above the resistance in January and bounced at it last week. Has old resistance become new support?
Second, the 50-day simple moving average (SMA) recently had a “golden cross” above the 200-day SMA. That may suggest its long-term trend has grown more positive.
Third, stochastics are turning up from an oversold condition.
Finally, the 8-day exponential moving average (EMA) has stayed above the 21-day EMA. That may reflect short-term bullishness.
TradeStation has, for decades, advanced the trading industry, providing access to stocks, options and futures. If you're born to trade, we could be for you. Learn more here about TradingView’s Broker of the Year!
Past performance, whether actual or indicated by historical tests of strategies, is no guarantee of future performance or success. There is a possibility that you may sustain a loss equal to or greater than your entire investment regardless of which asset class you trade (equities, options or futures); therefore, you should not invest or risk money that you cannot afford to lose. Online trading is not suitable for all investors. View the document titled Characteristics and Risks of Standardized Options at www.TradeStation.com . Before trading any asset class, customers must read the relevant risk disclosure statements on www.TradeStation.com . System access and trade placement and execution may be delayed or fail due to market volatility and volume, quote delays, system and software errors, Internet traffic, outages and other factors.
Securities and futures trading is offered to self-directed customers by TradeStation Securities, Inc., a broker-dealer registered with the Securities and Exchange Commission and a futures commission merchant licensed with the Commodity Futures Trading Commission). TradeStation Securities is a member of the Financial Industry Regulatory Authority, the National Futures Association, and a number of exchanges.
TradeStation Securities, Inc. and TradeStation Technologies, Inc. are each wholly owned subsidiaries of TradeStation Group, Inc., both operating, and providing products and services, under the TradeStation brand and trademark. When applying for, or purchasing, accounts, subscriptions, products and services, it is important that you know which company you will be dealing with. Visit www.TradeStation.com for further important information explaining what this means.

Continuing with my re-Buy ordersAs discussed throughout my last week's commentary: 'My position: I am Trading Gaps only on each market closing / Asian opening where I am Trading with bigger Lots (multiple Buying orders) which are so far delivering excellent orders. I am monitoring the Price-action from sidelines and on market closing, I engage set of Buying orders where market is opened with a Gap up. On Tuesday I have caught two #100 Lot orders, one from #4,672.80 and second from #4,665.80, both closed on #4,695.80. Last night, two Buy orders (both #100 Lots) on #4,966.80, closed on #4,988.80. On this pace, I will continue Trading Gaps only which evades me gambling on Intra-day ranging markets. Well done if you followed!'
Technical analysis: Gold has entered the #5,002.80 - #5,027.80 Profit Taking zone, which is the first one on this new Buying wave and as discussed last week, it would be optimal for Short-term Buyers to have booked Profits until #5,027.80 and re-engage only after it eventually rejects the Price-action where they can re-Buy Lower or Buy above it. After if you took the lower Buy's below the zones I mentioned (Medium-term Support cycle), the Profit is already too good to be ignored. With the Daily chart invalidated local High's and the #8-Month Low's still preserved and haven’t been rejected at on of the previous candles, current Buying sequence (this Week) resembles more and more the last strong rebound of November #24 - November #27 sequence, Selling rebound pulled back to test the Lower Low's extension #3 consecutive times before more serious recovery / so I can't ignore this possibility before we eventually hit the #5,100.80 benchmark. Gold is on strong Bullish configuration as I maintain my re-Buy strategy all along, not Trading Gaps anymore, turning to normal Trading. I expect #6,000.80 benchmark test ahead on Medium-term.
