Silver — Bearish Market Structure BreakdownCAPITALCOM:SILVER
Hello everyone here is the breakdown of the current XAGUSD SILVER setup
Silver is currently displaying a broader bearish market structure following a series of strong rejections and confirmed breakdowns at key levels. The 119 region acted as a major structural ceiling, where sellers stepped in aggressively, signalling distribution and a shift in momentum. That rejection set the tone for the downside sequence that followed.
The first meaningful confirmation of weakness came with the breakdown through 90 — a level that previously acted as a decision zone. Losing that structure indicated that buyers were no longer in control, opening the path for continuation. Price then extended lower and broke through 74, reinforcing the bearish narrative and confirming sustained selling pressure.
From a structural perspective, consecutive breakdowns like this suggest a market favouring continuation unless buyers reclaim and hold key levels. The focus now is on how price behaves below former support — whether it shows acceptance (continuation potential) or forms a base for a corrective move.
Momentum, structure, and level acceptance remain the primary factors to watch. Patience, confirmation, and disciplined risk management are essential when trading around major zones.
This is an educational market outlook based on structure and price behaviour — not financial advice. Always trade with a clear plan and defined risk.
Trend Analysis

THE KOG REPORT - UpdateEnd of day update from us here at KOG:
Yesterday we gave the hot spots and range we expected price to play in, and although we missed the lower hot spot by a few pips, we got the bounce from that region into the defence box above. We mentioned this morning that there was no break above, and due to the price action, to expect another correction during the NY session. The defence held, the bias level broke and we managed to complete all of our targets in a matter of hours.
For now, I’m expecting more of this whipsawing and the mega range but I have two key levels here. 5040-50 resistance and 4810-30 support. I would like to see a break above to confirm the target we already have for the high, however, that lower wick is concerning. Another attempt to break below 4600 could be on the cards here, so let’s monitor the price action tomorrow and wait for Excalibur and the indicators to give us the direction.
All in all, another decent day on the markets, even though staying ahead is taking a lot of effort.
From Camelot this morning:
Price: 5054
RED BOXES:
Break above 5060 for 5090. 5110 and 5140 in extension of the move
Break below 5025 for 5010✅, 4999✅, 4970✅ and 4956✅ in extension of the move
As always, trade safe.
KOG

GBPUSD Pullback into Resistance After Channel Breakdown...GBPUSD (1H), price has reacted from the demand zone and is now pulling back inside a broader bearish structure (below the descending channel + under the Ichimoku cloud). So the clean play here is a bullish pullback target into resistance:
🎯 Upside Targets (for the current bounce)
1st Target (TP1): ~1.3600
➜ Nearest horizontal resistance / prior structure support turned resistance.
2nd Target (TP2): ~1.3660 – 1.3680
➜ Strong resistance zone near the Ichimoku cloud + previous range high.
🔻 If you’re still bearish (trend continuation view)
Rejection from 1.3600–1.3680 opens continuation back toward 1.3520 → 1.3500 (demand zone lows).

GOLD(XAUUSD): New Potential Zone For Swing And Intraday Buyers! Gold fell below our previous analysis’s expectations rendering it invalid. Consequently, we’ve identified two potential zones for buyers. One is safer while the other is riskier. You can choose either or both depending on your trading strategy.
Like and comment for more! We appreciate your support and hope it continues.
Team Setupsfx_

BTC - Ultimate Swing Short Update - Next Stop 8,000Update on my BTC Ultimate Swing Short Plan:
Take Profits 1, 2 hit
Take Profit 3 approaching
Next Movement:
Straight to 8,000
No longer anticipating 3 wave corrective pattern
Happy Trading
- DD

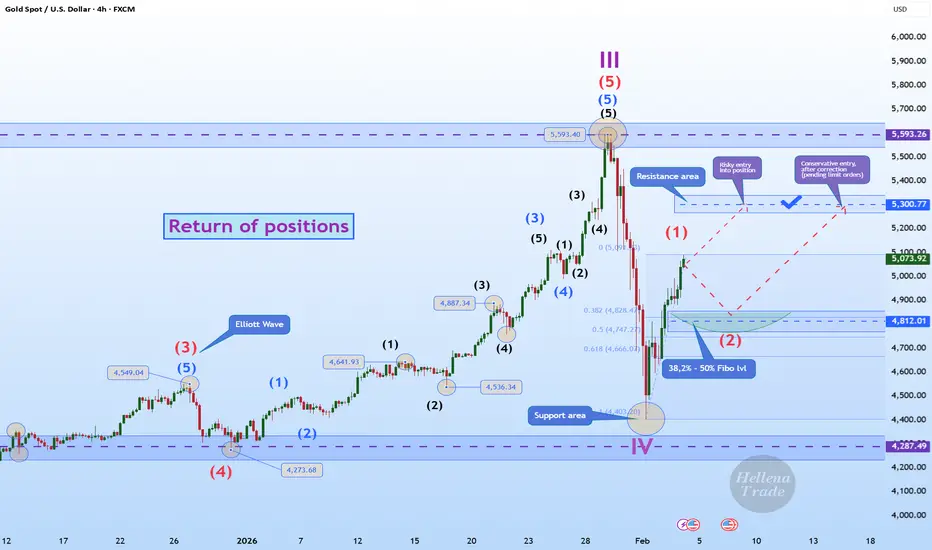
Hellena | GOLD (4H): LONG to 5300 area (Wave 3).Colleagues, the price has shown a positive upward trend, and I believe that wave “1” is either complete and wave ‘2’ correction will begin, or wave “1” will be extended.
In any case, I expect the price to reach 5300 as the nearest target. This movement after the correction will confirm the structure.
A correction in wave “2” should be expected in the range of 38.2% - 50% Fibonacci levels at 4800.
Manage your capital correctly and competently! Only enter trades based on reliable patterns!
Gold 30-Min — Volume Bullish Reversal Triggered⚡Base : Hanzo Trading Alpha Algorithm
The algorithm calculates volatility displacement vs liquidity recovery, identifying where probability meets imbalance.
It trades only where precision, volume, and manipulation intersect —only logic.
Technical Reasons
/ Direction — LONG / Reversal 4862 Area
☄️Bullish momentum confirmed through strong candle body.
☄️Structure shifted with higher-low near key demand base.
☄️Volume expanding confirms order-flow alignment upward.
☄️Buyers reclaimed imbalance with sustained clean break.
☄️Algorithm detects rising momentum under low liquidity.
⚙️ Hanzo Alpha Trading Protocol
The Alpha Candle defines the day’s real control zone — the first battle of momentum.
From this origin, the Volume Window reveals where the next precision strike begins.
⚙️ Hanzo Volume Window / Map
Window tracked from 10:30 — mapping true market behavior.
POC alignment exposes institutional bias and breakout potential zones.
⚙️ Hanzo Delta Window / Pulse
Delta window monitors real buying vs. selling power behind each move.
Tracks volume aggression to expose who controls the candle — buyers or sellers.
When Delta aligns with Volume Map, momentum becomes undeniable.

Gold at Institutional Levels — Trap or Opportunity Ahead?🟡 XAUUSD – Intraday Smart Money Plan (H1)
📈 Market Context
Gold is trading in a classic Smart Money rotation as markets digest today’s hot drivers: renewed Fed rate-cut speculation, choppy U.S. yields, and short-term USD volatility. After a strong repricing from sell-side liquidity, price is no longer trending impulsively — institutions are now engineering liquidity between premium resistance and discount demand.
With U.S. macro headlines keeping volatility elevated, expect inducements and stop-hunts around key zones rather than clean continuation.
🔎 Technical Framework – Smart Money Structure
Current Phase:
HTF structure remains constructive, while intraday flow is corrective after liquidity delivery.
Key Idea:
Sell reactions into premium or buy reloads from deep discount — only after structure confirms.
Structural Notes:
• Prior sell-side liquidity has been cleared
• Intraday CHoCH confirms corrective rotation
• Price respecting internal trend channel
• Discount demand aligns with HTF support
• Premium area capped by previous sell-high
Liquidity Zones & Trade Levels
• 🔴 SELL GOLD: 5087 – 5085 | SL: 5097
• 🟢 BUY GOLD: 4652 – 4650 | SL: 4640
Institutional Flow Expectation
Liquidity sweep → MSS / CHoCH → BOS → displacement → OB/FVG retest → expansion
Execution Rules
🔴 SELL GOLD 5087 – 5085 | SL 5097
Conditions:
✔ Price taps premium / prior sell-high
✔ Buy-side liquidity taken
✔ Bearish MSS / CHoCH on M5–M15
✔ Downside BOS confirms entry
✔ Execute via bearish OB or FVG
Targets:
• 5020 — internal reaction
• 4950 — liquidity pool
• Trail aggressively if momentum builds
🟢 BUY GOLD 4652 – 4650 | SL 4640
Conditions:
✔ Sweep into discount demand
✔ Confluence with HTF support
✔ Bullish MSS / CHoCH on M5–M15
✔ Strong upside BOS with displacement
✔ Execute via refined bullish OB
Targets:
• 4750 — first reaction
• 4890 — internal liquidity
• 5000+ — expansion if bullish flow resumes
Risk Notes
• Expect fake breaks during news
• No entry without MSS + BOS
• Reduce size at extremes
• Execution > prediction
📍 Summary
Gold is trading a Smart Money range:
• Sell premium at 5087–5085 or
• Buy deep discount at 4652–4650
📌 Follow @Ryan_TitanTrader for daily Smart Money gold breakdowns.

GOLD: Latest update 04/02/2026! Dear traders,
Our last update on gold has been successful and we’re currently up over 1968 pips. This presents a good opportunity for you all to consider a second entry as the price has corrected. It’s possible the price will reverse from the area we’ve highlighted. Please remember to manage your risk accurately when trading gold as the market conditions are extremely volatile.
Good luck and trade safely.
Team Setupsfx_

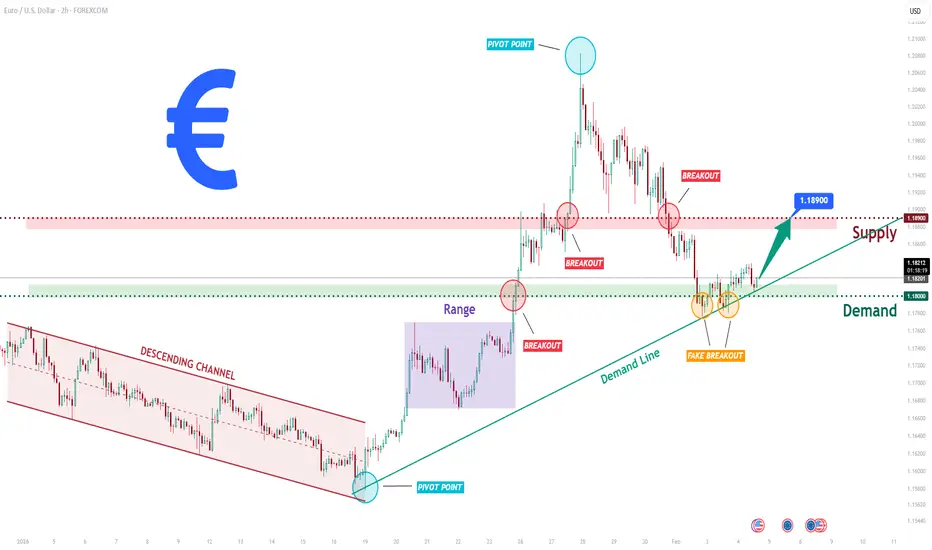
EURUSD Long: Demand Zone Holds - Bulls Preparing Next LegHello traders! Here’s a clear technical breakdown of EURUSD (2H) based on the current chart structure. EURUSD previously traded within a well-defined descending channel, where price consistently respected the descending resistance and support lines, forming a series of lower highs and lower lows. This structure confirmed sustained bearish pressure and orderly downside continuation. The bearish phase eventually reached a key pivot point, where selling momentum weakened and buyers began to step in. Following this pivot, price broke out of the descending channel and transitioned into a ranging phase, indicating temporary balance between buyers and sellers after the trend shift. This range acted as an accumulation zone before the next impulsive move. A clean bullish breakout above the range confirmed renewed buyer control and initiated a strong impulsive rally to the upside.
Currently, EURUSD is pulling back from supply and retesting the Demand Zone around 1.1800, which aligns closely with a rising demand trend line. A brief fake breakout below demand has already occurred, followed by a quick recovery back above the level — a strong sign that sellers failed to gain acceptance below support. This behavior suggests that the current pullback is corrective rather than a full trend reversal.
My primary scenario, as long as EURUSD holds above the 1.1800 Demand Zone and continues to respect the rising demand line, the bullish structure remains intact. A sustained reaction from this area could lead to a renewed upside move, targeting a retest of the 1.1890 Supply Zone (TP1). A clean breakout and acceptance above supply would confirm bullish continuation and open the door for further upside expansion. However, a decisive breakdown and acceptance below the demand zone and trend line would invalidate the bullish scenario and signal a deeper corrective phase. For now, structure, trend, and price behavior continue to favor buyers, with demand acting as the key battlefield. Manage your risk!
BTC is really bearish (3D)We are working extremely hard to provide timely updates and accurate market analysis. You might be wondering why the price ranges keep changing frequently. The reason is simple: our primary goal is to protect our users from potential losses and liquidation risks. In a volatile market like this, it’s crucial to adjust levels dynamically to reflect the latest price action and market sentiment.
For this current bearish wave, the primary target is the green zone. This is the area where we expect the downward momentum to pause or consolidate temporarily. Traders should watch this zone closely, as it represents a key support level in the short term.
Once the price reaches the green zone, we anticipate a rebound that could take the market up to the red box. This retracement provides a potential opportunity for strategic entries or partial profit-taking before the market resumes its main downward move.
After this retracement, the expectation is that the main drop will continue, following the overall bearish trend. For those trading Bitcoin, it’s important to align your trades according to this structure: monitor the green zone for support, watch for a corrective rebound to the red box, and prepare for the subsequent drop.
Remember, in volatile markets, staying flexible and adjusting your positions according to updated ranges is essential for risk management. By following this framework, you can optimize your trade entries and exits while minimizing exposure to unnecessary losses.
If you have a coin or altcoin you want analyzed, first hit the like button and then comment its name so I can review it for you.
This is not a trade setup, as it has no precise stop-loss, stop, or target. I do not publish my trade setups here.

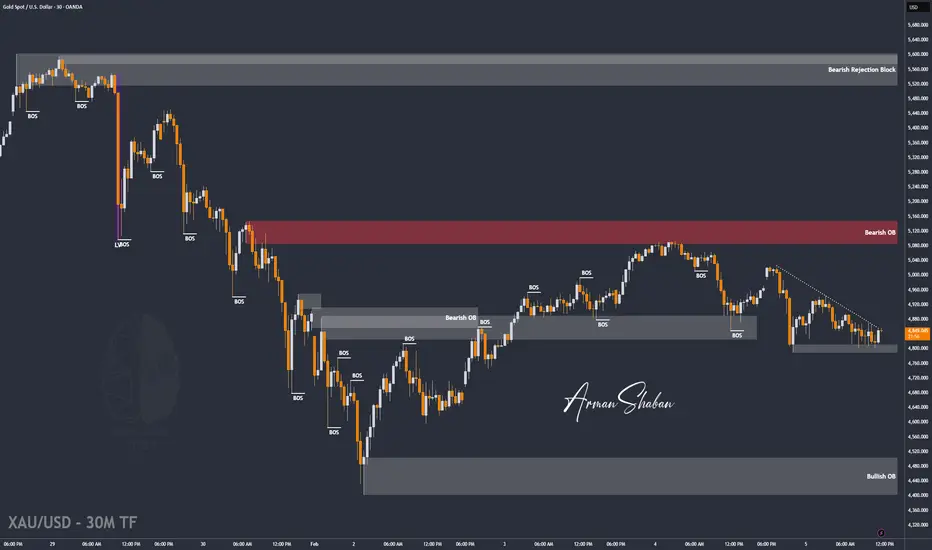
XAU/USD | Gold Short-Term Bounce After Liquidity Grab!By analyzing the #Gold chart on the 30-minute timeframe, we can see that after our previous analysis, price moved exactly as expected and first corrected down to $4,790. After reaching this key level and sweeping the liquidity below it, gold turned bullish again and is now trading around $4,850.
If price can stabilize above $4,839, we can expect further upside in gold. The next potential targets for this move are $4,876 and $4,913.
Please support me with your likes and comments to motivate me to share more analysis with you and share your opinion about the possible trend of this chart with me !
Best Regards , Arman Shaban
AUDUSD Rally Into Sell Zone | Strong Dollar Theme Returns!Hey Traders,
In today’s trading session we are monitoring AUDUSD for a potential selling opportunity around the 0.70200 zone.
AUDUSD remains in a clear downtrend and is currently in a corrective pullback, approaching a confluence resistance area near 0.70200, where the descending trendline aligns with a key support-turned-resistance zone. This area could act as a sell-the-rally level if bearish momentum returns.
From a fundamental perspective, the recent Fed Chair nomination of Kevin Warsh is viewed as hawkish, which may support short-term USD strength. A stronger dollar typically pressures risk currencies like the Australian dollar, adding fundamental confluence to the bearish technical outlook.
As always, wait for confirmation and manage risk.
Trade safe,
Joe.

Technical Rebound or Failed Reversal?After a very sharp bounce from the recent short-term low, gold prices weakened again almost immediately, suggesting that the recovery lacked sufficient foundation to sustain itself. On the H4 timeframe, price is now hovering around the medium-term EMA — a familiar post-volatility condition that often reflects a phase of supply–demand rebalancing.
Technical perspective
From a structural standpoint, the latest upswing looks far more like a technical rebound than the beginning of a new trend. Price failed to break decisively above the overhead EMA cluster, and each approach into resistance was followed by a swift loss of upside momentum.
More importantly, volume tapered off during the rebound, highlighting the absence of strong participation from larger players and signaling that buyers were not willing to chase price at higher levels. In this context, short-term profit-taking pressure continues to dominate.
Given the current setup, a broader consolidation or corrective phase carries a higher probability than an immediate, sustainable upside continuation.
Macro perspective
From a medium- to long-term view, gold’s fundamental drivers remain intact. Deutsche Bank continues to emphasize gold’s role as a defensive asset, supported by prolonged geopolitical uncertainty and ongoing currency depreciation pressures across several major economies.
That said, Bloomberg Intelligence has issued a notable caution: the strong rally earlier in the year pushed gold into overbought territory. A deeper correction — potentially even toward the 4,000 USD/oz area — remains a realistic scenario if global financial conditions stabilize and investor risk appetite improves meaningfully.
U.S. data & monetary policy
Recent U.S. economic data suggest that the labor market is gradually cooling, reinforcing expectations that the Federal Reserve could move toward policy easing in the second half of the year. However, at this stage, that supportive backdrop is not yet strong enough to offset the short-term technical correction pressures currently driving price action.

US100 Price Update – Clean & Clear ExplanationUS100 is currently trading under strong selling pressure after failing to sustain above the ascending trendline and the previous supply zone around 25,700–25,900. The sharp rejection from this area confirms that sellers remain in control.
Price has now broken below key structure support near 25,200–25,000, signalling a bearish continuation rather than a simple pullback. The recent impulsive bearish candle shows strong momentum, suggesting that any short-term bounce could be corrective.
As long as price remains below 25,700, the bias stays bearish. A short-term retracement toward 25,300–25,500 could offer selling opportunities, followed by a continuation lower toward 24,500. Only a strong reclaim above the broken trendline would invalidate this bearish scenario.
“If you come across this post, please like, comment, and share. Thanks!”

Gold Holds Demand - Long Scenario After Correction Toward $5,180Hello traders! Here’s my technical outlook on XAUUSD (1H) based on the current chart structure. Gold initially traded within a well-defined range, indicating a period of accumulation and market balance. This consolidation eventually resolved to the upside, leading to a strong impulsive move and confirming bullish intent. Following the breakout, price respected a clean ascending channel, forming higher highs and higher lows. Multiple bullish breakouts along the structure confirmed sustained buyer control. However, after reaching the Resistance / Seller Zone around 5,180–5,200, bullish momentum weakened, and price faced strong rejection, resulting in a sharp corrective drop. This pullback drove price into a major Buyer Zone around 4,880–4,925, which aligns with a key horizontal support level and a previous breakout area. Price briefly dipped below this zone but quickly reclaimed it, forming a fake breakdown — a strong sign of seller exhaustion and buyer defense at demand. Currently, XAUUSD is stabilizing above the Buyer Zone, suggesting the correction may be complete. As long as price holds above this demand area, the structure favors a long scenario on pullbacks rather than continuation to the downside. A healthy retracement and consolidation within or just above the Buyer Zone could provide a favorable long opportunity. Bullish confirmation from this area increases the probability of a continuation move toward the 5,180 Resistance / Seller Zone (TP1). This level represents the first major upside target and an area where partial profits can be considered. If bullish momentum strengthens and price breaks above the Seller Zone with acceptance, the move could extend further toward higher resistance levels, confirming trend continuation. The long scenario remains valid as long as price holds above the Buyer Zone and avoids acceptance below support. A decisive breakdown and acceptance below the Buyer Zone would invalidate the long bias and shift focus back toward bearish continuation. Until that happens, Gold remains positioned for a bullish recovery from demand within the broader market structure. Please share this idea with your friends and click Boost 🚀

Bitcoin Breaks Major Support — Extreme Fear or Another Leg Down?Bitcoin ( BINANCE:BTCUSDT ), as I highlighted in my previous weekly idea , started its decline. The drop came with higher momentum than expected, surprising many, and it successfully broke the heavy support zone($78,260-$64,850).
Now, here are the fundamental reasons for Bitcoin’s movement in the last 24-48 hours, as well as the general context:
•Global Risk-Off Sentiment: Investors moved away from high-risk assets as global equity markets—especially tech stocks—came under heavy selling pressure.
•Lack of Strong Spot Demand: There was no meaningful inflow of fresh capital to absorb selling pressure at key support levels.
•Institutional Pressure & Unrealized Losses: Large BTC holders and public companies with Bitcoin on their balance sheets reported increased unrealized losses, weakening market confidence.
•Correlation With Traditional Markets: Bitcoin continued to trade as a risk asset, following the downside momentum of global financial markets.
•Forced Liquidations: High leverage across the market led to cascading liquidations, accelerating the downside move.
Bitcoin Fear & Greed Index is currently at 9 — marked as “Extreme Fear”.
This is the lowest reading since June 2022, when the market sentiment collapsed following major events like the Terra crash.
Historically, when the Fear & Greed Index dropped this low, Bitcoin experienced prolonged selling pressure and volatility, followed by eventual stabilization as fear subsided. Extreme Fear readings often coincide with market bottoms or oversold conditions, but they do not guarantee an immediate price reversal.
In short: Extreme fear can signal that market participants are overly pessimistic — possibly a contrarian buying environment — but confirmation from price action and other indicators is crucial before assuming a trend reversal.
Now, let’s take a quick look at Bitcoin’s 4-hour chart to assess the current situation.
It appears that Bitcoin, given its momentum, has successfully broken the heavy support zone($78,260-$64,850) and is currently pulling back toward that zone.
From an Elliott Wave perspective, it seems we are in the final stages of the main wave 4. After this pullback near Fibonacci levels, we anticipate another decline. Since the drop’s momentum has been strong, wave 5 could potentially be truncated.
I expect Bitcoin to resume its drop from one of the Fibonacci levels or Cumulative Short Liquidation Leverage($68,900-$67,200), targeting at least $64,123.
First Target: $64,123
Second Target: $62,103
Stop Loss(SL): $72,033
Points may shift as the market evolves
Cumulative Long Liquidation Leverage: $60,000-$58,000
CME Gap: $84,560-$79,660
CME Gap: $54,545-$52,980
💡 Please respect each other's opinions and express agreement or disagreement politely.
📌Bitcoin Analysis (BTCUSDT), 4-hour time frame.
🛑 Always set a Stop Loss(SL) for every position you open.
✅ This is just my idea; I’d love to see your thoughts too!
🔥 If you find it helpful, please BOOST this post and share it with your friends.

Gold Breakout and Potential Retrace! Hey Traders, in today's trading session we are monitoring GOLD for a selling opportunity around 4,980 zone, Gold was trading in an uptrend and successfully managed to break it out. Currently is in a correction phase in which it is approaching the retrace area at 4,980 support and resistance area.
Trade safe, Joe.

Selena | XAUUSD – 1H – Short-Term Corrective StructurePEPPERSTONE:XAUUSD FOREXCOM:XAUUSD
Following the strong sell-off from the highs, XAUUSD formed a base near the 4400 liquidity zone, triggering a corrective bullish move. Price is now moving in a rising channel but remains below the higher-timeframe resistance and prior supply. As long as price holds above intraday demand, continuation toward the upper channel and resistance zone remains valid. However, rejection from supply could lead to another pullback within the range.
Key Scenarios
✅ Bullish Case 🚀 →
Sustained support above 4850–4900 keeps the bullish correction active.
🎯 Target 1: 5050 – 5100
🎯 Target 2: 5200 – 5300 (Channel Resistance)
❌ Bearish Case 📉 →
Failure to hold 4850 would weaken structure.
🎯 Downside Target 1: 4700
🎯 Downside Target 2: 4500 – 4400 (Major Demand)
Current Levels to Watch
Resistance 🔴: 5050 – 5100 / 5200 – 5300
Support 🟢: 4900 / 4500 – 4400
⚠️ Disclaimer: This analysis is for educational purposes only. Not financial advice.

BITCOIN hit $60k and is -50% from ATH. Did it crash too soon??Bitcoin (BTCUSD) almost hit the $60000 mark in early session today, which represents a more than -50% crash from its October 2025 $126000 All Time High (ATH).
** Is it happening too soon? **
Given that we haven't even completed 4 months since the ATH, the question that arises is this: Is this crash happening too soon??
Short answer: YES. And the reason is simple and has to do with the market's macro technicals. Today's $60k Low isn't just a -50% drop from the ATH but it is also taking place extremely close to its 1W MA200 (orange trend-line), while the 1W RSI turned oversold (below 30.00). All this just the second week after losing the 1W MA100 (green trend-line), which has been holding as the Support in almost the past 3 months of the 1W MA50 - 1W MA100 consolidation Rectangle.
** The 1W MA200 and oversold RSI **
That consolidation Rectangle has always served as the pattern that transitioned BTC from its early to the final stage of its Bear Cycle. However this is the soonest occasion historically that Bitcoin reaches its 1W MA200 from an ATH. On the 2014 Bear Cycle it took 59 weeks to do so, on the 2018 Bear Cycle 51 weeks (both were Cycle bottoms), on the 2022 Cycle almost half the time, 31 weeks not a Cycle bottom) and now we are 'just' 17 weeks (119 days) after. Needless to say, it is also the soonest it hit an oversold 1W RSI state, something that has historically coincided with a 1W MA200 test, so that's consistent.
** So what now? **
So what does this historically earliest crash mean for us today? Well most likely that we still have a long way to go. Given this aggressive drop, the market should continue to test at least the 1W MA350 (red trend-line), which is where the previous Bear Cycle bottomed in November 2022 (took almost as much time as the 1W MA50 - 1W MA100 consolidation Rectangle did from he moment the 1W MA200 broke) and we expect that to be around $48000 by May - June 2026.
However, based on the 4-year Cycle Theory, the Bear Cycle bottom should be around late September- October 2026. So practically the bottom could be even lower (potentially the 1W MA500 even as we presented on an analysis last month).
So what do you think? Is the fact that BTC crashed too soon to its 1W MA200 alarming? Feel free to let us know in the comments section below!
---
** Please LIKE 👍, FOLLOW ✅, SHARE 🙌 and COMMENT ✍ if you enjoy this idea! Also share your ideas and charts in the comments section below! This is best way to keep it relevant, support us, keep the content here free and allow the idea to reach as many people as possible. **
---
💸💸💸💸💸💸
👇 👇 👇 👇 👇 👇

USDJPY 30Min Engaged ( Bearish Reversal Entry Detected )⚡Base : Hanzo Trading Alpha Algorithm
The algorithm calculates volatility displacement vs liquidity recovery, identifying where probability meets imbalance.
It trades only where precision, volume, and manipulation intersect —only logic.
✈️ Technical Reasons
/ Direction — SHORT / Reversal 156.640 Area
☄️Bearish rejection confirmed through sharp candle body.
☄️Lower-high forming beneath resistance supply region.
☄️Volume decreasing confirms exhaustion in price rally.
☄️Sellers regained imbalance with heavy top rejection.
☄️Algorithm detects fading demand and shift to control.
⚙️ Hanzo Alpha Trading Protocol
The Alpha Candle defines the day’s real control zone — the first battle of momentum.
From this origin, the Volume Window reveals where the next precision strike begins.
⚙️ Hanzo Volume Window / Map
Window tracked from 10:30 — mapping true market behavior.
POC alignment exposes institutional bias and breakout potential zones.
⚙️ Hanzo Delta Window / Pulse
Delta window monitors real buying vs. selling power behind each move.
Tracks volume aggression to expose who controls the candle — buyers or sellers.
When Delta aligns with Volume Map, momentum becomes undeniable.

Is the Rally Just for Selling? A Bearish Scenario for XAGUSDXAGUSD is currently showing that a short-term bearish trend is clearly dominating, as both news-driven factors and technical structure fail to support a sustainable bullish reversal. The broader macro backdrop continues to favor the U.S. dollar, with U.S. Treasury yields remaining elevated and expectations that the Fed will not ease policy anytime soon , keeping capital flows cautious toward precious metals such as silver.
On the H4 timeframe, after a sharp sell-off that decisively broke the prior bullish structure , the current price action appears to be nothing more than a technical rebound. XAGUSD remains below the Ichimoku cloud, signaling that short- to medium-term control is still firmly in the hands of sellers , and that the recovery lacks the strength required to shift overall market conditions.
The 98.0–98.5 zone is now acting as a key resistance area. This zone previously served as support and has since flipped into resistance, reinforcing its technical significance. Repeated rejection from this area would further validate the bearish continuation scenario.
If XAGUSD fails to break and hold above this resistance , the higher-probability outcome is a renewed move lower, with an initial target near 80, followed by a deeper decline toward the 75.6 support zone. In the current environment, the most rational strategy remains selling rallies in line with the trend , rather than attempting to catch bottoms against prevailing momentum.

Gold Trades the Extremes as News Fuels Liquidity Games🟡 XAUUSD – Intraday Smart Money Plan (H1)
📈 Market Context
Gold remains highly sensitive today as markets react to President Trump’s announcement, keeping USD flows unstable and risk sentiment mixed. This environment favors liquidity engineering, not trend chasing. Institutions are exploiting news-driven emotions to distribute at premium and accumulate at discount.
With volatility elevated, expect false breaks, inducements, and stop hunts around key levels rather than clean directional moves.
🔎 Smart Money Technical Read
Current State:
Price is trading inside a managed range after a buy-side liquidity grab. Intraday structure shows distribution from premium, while downside moves are corrective rather than impulsive.
Core Idea:
Let price come to Smart Money — sell premium or buy deep discount only after confirmation.
Structure Observations:
• Buy-side liquidity already delivered
• Multiple CHoCH signals confirm corrective flow
• Price respecting descending internal channel
• Discount aligns with prior sell-side liquidity
• Premium capped by institutional supply & imbalance
Liquidity Zones & Key Levels
• 🔴 SELL GOLD: 5,020 – 5,060
• 🟢 BUY GOLD: 4,720 – 4,760
🧠 Institutional Expectation
Inducement → Liquidity sweep → CHoCH / MSS → BOS → displacement → OB / FVG entry → expansion
🔴 SELL Scenario — Premium Distribution
Sell Zone: 5,020 – 5,060
Conditions:
✔ Price taps premium / prior sell-high
✔ News-driven push into resistance
✔ Bearish CHoCH or MSS on M5–M15
✔ Downside BOS confirms intent
✔ Entry via bearish OB or FVG
Targets:
• 4,950 — internal reaction
• 4,820 — range low
• Trail if momentum expands
🟢 BUY Scenario — Discount Accumulation
Buy Zone: 4,720 – 4,760
Conditions:
✔ Sweep below sell-side liquidity
✔ Discount relative to HTF range
✔ Bullish CHoCH / MSS on LTF
✔ Strong displacement confirms buyers
✔ Entry from refined bullish OB
Targets:
• 4,850 — first reaction
• 4,980 — internal liquidity
• 5,050+ — if expansion resumes
⚠️ Risk Notes
• Expect fake breakouts during headlines
• No trade without structure confirmation
• Reduce size near news spikes
• Patience > prediction
📍 Summary
Gold is a Smart Money range play today:
• Sell strength at premium
• Buy weakness only at deep discount
📌 Follow @Ryan_TitanTrader for daily Smart Money gold breakdowns.
