Trend Analysis
NIFTY IT Index | Weekly | Structural Assessment | 16 Feb 2026🧭 Description
Structural assessment of NIFTY IT Index (CNXIT) on the Weekly timeframe (Log Scale).
📊 Regime: Range within broader long-term uptrend
🔄 Current Phase: Structural Compression
📍 Structural Pivot: 35,500–36,000
🌍 Context: Multi-year consolidation between 26,000–46,000
Price remains inside the established consolidation band.
Break above 46,000 → Structural expansion phase possible
Sustained acceptance below 26,000 → Structure reset condition
Until range boundaries are resolved, CNXIT remains in compression mode.
This is a structural study, not a directional forecast.
No targets. No predictions.
⚠️ Disclaimer
Educational content only. Not investment advice.
#MarketStructure #StructureFirst #NIFTYIT #LongTermView
Asian session: Firmly maintain a buy-on-dips strategy!
Gold opened at around 5035 today, touched a low of 5000, and rebounded. This movement validates my weekend strategy of buying on dips. We continue to maintain this strategy, but it's crucial to have a safety net to protect against unexpected market movements. Looking at the daily chart, Friday's long bullish candle with a slight lower wick indicates a return to bullish momentum, with various indicators showing signs of turning upwards. Our strategy remains to buy on dips, focusing on short-term support around the 5000 level, and specifically looking for support around 4960-65. Those interested in gold but unsure where to start or experiencing trading difficulties can leave a message to discuss and exchange ideas.
From the 4-hour chart, watch for short-term resistance at 5083-5100 and support at 4960-4965. Continue to trade within this range, prioritizing a conservative approach. Specific trading strategies will be provided during the trading session; please pay close attention. Gold Trading Strategy: Buy gold on a pullback to the 4993-5000 level, add to the long position on a pullback to the 4960-4966 level, with a target of 5080-5100. Hold the position if the price breaks through.
USDCAD: Still Bearish. Look For Valid Sell Setups!Welcome back to the Weekly Forex Forecast for the week of Feb. 16-20th.
In this video, we will analyze the following FX market: USDCAD
USDCAD is bearish, but a bit rangy. The weekly candle close within above the low of the previous candle, indicating consolidation... or spicey bulls trying to push price up.
Look for the bearish OB that price is currently mitigating to hold, and give us a sell model for entry.
If the -OB fails, look for price to rally in the short term to reach the larger -FVG above. From there, we will again look for a sell model to form.
There is no good reason to buy this market, as there is no bullish BOS as yet.
Enjoy!
May profits be upon you.
Leave any questions or comments in the comment section.
I appreciate any feedback from my viewers!
Like and/or subscribe if you want more accurate analysis.
Thank you so much
Disclaimer:
I do not provide personal investment advice and I am not a qualified licensed investment advisor.
All information found here, including any ideas, opinions, views, predictions, forecasts, commentaries, suggestions, expressed or implied herein, are for informational, entertainment or educational purposes only and should not be construed as personal investment advice. While the information provided is believed to be accurate, it may include errors or inaccuracies.
I will not and cannot be held liable for any actions you take as a result of anything you read here.
Conduct your own due diligence, or consult a licensed financial advisor or broker before making any and all investment decisions. Any investments, trades, speculations, or decisions made on the basis of any information found on this channel, expressed or implied herein, are committed at your own risk, financial or otherwise.
Long trade
🟣 SOLUSDT — Sentiment & News Context
Trade: Buy-side
Date: Mon 16th Feb 2026
Session: London PM (NY 6:30 pm)
Entry: 86.12
TP: 91.27
SL: 85.51
RR: 8.44
🧠 Higher Timeframe Context (1D)
Price has retraced into a major historical support zone (≈85–88).
This level aligns with:
Prior breakout base
Mid-range equilibrium
Psychological round number support
The reaction is occurring after an extended corrective leg from the 2025 highs.
🔍 Liquidity Narrative
Downside liquidity below recent equal lows has been partially cleared.
Price is sitting in a decision zone.
If 85 holds → short-term upside liquidity draw toward 91–95.
If 85 fails → next liquidity pocket sits lower (70–75 region).
While no single catalyst appears dominant on this date, broader themes influencing SOL:
Ethereum ETF narrative & L1 competition. Any positive sentiment around ETH scaling or ETF developments tends to lift high-beta L1S like SOL.
Summary
This is a reactionary buy-side trade at HTF support, not a confirmed trend reversal.
Daily market structure - AnalysisWe had a very strong, parabolic move to the upside. However, the price hit a major high and rejected hard.
Key Observation: We have now broken two significant higher lows.
Analysis: This sharp break of market structure suggests the aggressive buying is over for now.
Wait for: I am looking for a lower high or a retest of the broken levels before deciding on my next move.
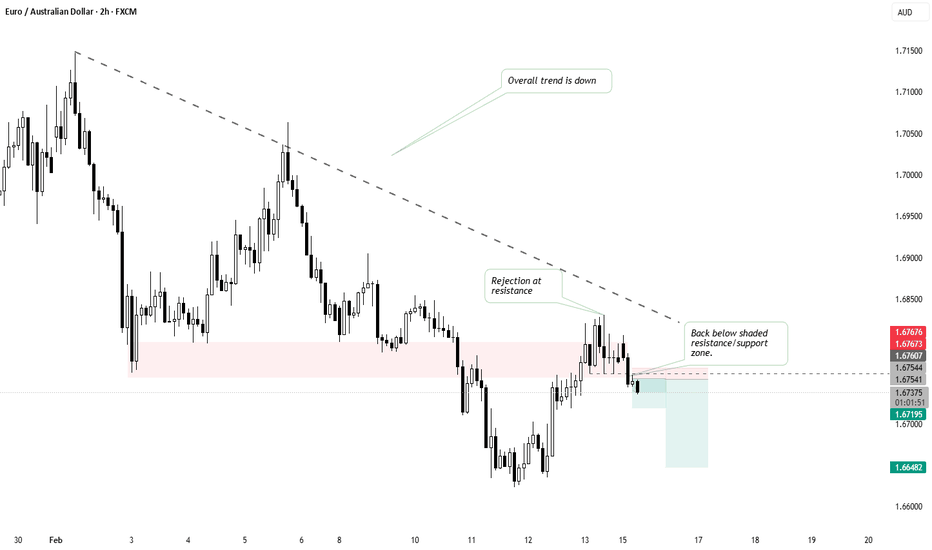
Trade 1: Shorted EURAUD Starting a series of trade setups. First simple setup following main bearish trend on daily chart. Confirmation happened on lower time frames as shown on chart. Looking for two targets outlined on chart. Average RR for the trade is appx. 5.32. Let's see how this trade goes. Follow my trading journal.
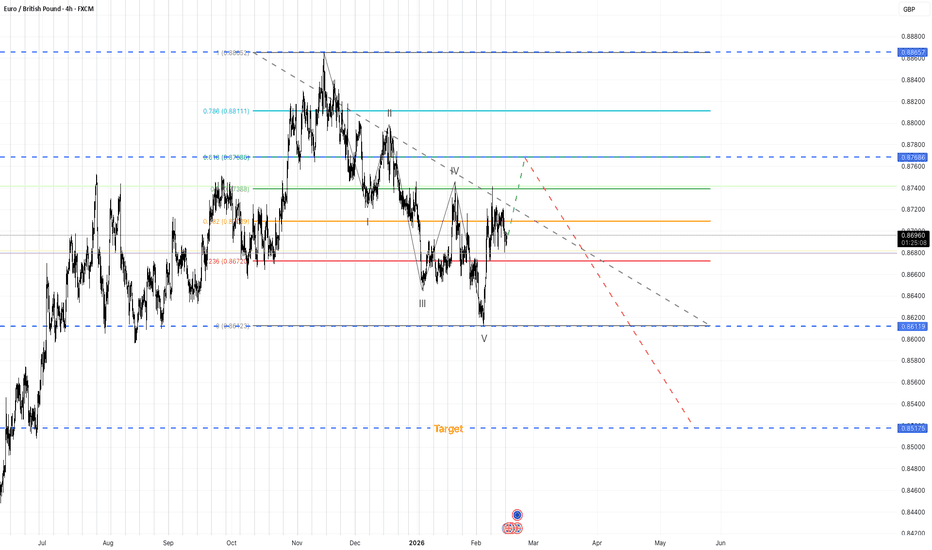
EURGBP 4H - Correction to 61.8%, then lower1) 📌 Context
On the 4H chart, EURGBP printed a 5-wave decline from 0.88657 → 0.86119. The internal shape looks consistent with a leading diagonal (a common “first move” structure).
2) 🌀 Structure (Elliott Wave read)
• Down move: 5-wave structure (likely leading diagonal)
• Current phase: upward correction (bounce / consolidation before trend continuation)
3) 📐 Why I think the correction isn’t finished
Yes, price already reacted near the 50% Fibonacci and the wave 4 area, which can sometimes complete a correction.
However, the current sideways behavior doesn’t look like a clean bearish continuation — it suggests the correction may extend higher.
➡️ My preferred zone is 0.87686 (≈ 61.8% retracement) 🎯
4) 🎯 Trade idea
• Bias: Short (after the correction completes)
• Plan: wait for price to reach / react around 0.87686, then look for rejection + bearish confirmation to consider shorts.
5) Target
• 🎯 Target: 0.85175
6) Invalidation / caution ❌
If price breaks and holds above the correction zone (and structure changes), the bearish scenario becomes less likely.
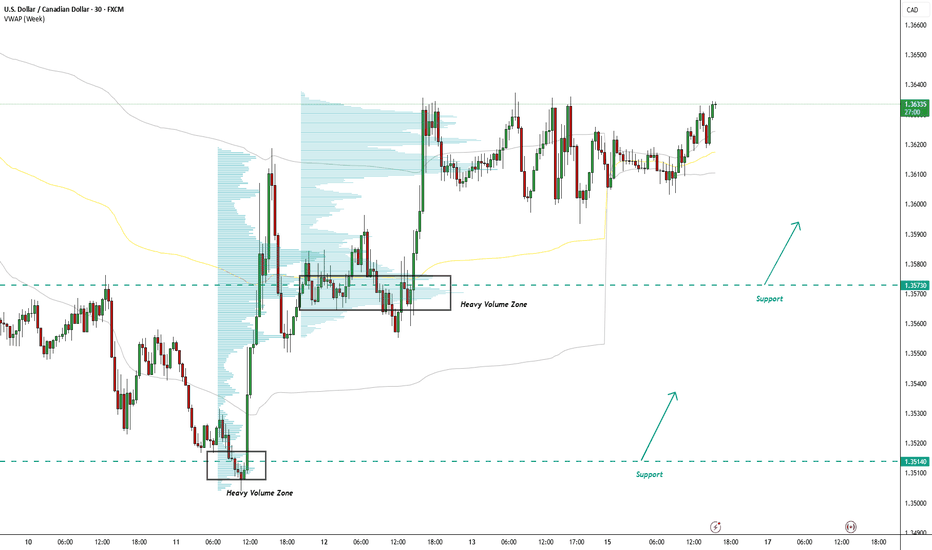
USD/CAD Pullback Setup: Two Strong Support LevelsOn the USD/CAD 30-minute chart, two support levels stand out based on strong buyer activity and volume clusters. The first level (1.3573) is built on a heavy Volume Profile node and aligns with the start of a Fair Value Gap. The second level (1.3514) comes from a sharp rejection and trend reversal area with a smaller volume cluster. Both zones are pullback areas where buyers may defend and react again.
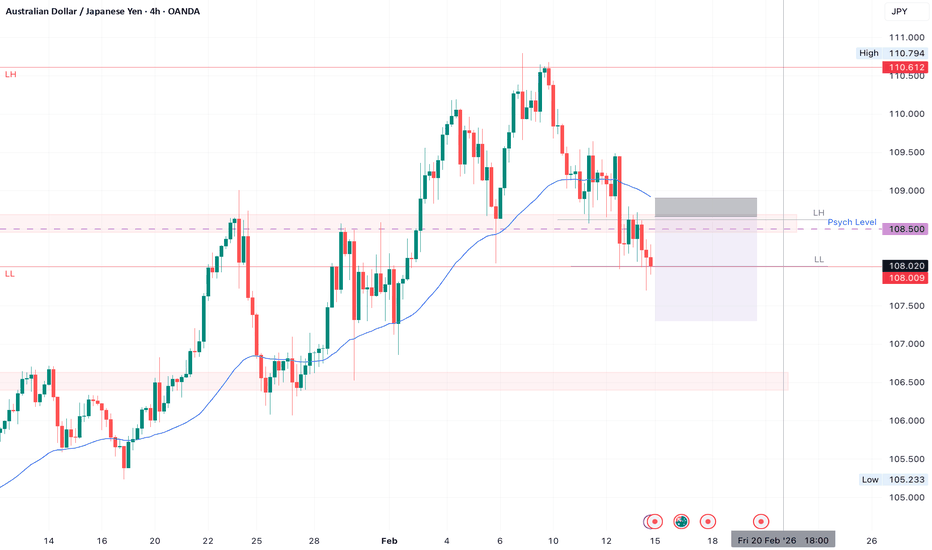
AUDJPY SHORT Market structure bearish on HTFs DH
Entry at Daily AOi
Weekly rejection at AOi
Daily Rejection at AOi
Previous Daily Structure Point
Around Pyschological Level 108.500
Touching EMA H4
H4 Candlestick rejection
Rejection from Previous structure
TP: WHO KNOWS!
Entry 90% TPT 95%
REMEMBER : Trading is a Game Of Probability
: Manage Your Risk
: Be Patient
: Every Moment Is Unique
: Rinse, Wash, Repeat!
: Christ is King.
GOLD Is Bearish! Sell!
Please, check our technical outlook for GOLD.
Time Frame: 1h
Current Trend: Bearish
Sentiment: Overbought (based on 7-period RSI)
Forecast: Bearish
The market is approaching a key horizontal level 4,993.27.
Considering the today's price action, probabilities will be high to see a movement to 4,995.52.
P.S
The term oversold refers to a condition where an asset has traded lower in price and has the potential for a price bounce.
Overbought refers to market scenarios where the instrument is traded considerably higher than its fair value. Overvaluation is caused by market sentiments when there is positive news.
Like and subscribe and comment my ideas if you enjoy them!
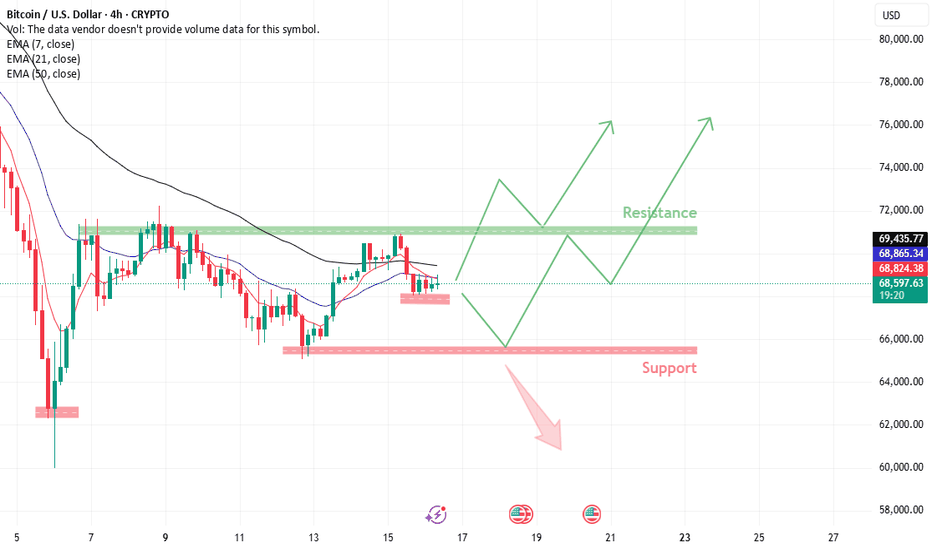
BTCUSD (4H) – Bullish Above SupportBTCUSD (4H) – Bullish Above Support
Price is trading around 68,590, holding above the key support zone near 65,500–66,000. Structure shows higher lows forming from support, suggesting buyers are defending the area.
Bullish scenario:
As long as price holds above 65,500–66,000, bullish momentum can build. A breakout above the 71,000–72,000 resistance zone would confirm upside continuation toward higher levels.
Bearish risk:
A clear 4H close below 65,500 would weaken the structure and expose deeper downside.
Summary:
Above support = bullish bias
Break resistance = continuation higher
Below support = bearish shift
Educational purpose only.
SOLUSD (4H) – Breakout Levels & StructureSOLUSD (4H) – Breakout Levels & Structure
Price is trading around 85.18, consolidating between key support and resistance zones.
Resistance: ~86.20–92.00
Previous rejection zone and supply area.
S1 Support: ~83.50–84.00
Short-term demand holding current pullback.
Main Support: ~76.00–78.00
Major higher timeframe support.
Bullish Scenario:
As long as price holds above 83.50–84.00, structure remains constructive.
A strong 4H close above 86.20 would confirm breakout and open upside toward 92.00 and higher.
Bearish Scenario:
Break and hold below 83.50 would shift momentum bearish, exposing 76.00–78.00 main support.
Summary:
Above support = bullish bias
Break resistance = upside continuation
Below support = bearish move toward main support
Educational purpose only.
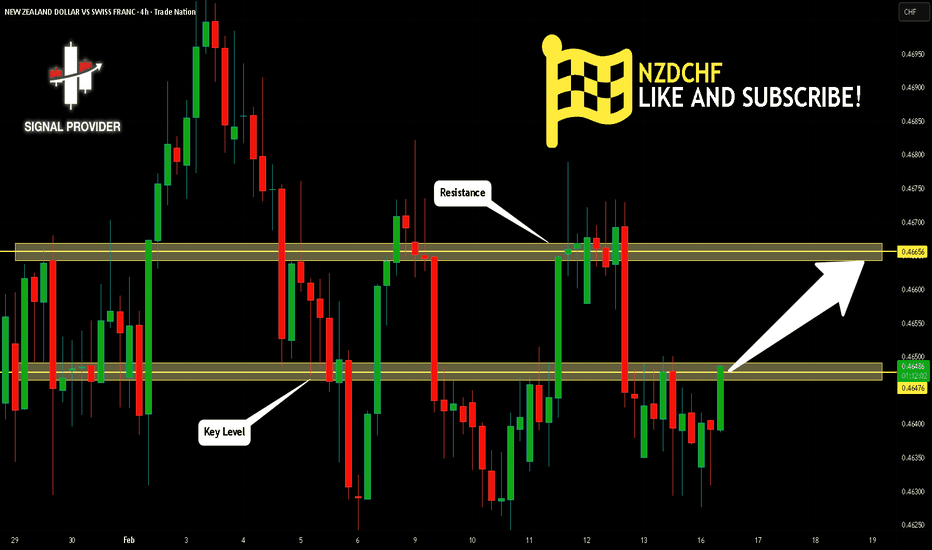
NZDCHF Is Bullish! Buy!
Here is our detailed technical review for NZDCHF.
Time Frame: 4h
Current Trend: Bullish
Sentiment: Oversold (based on 7-period RSI)
Forecast: Bullish
The market is approaching a significant support area 0.464.
The underlined horizontal cluster clearly indicates a highly probable bullish movement with target 0.466 level.
P.S
We determine oversold/overbought condition with RSI indicator.
When it drops below 30 - the market is considered to be oversold.
When it bounces above 70 - the market is considered to be overbought.
Like and subscribe and comment my ideas if you enjoy them!
AUDNZD Is Very Bearish! Short!
Take a look at our analysis for AUDNZD.
Time Frame: 1h
Current Trend: Bearish
Sentiment: Overbought (based on 7-period RSI)
Forecast: Bearish
The market is on a crucial zone of supply 1.173.
The above-mentioned technicals clearly indicate the dominance of sellers on the market. I recommend shorting the instrument, aiming at 1.171 level.
P.S
Overbought describes a period of time where there has been a significant and consistent upward move in price over a period of time without much pullback.
Like and subscribe and comment my ideas if you enjoy them!
EURJPY Looking For BreakoutEURJPY is currently compressing inside a clear descending wedge structure after an extended bearish move, signaling momentum exhaustion and increasing probability of a bullish breakout, especially as price continues to respect higher lows near the rising trendline while sellers fail to push below recent demand. The market is coiling just below intraday equilibrium, and a confirmed break above wedge resistance would likely trigger stop hunts and momentum buying toward the higher timeframe supply zone, aligning with a classic volatility expansion setup. From a fundamentals standpoint as of 16 Feb 2026, the euro remains relatively supported by stabilizing Eurozone growth expectations and reduced recession fears, while the yen continues to weaken structurally due to persistent policy divergence, ultra-loose Bank of Japan stance, and ongoing yield differentials favoring carry trades. Risk sentiment remains constructive, limiting safe-haven demand for JPY, which further supports upside potential in EURJPY. Technically and fundamentally, the pair favors a buy-the-breakout or buy-the-dip narrative as long as price holds above wedge support, with bullish continuation driven by liquidity imbalance, trend reversal signals, and sustained carry trade flows.
Gold – Consolidation Potential - Volatility Remains ChallengingGold volatility may have eased in the last week when judged by the levels of movement at the start of February, however prices are still relatively wild and can catch out those traders who haven’t prepared carefully in advance. For example, Monday February 9th saw Gold open at 4990 and steadily climb up to a high of 5119 on Wednesday, then prices collapsed 3.2% on Thursday down to a low of 4879, before spiking 2.46% on Friday to close at 5042, which was an eventual weekly gain of 1%. It’s a challenging environment for sure!
The current backdrop may remain constructive for Gold, with Asian central bank demand remaining on dips, as well as market expectations for a minimum of 2 Federal Reserve interest rate cuts across 2026 reinforced by Friday’s weaker than expect US CPI release, a move which typically provides support for non-yielding precious metal.
However, it also seems traders may be reluctant to attempt buying at higher levels for the time being after being scared by the drop from all-time highs at 5598 seen on January 29th down to the lows at 4403 on February 2nd. This could mean a period of consolidation may be due, especially with Chinese markets closed all week for the Lunar New Year. Chinese investors have been extremely active across all precious metals markets to start 2026.
That said, Gold traders may want to stay on alert this week, with several potential volatility catalysts on the horizon. Geopolitical tensions between the US and Iran remain a key wildcard, particularly with Washington maintaining a significant military presence in the region and diplomatic talks between the two nations set to resume on Tuesday. At the same time, macro risks could intensify with the release of the Fed’s January policy meeting minutes (Wednesday 19:00 GMT), followed by the Fed’s preferred inflation measure, the PCE Index (Friday 13:30 GMT). Together, these developments could prove pivotal in shaping near-term direction and volatility for Gold prices across the week.
Technical Update: Steady Recovery From 4425 Support Positive?
Gold has stabilised after its 21% liquidation from the January 29th all‑time high at 5598, with the 50% Fibonacci retracement at 4425 holding to form a steady recovery. The key question now is whether this is merely a reactive bounce before the resumption of a broader move back to the downside, the early stages of renewed positive momentum capable of resuming the long‑term uptrend, or a period of price consolidation between the key support and resistance levels.
While it’s impossible to know the next directional themes with absolute certainty, mapping key support and resistance levels can help to frame the current Gold recovery. These reference points could offer a clearer read on whether price action is leading to a more sustained rebound, a temporary reaction within the broader late‑January decline, or a more extended consolidation in price.
Potential Support Focus:
Bearish Gold traders might be viewing the latest recovery as merely a reactive bounce within the broader late-January weakness. Their focus during the upcoming sessions may be on identifying resistance levels capable of capping this strength and possibly turning price action lower again.
Using the chart above, Gold bears could now be watching 5142, which is the 61.8% Fibonacci retracement of the latest decline, as a key focal point. If this level continues to cap the current advance and weakness re‑emerges, breaks below potential support at 4762, a level which is equal to half the latest recovery, could trigger further downside. While not a guarantee of renewed declines, closing breaks below 4762 may well shift focus back to critical support at 4425 that held so effectively at the start of February. A break below 4425 could exposure risks of even deeper declines.
Potential Resistance Focus:
For those looking at the potential for upside continuation, 5142, the 61.8% retracement of the latest decline, may be the first key resistance focus. Traders expecting a broader recovery could be watching for sustained closes above this level, as a break could signal scope for a more extended phase of price strength.
A close above 5142 this week could keep upside momentum in play, shifting focus toward the 5346 upper Bollinger band. A break of that level may reopen scope toward the 5598 January all‑time high, though that may still provide strong resistance.
Potential Price Consolidation Focus:
Of course, while both the support at 4762 and resistance at 5142 continue to contain price action, Gold may simply settle into a broader consolidation phase. This would align with easing volatility and a natural period of re‑balancing after the recent dramatic price swings.
The material provided here has not been prepared accordance with legal requirements designed to promote the independence of investment research and as such is considered to be a marketing communication. Whilst it is not subject to any prohibition on dealing ahead of the dissemination of investment research, we will not seek to take any advantage before providing it to our clients.
Pepperstone doesn’t represent that the material provided here is accurate, current or complete, and therefore shouldn’t be relied upon as such. The information, whether from a third party or not, isn’t to be considered as a recommendation; or an offer to buy or sell; or the solicitation of an offer to buy or sell any security, financial product or instrument; or to participate in any particular trading strategy. It does not take into account readers’ financial situation or investment objectives. We advise any readers of this content to seek their own advice. Without the approval of Pepperstone, reproduction or redistribution of this information isn’t permitted.
Quick Long for Doge Happy Monday, traders 👋
After two heavy weeks in the market, we’re entering a holiday period in parts of Asia, which may bring some short-term liquidity and potential upside 📊 I’m staying cautiously positive for now.
However, the bigger trend is still bearish, so risk management and patience remain key. Protect your capital and stay focused.
Let’s see what this week brings. Not financial advice.
Wishing everyone a strong and disciplined trading week 💪📈
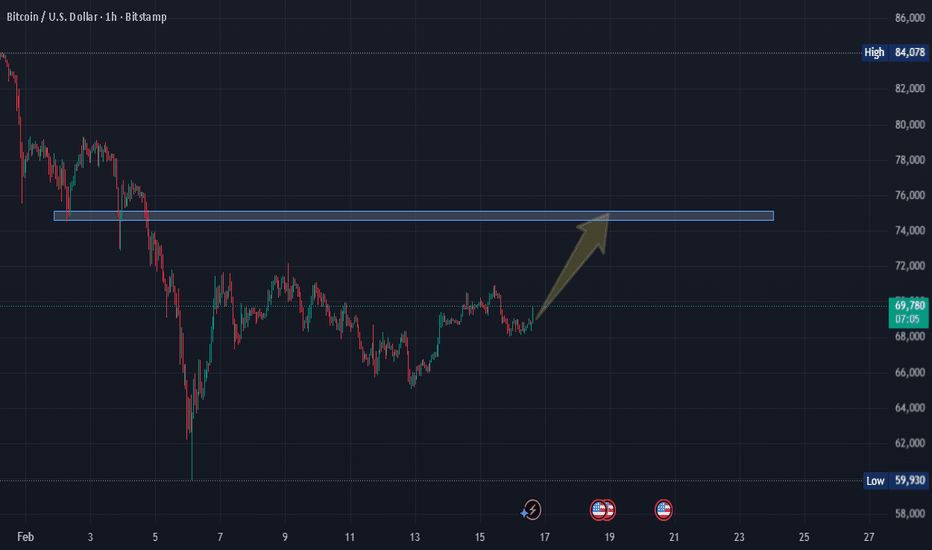
BTCUSD Volume Profile + RSI Bearish Divergence 68,350 Sell SetupBTCUSD – H1 Sell Analysis (Volume Profile + RSI Confluence)
On the Bitcoin / US Dollar H1 timeframe, a strong rejection setup has developed based on multiple Fixed Range Volume Profiles.
At POC 1, a clear RSI bearish divergence formed — price made a higher high while RSI printed a lower high, signaling weakening bullish momentum.
Price treated POC 1 as strong resistance and rejected downward toward POC 2.
Currently, price is trading below POC 2, which is now acting as resistance as well.
Active Sell Level: 68,350
Target 1: 66,140 (Demand Zone)
If price breaks 66,140 with strong bearish momentum, Target 2: 63,600 (POC 3 – Major Volume Control Level)
Market structure is forming lower highs, and volume rejection confirms that sellers are in control.
As long as price does not reclaim POC 2, the bias remains bearish.
Maintain proper risk management — place stop loss above POC 2 or the recent swing high.
Conclusion:
POC 1 rejection + RSI bearish divergence + POC 2 breakdown = Strong sell continuation setup toward 66,140 and potentially 63,600.

