JetBlue- tie with recent lows? Or plowing through all-time highs 1. Mixed Financial Results and Volatility
JetBlue’s Q4 2025 earnings revealed the airline still isn’t consistently profitable — EPS of -$0.49 missed expectations and margins remain negative — yet revenues slightly beat forecasts and unit revenue improved, showing that demand isn’t collapsing.
This duality has created noise in the market — investors don’t know whether to price JetBlue like a turnaround success or a structurally struggling airline.
• Negative margins and cash burn are real.
• Revenue growth is trending in the right direction — RASM prints a small beat.
• Guidance is cautious yet not bleak.
This tug-of-war shows up in recent price behavior — JetBlue saw a multi-day losing streak followed by a bounce, and remains well below its 52-week highs.
2. Price Action: Technical Inflection Point
According to chart data, JBLU’s share price is up sharply in the past month and recently near key intermediate resistance around ~$6.00, but it’s still trading roughly 20–30% lower than its yearly peak.
In technical terms:
• Above shorter-term moving averages — bullish sign, but not yet confirmed.
• Crucial support lies beneath ~5.00 and ~4.80 — breaking below could trigger sellers.
• Resistance around ~$6.00-6.10 — a breakout here would be a clear short-term bullish trigger.
Put simply: the stock is in a pivot zone where failing to hold support could send it down hard, while breaking resistance would shift sentiment sharply bullish.
3. Analyst Sentiment Was Bearish — But Shifting Slightly
Wall Street’s view has leaned bearish or cautious:
• Consensus ratings remain moderate sell/hold with a low average price target near current levels.
• Some firms maintained sell or hold, reflecting weak fundamentals.
However, there are early signs sentiment could be stabilizing — for example, Citi recently upgraded JetBlue to Neutral from Sell, signaling analysts are pricing in some of the turnaround potential.
This kind of divergence between sell-side pessimism and technical demand can set the stage for sharp moves once one side of the market wins conviction.
4. Operational & Strategic Growth Factors
JetBlue isn’t just a story of numbers — there are real business developments that could influence the next market move:
✔ “JetForward” turnaround strategy continues to roll out.
✔ Partnerships like the Blue Sky collaboration with United Airlines improve connectivity and loyalty network value.
✔ Continued domestic traffic recovery.
These structural progress points give bulls something real to anchor optimism on, even if the road isn’t linear.
5. Risk Catalysts Still Linger
Off-airline news — such as safety lawsuits related to an in-flight incident — introduces risk premium and can shake confidence.
Fuel price volatility, industry-wide headwinds, and negative cash flow remain real constraints on sustained growth.
Bottom Line: Why This Moment Matters
Right now, JetBlue’s stock is at a psychological and technical inflection point:
➡ Break Above Resistance (~$6+): Could signal that trend reversals and earnings prospects are gaining traction, attracting momentum buyers and shifting broader sentiment — setting the stage for new highs after extended consolidation.
➡ Break Below Key Support (~$5 and below): Would signify that fundamentals still outweigh optimism, likely retesting recent lows near $4 or even below, validating bearish positioning and trapping longs.
Both outcomes hinge on one thing: whether the market believes JetBlue’s turnaround can translate into real profitability, backed by stronger unit revenue and stabilizing operating metrics.
In essence: this isn’t just another sideways phase — it’s a decision zone. The next concrete move could define JetBlue’s trajectory for months to come.
SOURCES USED ARE BELOW
www.investing.com
www.benzinga.com
www.investing.com
www.benzinga.com
www.moomoo.com
www.barrons.com
www.reuters.com
Trend Analysis

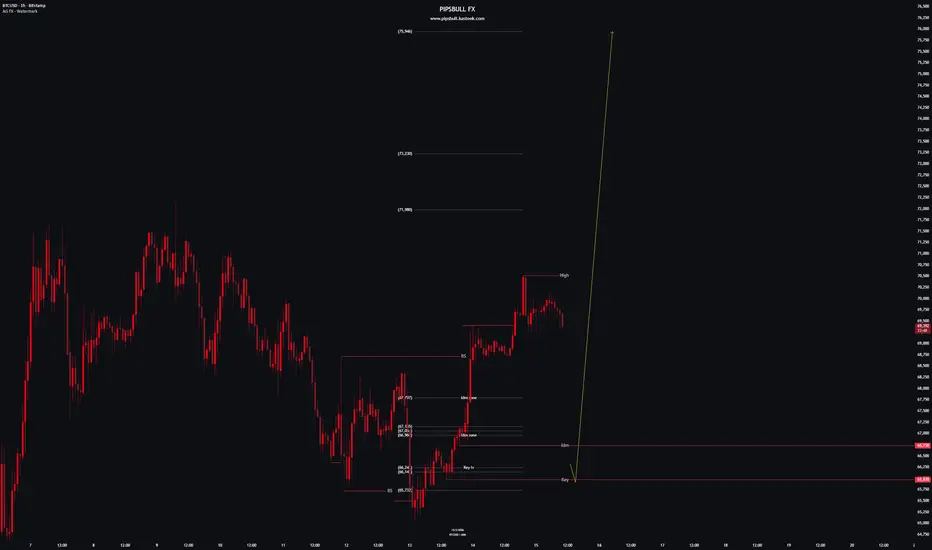
BTCUSD H1 – Key Levels Defining Bullish StructureThis idea focuses on BTCUSD on the 1-hour timeframe, highlighting price consolidation around a key structural zone following a strong bullish impulse.
After a sharp upside expansion, price reacted near the 70,300 area and has since transitioned into a controlled pullback. Current price action shows reduced momentum, suggesting the market is pausing and rebalancing after the impulsive move rather than showing immediate reversal signs.
🔎 Technical Observations:
Strong bullish impulse preceding the current consolidation
Price pulling back into a key structural / IDM zone around 66,730
65,970 acting as the key structural low defining bullish validity
Internal structure holding while momentum cools
Liquidity present both above the recent high and below the consolidation range
📌 Market Context:
This area represents a decision zone within a broader bullish structure.
Sustained acceptance above the internal displacement zone would keep the bullish framework intact, while loss of internal structure could open the door for a deeper rotation toward lower liquidity.
At this stage, price behavior reflects consolidation after expansion, not confirmation of a trend shift.
⚠️ Educational Note:
This analysis is shared to study market structure, key levels, and liquidity dynamics.
It is not intended to provide trading signals, execution guidance, or outcome predictions.
— PIPSBULL FX
Bullish GoldAscending Channel Pattern observed, strong buying pressure observed. Technically, local and global trends are bullish, a breakout of 5105 is a clear bullish scenario

#ETC/USDT The price is moving within an ascending channel#ETC
The price is moving within a descending channel on the hourly timeframe. It has reached the lower boundary and is heading towards a breakout, with a retest of the upper boundary expected.
The Relative Strength Index (RSI) is showing a downward trend, approaching the lower boundary, and an upward bounce is anticipated.
There is a key support zone in green at 8.41, and the price has bounced from this level several times. Another bounce is expected.
The indicator is showing a trend towards consolidation above the 100-period moving average, which we are approaching, supporting the upward move.
Entry Price: 8.70
First Target: 8.95
Second Target: 9.20
Third Target: 9.50
Stop Loss: Below the green support zone.
Remember this simple thing: Money management.
For any questions, please leave a comment.
Thank you.

#XRP/USDT#XRP
The price is moving within a descending channel on the hourly timeframe. It has reached the lower boundary and is heading towards a breakout, with a retest of the upper boundary expected.
The Relative Strength Index (RSI) is showing a downward trend, approaching the lower boundary, and an upward bounce is anticipated.
There is a key support zone in green at 1.53, and the price has bounced from this level several times. Another bounce is expected.
The indicator shows a trend towards consolidation above the 100-period moving average, which we are approaching, supporting the upward move.
Entry Price: 1.60
Target 1: 1.63
Target 2: 1.67
Target 3: 1.72
Stop Loss: Below the green support zone.
Remember this simple thing: Money management.
For any questions, please leave a comment.
Thank you.

#XRP/USDT (1h) (spot)#XRP
The price is moving within a descending channel on the hourly timeframe. It has reached the lower boundary and is heading towards a breakout, with a retest of the upper boundary expected.
The Relative Strength Index (RSI) is showing a downward trend, approaching the lower boundary, and an upward bounce is anticipated.
There is a key support zone in green at 1.36, and the price has bounced from this level several times. Another bounce is expected.
The indicator is showing a trend towards consolidation above the 100-period moving average, which we are approaching, supporting the upward move.
Entry Price: 1.44
Target 1: 1.47
Target 2: 1.52
Target 3: 1.58
Stop Loss: Below the green support zone.
Remember this simple thing: Money management.
For any questions, please leave a comment.
Thank you.


MNQ Analysis & Day Trading - Monday March 10 2025 part 2Day: 4-1, +$568.
All 1 MNQ trades, risking no more than $120.
-------------
As a learning, beginner day trader I go through the market replay predefining what I am looking for to enter a trade and walk through my thoughts as I experience the market action bar by bar throughout the entire day to see how I handle various events and assess my execution.
This is for me and others to learn if you desire.

BTC analysis🎯 Upside targets:
75,071 (0.5 Fib)
78,612 (0.618 Fib)
⚠️ Major resistance zone between 75K – 79K, possible rejection area.
✅ This is a pullback buy inside a downtrend → take profits step by step.

AAVE/USDT — Key Demand Reaction: Breakout or Another Rejection?On the 4D timeframe, AAVE’s movement against USDT still appears to be in a medium-term corrective phase after failing to maintain its previous higher high structure.
Price has just reacted from a strong demand zone that has repeatedly acted as a buyer defense area.
Key marked zones:
Demand / Support: 128 – 112 (yellow block)
Layered Resistances: 146 → 175 → 205 → 242 → 288 → 305 → 350
Market structure remains held below a descending trendline that has been pressing price since the last peak.
---
Pattern Formation
1. Descending Triangle / Falling Structure
The downward trendline connecting lower highs indicates:
Sellers are still dominant
Every rally gets rejected at lower levels
Distribution pressure is still ongoing
However, the 128–112 support base continues to hold → forming a descending triangle structure.
2. Multi Rejection Resistance Ladder
Resistance areas are stacked in layers:
Indicates distributed supply
Each level is a potential profit-taking zone
Breakout must occur step-by-step, not instantly
3. Strong Horizontal Demand
The yellow block represents historical demand:
Previously became the base of a major rally
High buying volume
Long wick reactions indicate absorption
---
Key Levels
Main Supports
128 – 112 → Key demand (current reaction zone)
95 → Minor support if breakdown occurs
70 → Extreme low liquidity zone
Main Resistances
146.5 → Nearest resistance + trendline test
175 → Mid resistance
205 → Break confirmation level
242 → Strong supply
288 – 305 → Distribution range
350 → Major macro resistance
---
Bullish Scenario
Bullish becomes valid if price can:
1. Hold above the 128 – 112 demand
2. Break the descending trendline
3. Close strongly above 146.5
If that happens, upside potential:
175 → First resistance
205 → Bullish structure shift
242 → Supply test
288 – 305 → Distribution zone
350 → Macro target
This structure would shift the market from:
Lower High → Higher High
Meaning a medium-term trend reversal could begin.
---
Bearish Scenario
Bearish activates if:
1. Price fails to break the trendline
2. Gets rejected at 146 – 175
3. Falls back below 128
Consequences:
Demand breakdown
Long position liquidations
Continued downside momentum
Downside targets:
112 → Last demand line
95 → Next support
70 → Extreme downside
If 112 breaks, structure shifts into:
Continuation Bearish Trend
---
Conclusion
Price is currently in a decision zone
128 – 112 demand is the buyer defense base
Descending trendline is the breakout key
Two major possibilities:
1. Trendline break → Gradual rally to 205 – 242 – 288
2. Rejection → Demand breakdown → Drop to 95 – 70
The market is in a compression phase before expansion.
Large moves typically occur after price exits triangle structures + demand bases like this.
#AAVE #AAVEUSDT #CryptoAnalysis #Altcoin #DeFi #TechnicalAnalysis #TradingViewIdeas #SupportResistance #TrendlineBreak #CryptoTrading #AltcoinAnalysis #BullishScenario #BearishScenario

Sol long to $89.85 todayJust opened a new long on CRYPTOCAP:SOL
🛑Sl: $86.97
🎯Tp: $89.85
💰3RR
DTT analysis suggest a continuation push towards target above.

Potential outside week and bullish potential for NABEntry conditions:
(i) higher share price for ASX:NAB above the level of the potential outside week noted on 5th February (i.e.: above the level of $44.10).
Stop loss for the trade would be:
(i) below the low of the outside week on 5th February (i.e.: below $44.26), should the trade activate.

Worldcoin —The downtrend endsSince March 2024 here we have a downtrend. If the downtrend ends, we get a new market cycle. It can be either sideways or bullish. For a sideways period to start, there must be some sort of change first. This is to say that a bullish move comes next regardless of how you slice it.
Worldcoin (WLDUSDT) is ending its downtrend based on multiple chart signals. It has been crashing since March 2024 with a bottom being hit October 2025. After October 2025, no new lows.
Last week we have a Doji. It comes up at the end of a very long downtrend and also as a higher low compared to the October 2025 all-time low. This Doji works as a reversal signal.
The fact that this week turns green, is full green and about to close in this way, confirms the Doji as a reversal signal. Thus, the end of the downtrend.
The end of the downtrend implies the start of a new market phase. This new market phase means Worldcoin will stop dropping; it means higher prices.
Namaste.

A big leap in growth in the coming days? I believe so.In the coming months and days, Monero could experience a significant growth spurt after successfully weathering the Bitcoin crash. While Bitcoin did fall considerably, it wasn't like other altcoins. Due to its resilience and low purchase price, it could reach much higher levels in less time. Previously, it would have taken two years; now, in less than a year, we could see it firmly recovering and reaching its all-time high.

Correlation SundayFor everyone that trades these markets separately, please know, they are mostly the same (as in mevement) excluding Bitcoin
Dont overexpose!

bear market startAccording to my analysis, Bitcoin will drop to the $70,000 range, and this drop is certain.

EURUSD Local Bullish Bias!
HI,Traders !
#EURUSD has made a retest
Of the horizontal support
Level of 1.17914 and we are
Already seeing a bullish rebound
So we will be expecting
A further move up !
Comment and subscribe to help us grow !

Can BTC Sell off here?The market is downtrending and created a Lower Low. The last "buy to sell" candle before the push down was not mitigated. Confirmations are the downward impulse lines up with my Fib levels of .80- .886 and the reversal head and shoulders pattern with the clear close below the change of direction on higher timeframes. Yellow zone is the primary entry target with highest darker zones as secondary entries. Take Profit will align with equal lows but needs re-evaluation as market potential pulls back up into entry area. Will re-evaluate on higher timeframes for Take profit 2 and 3 zones.

Bollinger Band Getting Very TightBollinger Band getting very tight on the weekly timeframe after another year of bull market!

WTI Crude Oil - Bullish EW Count - 11/02/2026This is not financial advice, always do your own research.
As global tension rises, one must consider a position in crude oil - and what a tempting position it is to monitor currently. It may be a little early, but soon it may be too late; crude oil moves quickly when it's ready.
A few technical points to analyse:
Complete counts of waves 1-5 and ABC (consistent on lower timeframes).
Descending wedge formation - giving TP1 target for a Bulkowski-defined price target.
MACD indicator is showing a prime signal for a move to the upside - moving averages potentially crossing on monthly close with histogram close to switching green (this idea is essentially frontrunning the signal).
Entry Zone: The potential entry zone in green is marked wide - oil is a volatile commodity and it's impossible to know if this will be a clean move to the upside, unless receiving some sort of catalyst event to push it. At the moment, we see a plausible count on lower timeframes for this last bounce in Dec 2025 leading to an impulsive 5 waves, however there are also counts for both above/below current price:
TP1: Based on descending wedge formation's price target.
TP2: Based on potential micro WXY target at 0.5 fib extension:
TP3: Based on potential micro ABC target at 0.618 fib extension and above - this increases the probability for a macro ABC as shown:
TP4: Based on potential motive wave 3 target - a minimum of 1 fib extension from C. This would imply another macro wave 4 and 5 incoming thereafter:
Previous structure:
As seen below, oil had previously been in a large Wolfe wave formation - marking the entry in March 2020 and exit upon hitting line AD in February 2022.
Gold is already signalling unrest and lack of economic confidence.
Gold tells the story. Oil will tell the tale.

US10Y Daily priceaction and directional bias.US10Y is the yield on the U.S .10-year treasury notes government debt security maturing in 10 years that serves as a global benchmark for interest rates, reflecting investors expectations on growth ,inflation and federal reserve policy.
The US10Y represents the effective return investors demand to lend to united states government for a decade(10years).it moves inversely to bond prices, on technical, when yields are rising which signals stronger growth while falling yields indicates economic caution or safe-haven demand,US10y influences borrowing cost across mortgages, corporate bonds and loans
Coupon rate is the fixed annual interest paid on a bond's face value. For a Treasury note or bond, it's set at issuance and paid semi-annually until maturity.
Key Details
It's calculated as (annual coupon payments / par value) × 100; e.g., a 5% coupon on $1,000 par pays $50 yearly ($25 twice).
Unlike yield, which fluctuates with market price, the coupon remains constant—higher coupons trade at premiums when yields fall.
Bond prices and yields have an inverse relationship. When yields rise, prices fall, and vice versa, due to the fixed coupon payments relative to market rates.
Why Inverse?
Fixed coupons mean higher market yields make existing bonds less attractive, forcing sellers to discount prices for competitive returns.
Lower yields increase demand for higher-coupon bonds, driving prices above par (premium).
US10Y affect DAX40,the DAX40 is the German benchmark index of 40 major stocks, through global yield spillovers and capital flows.
When the US10Y is higher and bullish ,it strengthens the dollar index and pressure Eurozone borrowing, this makes U.S assets more attractive and weighing on European equities like the DAX40.
The US10Y bearish drop can be seen as supporting DAX by easing ECB policy constraints and boosting risk appetite.
So coming week trading US10Y along side DAX40.
the market structure of the US10Y is giving us a sell vibes and it could drop below 4.0% this month .
though we have an ascending trendline on daily that should serve as support to enable us get a retest and sell below 4.0% on possible breakout of trend.
#US10 #US10 #BONDS

CAT about to fallLook at CAT on the monthly chart. Notice what happens when the momentum oscillator is above the 80 line. I have marked these with the red vertical lines.
Further confirmation is on the weekly chart historically when 3 things happen: RSI over 72, Stochastic RSI over 90, Momentum oscillator over 80.
Now look at the 2 hour chart (I can only show the 1 chart at a time on publishing). The 2 hour chart is showing bearish divergence. A correction is coming soon!
Again, refer to the percentages of the corrections on the red vertical lines on the monthly chart. We can except a 25% move down, which would put the price back to the top of the shown parallel channel (pre-breakout area).

EURJPY STRONG BEARISH BIAS|SHORT|
✅EURJPY strong bearish displacement confirmed breakout below 5H supply. Structure shifted lower with sell-side liquidity in play. Expect minor retrace into premium before continuation toward external liquidity at target.Time Frame 5H.
SHORT🔥
✅Like and subscribe to never miss a new idea!✅
