Zcash - Time to buy again!The price on the 6h timeframe is within an ascending triangle, which can be promising. If the price breaks this pattern with bullish candles, it could easily rise by the distance of AB=CD.
Trend Analysis

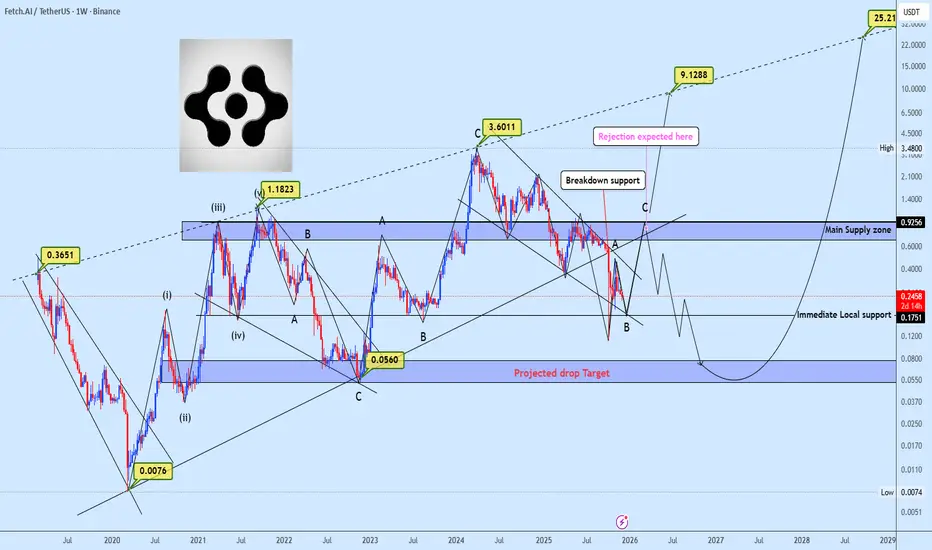
Rising Wedge Breakdown on FETUSDT Retest Before Next MoveFETUSDT has completed a classical rising wedge distribution which triggered a clean breakdown into the $0.53 zone, shifting the short term structure from demand led momentum into corrective flow.
Price is now trading beneath the major support that previously served as demand, turning it into an active supply zone. Current structure favors planning around the pullback any relief rally back into the supply area offers an ideal region to monitor for rejection and continuation of the corrective leg.
However, a decisive breakout and acceptance above the supply zone would invalidate the immediate bearish thesis and open the door for bullish continuation, with the market attempting to resume trend as clearly outlined on the chart.
XAUUSD – M30 Trading Plan | Buy Demand + GAP–FiboAUUSD – M30 Trading Plan | Buy Demand + GAP–Fibo
🔍 Market Context (SMC)
The price has formed an upward BOS, confirming the short-term trend still belongs to the BUY side. The current decline is just a technical pullback to rebalance the cash flow, there is no bearish CHoCH → no reason to reverse the bias.
OB is below the current price, so this area is Demand (Buy Zone),
🟢 Primary Scenario – BUY according to Demand + GAP + Fibo
• Confluence Buy Zone:
Demand / Bullish OB + GAP (iFVG) + Fibo 0.5 – 0.618
→ price range: 4.40x – 4.39x
• Entry Logic:
The price retraces to the GAP not fully filled, coinciding with the Fibo retracement of the upward BOS → high probability of a BUY reaction.
• Target:
TP1: nearest previous peak
TP2: expand according to structure if there is a continued BOS
• Invalidation:
M30 candle closes below the entire Demand / GAP area → cancel the BUY scenario
⚠️ Secondary Scenario – Not prioritized
If the price does not retrace to GAP – Fibo but continues sideways or breaks the peak → stay out, do not chase BUY without a proper pullback.
📌 Summary
• Trend: Bullish after BOS
• Optimal BUY point: Demand + GAP + Fibo (0.5–0.618)
• Only SELL when there is a clear bearish CHoCH (currently none)

XAUUSD Price Forecast: US Venezuela Tensions Test $4,500Market Overview
- Gold (XAU/USD) opened the week with strong upside momentum, briefly pushing above the $4,400 handle during the early European session. However, that initial advance stalled relatively quickly. The primary driver behind the early strength was not technical in nature, but rather a renewed surge in geopolitical risk. Developments in Latin America, particularly the U.S.-led military action in Venezuela and the arrest of President Nicolás Maduro, have significantly increased global risk sensitivity. Additional rhetoric suggesting that Colombia and Mexico could face similar pressure has further unsettled markets.
- Beyond Latin America, unresolved conflicts in Ukraine, persistent instability involving Iran, and ongoing tensions in Gaza continue to reinforce a fragile global backdrop. In this environment, capital preservation has become a priority. Investors are rotating into traditional safe-haven assets, and gold remains one of the primary beneficiaries of this risk-off positioning.
Strong U.S. Dollar Fails to Suppress Gold Demand
- Despite the broader risk-off tone supporting the U.S. dollar, gold has proven resilient. Normally, a stronger dollar would act as a headwind for bullion, but current market conditions suggest that safe-haven demand is strong enough to offset currency pressure. This divergence highlights how elevated geopolitical uncertainty is currently overriding conventional correlations.
- Looking ahead, U.S. macroeconomic data will be a key driver. Inflation-related releases throughout the week, followed by Friday’s U.S. employment report, are critical inputs for Federal Reserve expectations. Any signs of labor market softening could reinforce expectations for additional rate cuts, which would further support gold by reducing real yield pressure.
Short-Term Forecast
In the near term, gold is likely to remain range-bound as the market digests both geopolitical headlines and upcoming economic data. A consolidation range between $4,410 and $4,450 appears reasonable over the next few sessions. As long as safe-haven demand remains intact, upside pressure persists, and a clean break above the $4,500 level cannot be ruled out.
Technical Structure and Key Levels
- From a technical standpoint, gold is currently trading near $4,421 after rebounding from the recent sharp pullback off the $4,550 high. Price has successfully reclaimed the $4,412 Fibonacci retracement level, and short-term EMA closes above this zone suggest improving near-term structure. Importantly, the broader uptrend that has been in place since December remains intact.
- Imediate resistance is located near $4,445, aligning with the 61.8% Fibonacci retracement, followed by a higher resistance zone around $4,498. Recent price action has produced a sequence of higher lows, signaling renewed dip-buying interest and improving market confidence.
- Momentum indicators support this view. The RSI has recovered toward the 50 level, indicating stabilization and early momentum recovery rather than overextension. From a tactical trading perspective, pullbacks toward the $4,410 area remain attractive, with upside targets toward $4,500, while a protective stop below $4,340 helps manage downside risk if the recovery fails.

Gold price analysis on January 5thGold opened the Asian session with very positive momentum, indicating a strong return of demand. On the technical chart, an inverse head-and-shoulders pattern is gradually completing, with the key neckline around 4400. If this level is clearly broken, gold is highly likely to enter a new upward phase, heading towards the 4480 resistance zone and possibly even higher peaks.
Given the prevailing bullish trend, the intraday trading strategy prioritizes buying opportunities and minimizing selling against the trend. Selling pressure will only become significant if the price breaks through and closes below the strong support zone around 4300, thus breaking the upward structure.
📈 Suggested Trading Strategy
BUY around 4390
BUY on a price rejection signal at the support zone of 4352 – 4304
Expected Target: 4480
⚠️ Risk Management
The bullish scenario is invalidated if the closing price falls below the key support zone (confirming a breakout of the structure).

BTCUSD Bullish BiasMarket Outlook – BTCUSD
If price breaks above the current descending trendline, it could signal the start of a short-term bullish continuation.
Macro Context:
The market had largely priced in a more aggressive stance from the Bank of Japan, which raised expectations of further downside in Bitcoin—potentially a breakdown of the daily demand zone. However, the actual hike came in at only 25 bps, which reduced downside pressure. Instead of selling off, BTCUSD reacted positively, indicating underlying strength and absorption of sell orders.
Technical Structure:
Price respected the 1D demand zone, confirming strong buyer interest.
Momentum has shifted upward despite bearish expectations, increasing the probability of a trendline breakout.
A confirmed break and hold above the descending trendline would strengthen the bullish case.
Trade Plan:
Entry: After a confirmed breakout and retest of the broken trendline (support flip).
Strategy: Suitable for intra-day to short-term swing trades, depending on follow-through and volume confirmation.
Bias: Bullish, as long as price holds above the demand zone and structure remains intact.
Risk Note:
Invalidation occurs if price loses the demand zone decisively, which would negate the bullish setup.
Merry Christmas and Happy New Year! 🎄✨

Pumpcoin long ETA todayWent long on pumpcoin not too long ago. Scalp.
roughly 2 RR.
Expecting bullish continuation push back to $0.002450 - prior monthly support area before any major sell

CVX: Potential Monday Gap + Long-Term Trend ApproachesHello Everyone, Followers,
CVX the second one for today that i would like to share my analysis.
🟦 Technical Overview
Chevron has recently posted a very strong bullish candle right through the descending trendline. Price is now trading at ~155.9.
🌍 Geopolitical/Operations Note
It’s commonly cited that Chevron is one of the only major U.S. energy companies with legal operations in Venezuela — due to legacy licenses and diplomatic agreements. So with Trump action on Venezuela will make CVX more powerfull and I beleive it will effect company turnover definatelly. Therefore I am expecting from CVX to react sharply and GAP up open on Monday.
🔮 Outlook
Chevron looks ready to fill/explode above the recent short-term structure. If Monday opens with a gap (likely on energy price strength or geopolitical headlines), the 0.382 / 0.5 (157-158 / 161-162) Fib zone will act as the first overhead pivot. My Short term expectation is 164 -165.
Even we can see this level on Monday.
📝 My Plan
Bullish continuation: Daily close above 157.9 opens the 161–164 targets.
Rejection scenario: If price fails to sustain above 157–158, look for pullback support near 151–150.
Catalyst watch: Energy prices + geopolitical headlines (Venezuela, OPEC).
If you enjoy and like clean, simple analysis — follow me for more.
This is just my thinking and it is not invesment suggestion , please do not make any decision with my anaylsis.
Have a lovely Sunday to all and hopefully green trade day for next Week.
#SPX500 #NASDAQ #CXV

EUROUSD correctionExpecting a correction down to 1.1200. That's the level I'm watching like a hawk. A break below that, and we could be talking about a whole new ball game, potentially testing the waters around 1.1150. But until then, I'm treating any dips as buying opportunities, albeit with a cautious eye. The overall trend still seems to favor the upside, but I'm not getting complacent. This market can turn on a dime, and you need be ready to react.
SL close above 1.19200 .

EURCADMonthly:
Price is currently at a key monthly level formed in July 2009, where a strong reversal previously occurred. However, this level is very old, and there has been no recent price reaction. Because of the lack of fresh confirmation, it is uncertain whether price will react again at this level. Therefore, we move to the lower timeframe (weekly) to look for any signs of reaction.
Weekly:
Price formed a false breakout above the monthly level, indicating a lack of buyers. After that, price created a lower low, followed by a lower high and another lower low, confirming a trend change from an uptrend to a downtrend. A trendline break further supports the bearish trend.
Daily :
Downtrend Confirmation:
Price formed a head and shoulders pattern, along with a triple top on the right shoulder. The neckline break, confirmed by a strong bearish momentum candle, validates the continuation of the downtrend.
Pullback Zone:
Price pulled back to the neckline area, aligning with the Fibonacci 0.5–0.618 retracement zone , 50 EMA , and showing multiple candle reactions.
Entry Consideration:
Due to strong bearish momentum on the daily timeframe, entering immediately was not ideal because the stop loss would be too far. The best approach was to wait for a pullback and confirm its completion on the 4-hour timeframe.
4-Hour Timeframe:
Price formed a channel pattern during the pullback. A break of the channel, followed by a lower low, confirmed that the pullback was complete and the downtrend was likely to continue, providing a valid trade entry.

Nasdaq = US100 possible short term buy entryi think there will be a buy opportunity soon for short term. i will look for an entry if nasdaq moves as expected. of course with an invalidation level. elliot wave is not guarantee but a compass in the unknown we can use to navigate.

BTC Update — 92K Zone as Bull Run Trigger (100K+ Scenario)Bitcoin is approaching a critical decision zone around 92K, which is acting as a major pivot for the next macro move. Price action shows consolidation and higher acceptance just below resistance, suggesting strength is building rather than distribution.
Why 92K Matters
📍 Key reclaim zone: 92K has historically acted as a strong resistance/support flip.
📈 Structure shift: Sustained trading above this level would confirm a higher high on the intraday structure.
🔊 Volume context: Current compression indicates that once volume expands, the move could be fast and directional.
Bullish Scenario
A confirmed breakout and hold above 92K can be the start of a broader bull phase.
From this zone, BTC has a high probability to accelerate toward 100K+, with momentum-driven extensions possible once psychological resistance is cleared.
Pullbacks above 92K would likely be seen as retests, not reversals.
Invalidation / Risk
Failure to hold 92K after a breakout would delay the move and keep BTC range-bound.
As long as price holds above the current base, downside risk remains controlled.
Summary
This 92K zone is the ignition level.
If BTC accepts above it with volume, the market structure opens the door for a strong bullish continuation toward 100K and beyond.
📌 Patience here is key — confirmation turns this zone into the launchpad.

FARTCOINSEED_WANDERIN_JIMZIP900:FART
Monthly pushing through .618 ressistance zone. Can we close a candle above this month? If we close above, .786 is the next upside target. Bullish.

GOLD: The "Reconstruction" Supercycle (Cup & Handle Breakout)The headlines are focused on the "Oil" aspect of the US-Venezuela news. They are missing the bigger picture. Rebuilding a nation requires massive capital expenditure. Whether it's printed or borrowed, it adds liquidity to the system.
The Thesis: The "Silent Takeover" Phase 2 As we discussed in my previous idea ( Gold: The Silent Takeover) , Smart Money has been rotating out of fiat/tech and into Hard Assets for months. The "Venezuela Reconstruction" is just the latest catalyst in a broader Capital Rotation Supercycle.
1. THE STRUCTURE:
Textbook Continuation 📉 I marked up the Daily Chart (attached) to show the pure geometry of this move.
The Pattern: We have formed a massive Cup & Handle continuation pattern (the purple curve). This is one of the most reliable bullish structures in technical analysis.
The Breakout: Price has broken above the key $4,380 Resistance (Red Line) and is now holding it as support.
The Channel: We are strictly respecting the Blue Ascending Channel. As long as we stay inside this blue zone, the trend is mathematically up.
2. THE CATALYST:
Inflationary Geopolitics 🌍 Why is Gold pushing ATHs while the Dollar is strong? Because the market is pricing in the cost of the US intervention in Venezuela.
Reconstruction = Spending: The US administration has pledged to "invest billions" to rebuild Venezuela's energy grid.
The Hedge: Institutional capital uses Gold to hedge against the currency debasement required to fund these geopolitical moves.
3. THE TARGET:
The "TP" Zone 🎯 The technical measured move of this Cup & Handle aligns perfectly with the "TP" circle marked on the chart. If this channel holds, we are looking at a structural target in the $4,800 - $5,000 region as the Supercycle accelerates.
👇 The "Hard Asset" Rotation List:
If this Supercycle is real, it's not just Gold. Check my previous analysis on Silver (The 1980 Curse Broken) to see how the whole sector is moving together.
TVC:GOLD , TVC:SILVER , CAPITALCOM:COPPER

GBPUSDPrice action is the study of the raw movement of price over time. Instead of relying on complex mathematical formulas (indicators), price action traders look at the "naked" chart to understand the battle between buyers and sellers.

AUDUSD in a BULLISH PHASEAUDUSD is continuing its strong bullish trend on the higher timeframe. Price has shifted structure by breaking the last lower high (LH) and forming higher highs (HHs). On the 15-minute timeframe, this presents a buying opportunity with a 1:2 risk-to-reward ratio, as price action indicates readiness for a new higher high.

GBPUSD - time to buyGBPUSD was in a recent downtrend for the last few weeks and struggled to stay bullish, but recently it has just broken a strong resistance trend line which it tested several times and failed to break through. GBPUSD is very likely to hit the next major resistance zone which is market as the "TAKE PROFIT" LEVEL. There are many clear signs of new bullish movements. Buy GBPUSD now.

LAYER LOOKING FOR MASSIVE REVERSAL+Layer Looking for a Potential Trend Reversal with Bullish Technicals on HTF, Use Proper Risk Management

BTC #Betcoin 1day Timeframe AnalysisBTC (1D) shows a sharp sell-off into a strong demand zone (~83–85k), followed by consolidation forming a triangle/ABCD-style structure. A breakout above the mid-range (~90–92k, 50% level) suggests a relief bounce, with upside targets around ~95k (first resistance) and ~100–102k (2nd TP). Bias stays cautiously bullish above the demand zone; a break back below ~85k would weaken the setup.

Tata Steel | Up for 7-8%Metals are shining so the Tata Steel.
A good opportunity at 169-171 levels with a SL of 2% and reward of 7-8% (Minimum)
A weekly B/O has taken place and R:R is good.

UPDATE ON EUR/USD TRADEEUR/USD 1H - Who managed to get involved in this beauty over the New Year? amazing analysis sent out to you all that has played out perfectly.
As always I cant stress enough there will be times this year where it is purely analysis based just like this one here but the trades still stand, its a case of using what you learn from me to execute.
This trade is currently running + 87 pips. (+ 9%) 9RR
Im not always active on the charts to provide specific entries but I will always do my best in providing the right content, content that solid to help you all bag some cash.
A big well done to those who did get involved and did take that leap! It should have set you up nicely for the year, I will update you all on this pair when price trades into the Demand Zone I have marked out below.

GBP/AUD BEARS WILL DOMINATE THE MARKET|SHORT
GBP/AUD SIGNAL
Trade Direction: short
Entry Level: 2.013
Target Level: 2.010
Stop Loss: 2.016
RISK PROFILE
Risk level: medium
Suggested risk: 1%
Timeframe: 1h
Disclosure: I am part of Trade Nation's Influencer program and receive a monthly fee for using their TradingView charts in my analysis.
✅LIKE AND COMMENT MY IDEAS✅

gold sell in h1we are looking sell from here with target 4405 or 4400 then will see opportunity for buy
