Close attention to this chart. Could play out pretty well. BTC Wlong term accumulation about to end could be the manipulation phase is going on now in my opinion.
Trend Analysis

Bitcoin 3D timeframe- 2 bearish scenarios
I expect Bitcoin will bottom around Mar-Apr this year.
Aligning with my bearish view since 10.10.2026, both of these scenarios are bearish- One with a deeper correction which is the one I give higher probabilities, to given the past few day price action.
✅ Bearish scenario 1: Bottom between 50k and 57k (purple one)
✅ Bearish scenario 2: Bottom between 38k and 44k (green one)
( I give higher probabilities to this scenario)

Bitcoin is expected to fallDiamond pattern
+
The price of bitcoin is struggling to stay above the critical $100k mark, and analysts are starting to sound the alarm over changing economic factors. Amid the broader market downturn, cryptocurrency trader Jason Pizzino warns that the likelihood of a bitcoin crash is increasing. He highlights key market indicators, such as falling interest in bitcoin and declining trading volume, that suggest the bearish trend is gaining momentum. But he's not the only one, saying that Peter Brandt and Robert Kiyosaki have also recently issued similar warnings.
Pizzino is noticing warning signs in the marketplace
Analyzing the blood trail, Jason Pizzino, a well-known cryptocurrency trader, believes that bitcoin is showing clear signs of weakness. He points out that interest in bitcoin is waning, as seen in Google Trends data. Fewer and fewer people are searching for bitcoin and cryptocurrency, with bitcoin searches dropping to 24 out of 100 and the total number of cryptocurrency searches dropping to 12. This suggests that the hype around cryptocurrency is waning, which often leads to lower prices.
Translated with DeepL.com (free version)


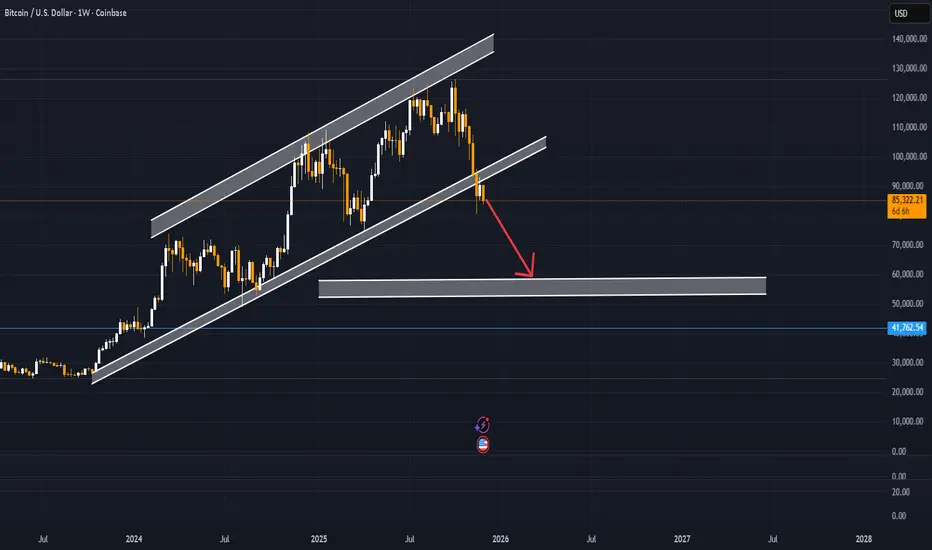
Bitcoin Just Broke Its Weekly Channel🔥 Bitcoin Just Broke Its Weekly Channel — And Even Pulled Back to the Bottom! 🔥
Ldo become scamWhile all market bleeding scam team decide to sell tokens on 1m$
while lowcaps and scam coin -10% on dump,this "top staking" project -16% and continued dumping,lol

USDJPY: Rejection at 157.70 Short Setup Targeting Discount priceUSDJPY has surged into a technically sensitive supply zone between 156.8 and 157.1, which previously acted as heavy support and is now functioning as a "ceiling". With political uncertainty in Japan peaking ahead of the February 8 election and daily oscillators remaining in the negative zone, the path of least resistance for the next few sessions is likely downward.
Technical Evidence:
Resistance Cluster: The price is struggling to consolidate above the 157.10 mark, showing exhaustion after the recent recovery rally.
Institutional Liquidity Gap: The move up left several "Unfilled Orders" and an FVG (Fair Value Gap) below, which act as price magnets.
Bearish Divergence: While price reached a two-week high, momentum indicators are showing signs of slowing, suggesting a corrective profit-taking phase is imminent.
The Downward Roadmap
Target 1 (FVG Re-test): First, the market needs to re-balance the imbalance at 155.40 – 155.60. This is where initial profit-taking will occur.
Target 2 (Structural Pivot): A break below 155.00 will lead directly to the 153.70 discount level, which is the "mid-point" of the recent crash recovery.
Target 3 (Lower Order Block): The final objective is the 152.15 zone. This is the origin of the last major trend and where "Smart Money" is most likely to reload for a long-term reversal.
Neutral / Invalidation Dashboard
Bearish Bias: Active while price remains below 157.70.
Invalidation: A clean daily close above 157.70 negates this short setup and opens the door for a continuation toward 159.30.
Final Thought: This is a "sell the resistance" play. We expect the market to sweep the liquidity at 152.15 before any further bullish attempts.

#BITCOIN: Still Expecting Price To Touch $60K To $65K! Bitcoin is likely to drop further down before we could see a strong bullish move taking price to all time high. This is our view only and it is not an guaranteed move; once price touch our reversal zone then we could see price going back to all time high. Good luck and trade safe!
Team Setupsfx_
Like And Comment Our Ideas For More Such Educational content! 📊🚀

Its Enough Watch the smaller timeframes (daily 1D or 4-hour); if you see a "Slight Regular Bullish Divergence" on the smaller timeframes when touching the yellow line, this is a safe entry signal

XAUUSD 4H: Correction After 2 Imbalances — Key Demand BelowContext (4H)
Price is currently in a corrective phase after a sharp directional move that left two clear inefficiencies/imbalances (what I call “2 gapping”). This typically invites a retracement into demand before the next expansion.
Key Levels on My Chart
Demand (support) : 4774.5 – 4835.6 (green zone)
Supply (target 1) : 5129.1 – 5154.6 (red zone)
Supply (target 2) : 5236.2 – 5263.7 (red zone)
Primary Scenario (Bullish Continuation)
Next week, I expect a reaction from the green demand zone (or slightly above it), followed by a bullish expansion targeting the nearest supply.
Execution idea: wait for a liquidity sweep into/near demand, then a strong displacement/impulse up.
Confirmation: formation of a fresh FVG in the bullish direction + CVD/volume confirmation aligned with the move.
Targets: first 5129–5155, then 5236–5264 if momentum persists.
Alternative Scenario (Bearish Pulse Repeats)
If demand fails and the market shows acceptance below the zone, the bearish leg can extend and print lower prices than the recent swing low.
Bearish trigger: breakdown with displacement + inability to reclaim the zone (acceptance below).
Expectation: continuation of the prior bearish pulse (new lows).
Invalidation / Risk Rules (Hard)
Long invalidation : acceptance below 4774.5. (My rule: after the liquidity-grab wick, price must not trade beyond the wick extreme; trading beyond it implies bias shift.)
Short invalidation : strong reclaim back above the demand zone with bullish displacement and sustained holding.
Conclusion
I am treating this as a correction inside a larger sequence: demand is the decision point. I will not front-run; I want sweep → displacement → FVG → CVD confirmation before taking the bullish continuation. If the zone fails with acceptance, I will switch to the bearish continuation framework.

Selling pressure on gold is following the trend line.⭐️GOLDEN INFORMATION:
Gold price (XAU/USD) tumbles to around $4,680 during the early Asian session on Friday. The precious metal extends the decline as traders cover losses from equities and adjust positions. The preliminary reading of the Michigan Consumer Sentiment Index report for February is due later on Friday.
The Chicago Mercantile Exchange Group (CME), the world's leading derivatives marketplace, has raised initial margin requirements for Gold and Silver futures contracts again, increasing the amount of collateral traders must post to open and maintain positions. Additionally, falling technology stocks have forced some traders to liquidate gold positions to meet margin requirements, exerting some selling pressure on the yellow metal.
⭐️Personal comments NOVA:
Gold prices are consolidating and moving downwards along a trend line, below 5000. Gold prices are consolidating and moving downwards along a trend line, below 5000.
⭐️SET UP GOLD PRICE
🔥SELL GOLD zone: 4940 - 4942 SL 4947
TP1: $4925
TP2: $4910
TP3: $4880
🔥BUY GOLD zone: 4653- 4655 SL 4648
TP1: $4670
TP2: $4690
TP3: $4715
⭐️Technical analysis:
Based on technical indicators EMA 34, EMA89 and support resistance areas to set up a reasonable SELL order.
⭐️NOTE:
Note: Nova wishes traders to manage their capital well
- take the number of lots that match your capital
- Takeprofit equal to 4-6% of capital account
- Stoplose equal to 2-3% of capital account

XRP/USDT | Ripple Weekly Chart Under Heavy Bearish Pressure!By analyzing the #XRP chart on the weekly timeframe, we can see that price has dropped more than 68% from its high at $3.67 and is now trading around $1.174 after a strong dump. I expect this bearish move to continue in line with the broader market and Bitcoin.
The first demand zone ahead is between $0.90 and $0.94, while the second and most important demand area sits between $0.48 and $0.56. The downtrend is very strong right now, and this chart will be updated step by step as price moves.
Please support me with your likes and comments to motivate me to share more analysis with you and share your opinion about the possible trend of this chart with me !
Best Regards , Arman Shaban

IT's A Buy...Looks Like a good opportunity to start accumulating here for long term - starting to buy with the idea of I'm holding for a few years and we're not far off a cycle bottom here.

SILVER | Strong Dollar and Profit-Taking Trigger SelloffSILVER | Speculators Retreat as Strong Dollar Pressures Metals
Silver fell sharply as speculators took profits following a short-lived recovery rally. A stronger U.S. dollar and easing geopolitical tensions added further pressure on precious metals, with silver TVC:SILVER dropping more than 11%, highlighting ongoing extreme volatility in the market.
The recent price action reflects a market still searching for equilibrium after the historic swings seen in recent sessions.
Technical Outlook
Silver maintains a bearish structure while trading below the 80.13 pivot.
As long as price remains below 80.13, downside pressure is expected toward 71.38, followed by 66.62.
A 1H candle close above 80.13 would signal a bullish corrective move toward 83.28, with further upside toward 85.40.
Key Levels
• Pivot: 80.13
• Support: 71.38 – 66.62
• Resistance: 83.28 – 85.40

IREN | WeeklyNASDAQ:IREN — Quantum Model Projection
Technical Update | Bullish Alt. Scenario 📈
As highlighted in previous analysis, NASDAQ:IREN has pulled back toward the 0.786 retracement, developing a Minor Wave 2 corrective structure this week.
This price action remains consistent with a healthy retracement within the broader bullish framework rather than a shift in trend.
🔖 This outlook is derived from insights within my Quantum Models framework. Within this methodology, Q-Targets represent high-probability scenarios generated by the confluence of equivalence lines. These Quantum Structures also serve as structural anchors, shaping the model's internal geometry and guiding the evolution of alternative paths as price action unfolds .
#CryptoStocks #CryptoMining #QuantumModels

TheGrove | USDJPY Buy | Idea Trading AnalysisEURJPY is moving on Resistance AREA..
The chart is above the support area, which has already become a reversal point twice.
We expect a decline in the channel after testing the current level and moving to resistance line
We expect a decline in the channel after testing the current level
Hello Traders, here is the full analysis.
I think we can soon see more fall from this range! GOOD LUCK! Great BUY opportunity USDJPY
I still did my best and this is the most likely count for me at the moment.
-------------------
Traders, if you liked this idea or if you have your own opinion about it, write in the comments. I will be glad ⚜️

BTCUSD · 30M – Liquidity Sweep → Bullish RecoveryBITSTAMP:BTCUSD
BTC swept sell-side liquidity aggressively, forcing stops and triggering panic selling. After the sweep, buyers stepped in strongly, reclaiming key structure and printing a bullish break. The recovery shows acceptance above demand, suggesting a corrective bullish move toward higher resistance zones within the broader range.
Key Scenarios
✅ Bullish Case 🚀 → 🎯 Target 1: 71,000 → 🎯 Target 2: 75,000
❌ Bearish Case 📉 → Loss of the BOS/demand zone may lead to a revisit of liquidity lows.
Current Levels to Watch
Resistance 🔴: 71,000 – 75,000
Support 🟢: 65,800 – 66,300
⚠️ Disclaimer: This analysis is for educational and informational purposes only. It is not financial advice. Please conduct your own research before trading.

The price of gold is continuing to decline!Strong bearish move.
No opposite signs.
Currently it looks like a pullback is happening.
Expecting bearish continuation until the two strong resistance zones hold.

Approaching A Bottom?We're Currently at oversold levels on the weekly that are in line with previous cycle bottoms - Going forward I see the best course of action is to start scaling in spot buys with the plan of holding for 2-3 years - I can see the potential for more downside but overall 60k levels looks like the area we bottom - Yes it can always get worse but fortune favors the bold - Viewing everything logically it makes sense we bottom soon as sentiment is at extreme fear and there is a lot fud around BTC currently gl.

Silver (XAGUSD) – Short-term Flush Before Bullish ContinuationSilver is currently trading inside a corrective structure after a strong impulsive sell-off. Price is reacting below the key resistance zone around 81–83, showing weakness and a lack of bullish follow-through.
🔹 Bias: Short-term bearish → medium-term bullish
🔹 Timeframe: Intraday (15m)
Scenario:
Price is likely to continue lower toward the liquidity zone around 71.30, where previous lows and RSI support align.
This move would complete a downside sweep and relieve momentum.
From that area, I expect a bullish reversal and continuation toward 82+, and potentially higher if momentum expands.
Confluence:
Liquidity sweep at lows
RSI support holding near oversold levels
Corrective structure within a broader bullish recovery
Clear risk-to-reward setup
⚠️ Invalidation: A strong acceptance above 83 before the sweep would weaken the bearish leg.
📌 This is a projection, not financial advice. Always manage risk.

Anthropic Retail News False InformationAI technology is vast and will impact almost every one of the 130+ industries in the US.
The news of Anthropic threatening software companies and big tech companies, such as AMZN and GOOG, was false news.
Anthropic's new technology is specifically designed for regulated industries such as the Financial Industry.
However, if you study the charts for NYSE:CRM , NOW, and WDAY, you will see that this sub industry of the software application industry had already been in a Bear Business cycle, as these companies had reached the MARKET SATURATION PHASE of their business Service or Product Cycle.
ALL companies have business cycles. These software companies are not selling down due to a risk of Anthropic's new AI but due to a tactic used by Sell Side Institutions and Hedge Funds to scare small funds managers into selling in panic mode using VWAP, Volume Weighted at Average Price, which accelerates the runs down, creating higher revenues for the Sell Side and Hedge Funds that are selling short and then buying to cover.
Learn how to avoid retail news that creates a sink hole of losses for most retail traders. Do not trust retail news, it is wrong most of the time, OR late in giving you that information.

MNQ Daily Analysis - Tuesday February 3 2026 part 1As a learning, beginner day trader I go through the market replay predefining what I am looking for to enter a trade and walk through my thoughts as I experience the market action bar by bar throughout the entire day to see how I handle various events and assess my execution.
This is for me and others to learn if you desire.

Bitcoin is Dumping | Price is Oversold | Expect a Sharp PumpLooking at $50K area for some kind of bounce to happen if we keep on tanking like this. The RSI is oversold and so is all the major indicators.
Expect a pump or at minimum a strong short squeeze to happen....
