BTC/USDT Chart Review📉 Key Levels (from the chart)
🟥 Support Levels
1. 90,402 – current, very important
• Local pivot
• Price is reacting, defending
2. 89,112 – strong structural support
• Convergence: horizontal + trend line
• Loss = change in short-term bias
🟩 Resistance Levels
1. 92,659 – closest resistance
• Rejection zone after a correction
2. 94,525 – high impulse
• Breakout = trend continuation / ATH attack
⸻
📊 RSI Stochastic
• RSI Stochastic has exited the oversold zone (0–20) very dynamically
• Currently close to / in the overbought zone (80–100)
👉 Conclusion:
• Short-term: risk of a pullback
• Trend: this is a sign of strength, not weakness, as long as the price holds Support
⸻
🧠 Scenarios
🟢 Scenario 1 – BULLISH (baseline)
• Price maintains 90,400
• Consolidation → breakout 92,659
• Targets:
• 94,500
• Next: 96,000+
📌 This is a healthy correction in an uptrend.
⸻
🟡 Scenario 2 – Technical Pullback
• Rejection from 92k
• Downtrend to:
• 90,400
• Max 89,100
• Until there is an 8-hour candle close below 89,100 → trend remains OK.
⸻
🔴 Scenario 3 – Bearish (less likely)
• Strong 8-hour close below 89,100
• Trendline breakout
• Then:
• 87 500 – 86,800 as the next demand zone
Trendbasedfib

LINK/USDT 1W Chart Long-Term📌 PRICE STRUCTURE
Long-term trend: still up, confirmed by the ascending trendline (orange).
The price respects the trendline – each dip below was bought.
We are now in the midst of a strong upward impulse correction (peak ~$26–27).
🟢 KEY LEVELS
Support
$13.7–14.7 → current demand zone/consolidation
$11.63 → strong HTF support (low of previous reactions)
$7.84 → worst-case scenario (only in the event of a market breakdown)
Resistance
$18.85 → key HTF resistance (mid-range)
$22–24 → supply zone after the last impulse
$26–30 → ATH range/supply zone
📈 PRICE ACTION
Price is consolidating above the trendline → this is bullish behavior
No downward impulse – more likely accumulation
Candles with long downward wicks = supply absorption
➡️ This doesn't look like distribution, but rather a base for a move.
📊 INDICATORS
Stochastic RSI
Was in the oversold zone
Starting to curve upwards → potential buy signal (HTF)
CHOP
Falls to around 40
This indicates the end of consolidation and preparation for a trend
Perfect for an upside breakout in the coming weeks
🔮 SCENARIOS
🟢 BASELINE SCENARIO (most likely)
Sustaining $13.7–14.7
Breakout $18.85
Targets:
$22–24
Next $26–28
📌 Typical range → weekly breakout.
🔴 NEGATIVE SCENARIO
Weekly close below $11.63
Trendline negated
Decline to:
$9–$8
Strong long-term accumulation zone there

ETH/USDT 4H Chart Review1️⃣ Market structure
• Short-term trend: upwards
• The price respects the upward trend line (orange).
• Breakout and maintenance above 3018 USDT → confirmed higher low.
• Currently consolidating under resistance.
➡️ The market is in the continuation phase, not the distribution phase.
⸻
2️⃣ Key Levels
🔴 Support
• 3018 USDT – key flip (former resistance → support)
• 2898 USDT – strong HTF support/structural lows
• Trendline – dynamic support
🟢 Resistances
• 3205 USDT – local resistance / recent high
• 3428 USDT – major HTF resistance (target for breakout)
⸻
3️⃣ Oscillators
📉 Stochastic RSI
• Was overbought, now it's down to around 40-50
• This is a healthy pullback in an uptrend, NOT a sell signal
➡️ Perfect place to continue after re-accumulation
📊 CHOP
• CHOP was falling → the trend was developing
• Now it returns to around 50-55 → consolidation before the move
Very often followed by a directional impulse
⸻
4️⃣ Scenarios
✅ Baseline scenario (more likely)
• Maintenance >3018
• Short consolidation
• Breakout 3205
• Target: 3,428 USDT
📌 Momentum + structure + oscillators = bullish setup
⸻
⚠️ Corrective scenario
• 3205 rejection
• Pullback to:
• 3018
• or trend lines
• Only then does the demand respond
➡️ As long as there is no 4H close < 3018, the trend is NOT broken.

BTC/USD 1h chart review1️⃣ Uptrend broken
• The black upward trend line has been clearly broken down
• This is a change in the market structure (HH/HL → LH/LL)
• It's not just the wick - the candles have closed below
➡️ Short-term bias: bearish
⸻
2️⃣ Strong downward impulse
• One long falling candle + continuation
• No immediate rebound = weak demand
• This looks like a distribution + dump, not a correction
⸻
3️⃣ Key Levels (from your lines)
🔴 Resistances (now SELL / short area):
• 88,520 – 88,800
• 89,000 – 89,200
➡️ Until the price returns and stays above 89k, any upward movement is a pullback, not a trend.
🟢 Support:
• 87,650 (local – already tested)
• 87,400 – 87,200
• 86,750 (very important, lower support)
⸻
4️⃣ Stochastic RSI
• Came out of overbought
• Lines pointing strongly downwards
• There is no bullish divergence yet
➡️ Momentum is still down, no long signal visible
⸻
🧠 Scenarios (Highlights)
🟥 SCENARIO 1 – base (more likely)
Pullback → further decline
• The price returns to around 88,200 – 88,600
• Rejection (lack of volume, weak candles)
• Next move down:
• 🎯 87,200
• 🎯 86,750
➡️ This is a classic break & retest
⸻
🟨 SCENARIO 2 – consolidation
• Price holds 87,400 – 88,200
• Lack of volume
• “Grinding” before the next move

ETH/USDT 4H Chart Review🧭 Current Market Structure
Medium-term trend: up, but at risk
The price has broken below the uptrend line (black diagonal).
After a strong upward impulse, a sharp downward candlestick (distribution) appeared → no continuation of the uptrend.
This is a classic signal of bullish weakness, not a full trend reversal, but a warning.
🔑 Key Levels
🟢 Resistance
3059–3070 – very strong resistance (multiple reactions)
3126 – higher timeframe resistance (if it reaches this level → euphoria)
🟡 Decision Zone (now)
2938–2960 – current consolidation
This is where the market decides whether to return above the trend or move lower.
🔴 Supports
2911 – local support (very important)
2868 – strong structural support
2755 – critical support (reversal of the uptrend)
📉 RSI Stochastic
A pullback from the upper levels (80+) to ~20
Downward momentum has not yet expired
No bullish divergence → no signal for an aggressive long
📌 Scenarios
🔵 Scenario A – bullish (less likely)
Conditions:
Defense 2911
Return above 2960 + 4-hour candle close
Trend line reclaim
Targets:
3059
3126
👉 This would be a fake breakdown
🔴 Scenario B – bearish (more likely)
Conditions:
4-hour close below 2911
No quick rebound
Targets:
2868
then 2755
👉 Healthy correction in the trend or a change in structure to sideways/bearish

ETH/USDT 4H Chart Review🔎 Market Structure
Medium-term trend: downward
The price is moving within a descending channel (orange lines).
Each upward breakout has been corrected lower so far.
Current: consolidation after a strong rebound from the low.
📉 Key Levels
🔴 Support
2925 USDT – very important local support (currently being tested).
2756 USDT – strong support from the previous reaction.
2600 USDT – last line of defense (structural low).
🟢 Resistance
3057 USDT – key resistance + near the moving average (SMA).
3225 USDT – strong supply reaction level.
3346 USDT – upper range of the structure, very strong resistance.
📐 Moving Average (green)
Price below the SMA → market still under supply control.
Until the 4-hour period closes clearly above ~3057, any upward move is a correction, not a trend change.
📊 Stochastic RSI
There was an overheating (80+), now a downward turn.
This is a cooling signal, possible:
a sideways correction,
or another decline to support.
🧠 Scenarios
🐻 Baseline scenario (more likely)
Rejection from the downward channel.
Retest of 2925 → if it breaks:
2756
and in an extreme case, 2600.
🐂 Alternative scenario (bullish)
Breakout of 3057 + close of the 4-hour candle above.
Targets:
3225
3346
Condition: Breakout from a descending channel (not just a wick).

BTC/USDT 1H Chart Review📌 MARKET CONTEXT
Higher timeframe trend (H4/D1): correction in an uptrend
Current (1H): consolidation below resistance after a strong rebound
Price is squeezed between:
descending trendline (blue)
local support ~87.5–88k
This is a classic decision zone.
🟦 PRICE STRUCTURE
What we see:
Strong rebound from ~85.4k
Higher lows (orange line) → local uptrend
Price fails to break:
~88.7–89.0k (green zone)
➡️ Rising low + ceiling = triangle / compression
🟥 KEY LEVELS
🔴 Support:
88,130 – local micro-support (now being tested)
87,477 – very important (H1 structure)
86,880 – critical (loss = bias change)
85,447 – impulse low (bulls' last line of defense)
🟢 Resistance:
88,770 – first hard resistance
89,934 – key (range high)
90 770 – only after the structure is broken
📉 TRENDLINES
Blue (downtrend): still respected ❗
Orange (uptrend): acts as dynamic support
➡️ Breaking these two lines = strong move (up or down)
📊 STOCH RSI
Was overbought
Now reversing down
No bullish divergence
➡️ Short-term: cooling / possible pullback
🧠 SCENARIOS (specific)
🟢 SCENARIO 1 – BULLISH (less likely, but strong)
Conditions:
H1 candle close above 88,800
Breakout and hold above the blue trendline
Targets:
89,900
90,770
Retest 88.7k = perfect long
🔴 SCENARIO 2 – BEARISHES (more likely now)
Conditions:
Rejection of 88.7k
H1 close below 87,470
Targets:
86,880
85,450
This would be a healthy pullback to the structure, not the end of the bull market.

ATOM/USDT short-term🔍 Market Structure
Clear downtrend – price is moving within a descending channel (lower highs and lows).
Each bounce is sold at the upper band of the channel.
No signal of a change in structure yet (no HH + HL).
📉 Current Price Status
Price is at the lower end of the channel.
Consolidation after a downward impulse → typical bearish continuation or short technical rebound.
Current Zone:
~2.02–2.05 USDT – local support + demand reactions.
🟢 Key Levels
Support
2.049 – local support (current reaction)
1.999 – strong psychological support
1.951
1.878 – lower demand zone (important!)
Resistance
2.099
2.125
2.201 – key resistance / S→R flip.
Upper channel line (~2.20–2.23)
📊 Stochastic RSI
Oscillator often in oversold territory.
Currently recovering from the low → possible short rebound.
BUT: in a downtrend. The Stoch RSI is not a long-term signal.
➡️ More likely a pullback, not a trend change.
🧠 Scenarios
🔴 Baseline scenario (most likely)
Bounce to:
2.09 → 2.12
Rejection + further decline:
1.99
then 1.95 / 1.88
➡️ Short at resistance levels in line with the trend.
🟢 Alternative scenario (less likely)
Breakout of 2.20 + close of the 1H candle above the channel
Retest from above
Then targets:
2.28
2.35–2.40
➡️ Only then can we talk about a change in structure.

BTC/USD 4H Chart🔎 Market Structure (4H)
Medium-term trend: still up, but clearly weakening
Price has broken out of the local uptrend channel (black line broken)
Currently, we have a downward impulse + attempted demand reaction
This looks like a distribution → SL breakout → seeking demand lower
🧱 Key Levels (from your chart)
🟢 Resistance (now selling)
89,255 – first local resistance (now S/R flip)
91,857 – strong resistance, previous consolidation
93,713 – supply zone / last LH
94,700–95,000 – very strong resistance (high range)
👉 Until we return and close the 4H period above 91.8k, longs are counter-trend
🔴 Support (most important)
87,621 – currently being tested / very important
84,216 – key HTF support (must-hold for bulls)
81,308
77,820 – deep range low
📉 Momentum & price action
Last candle: strong decline + long lower wick
= demand reaction, but no confirmation
No 4H HH/HL structure yet
This looks like a dead cat bounce or a retest of the breakout
📊 Stoch RSI
Was heavily oversold
Now a sharp upward move
⚠️ But:
In downtrends, the Stoch RSI often gives false long signals
Price confirmation is needed, not just an oscillator
🧠 Scenarios (specific)
🟡 Scenario 1 – Base case (most likely)
Pullback → further decline
Bounce to 89.2k – 90k
Rejection
Down to 84.2k
Market decision there
👉 This is a textbook retest of a broken structure
🟢 Scenario 2 – Bullish (less likely, but possible)
Conditions:
4-Hour Close > 91,857
Then a retest of the high-low
Then targets:
93.7k
94.7–95k
Only above 95k does the full uptrend resume
🔴 Scenario 3 – Bearish (if demand breaks)
If:
4-Hour Close < 87.6k
Then:
A quick move to 84.2k
Breakout = 81.3k
Extreme: 77.8k

TECHNICAL ANALYSIS – BTCUSD (4H)1. Market Structure: Ascending Channel (Orange)
The chart clearly shows an ascending trend channel – the upper and lower orange lines.
Lower Channel Support: ~$87,000
Upper Channel Resistance: ~$96,000
Medium-term trend = uptrend as long as the price remains within this channel.
2. Key Levels You Have Marked
Resistance
$94,133 – local resistance from which the price recently rejected.
$95,866 – upper boundary of the resistance zone + near-upper channel line.
$99,067 – high target upon channel breakout.
Support
$92,190 – price is currently within this zone, struggling to maintain it.
$90,757 – important intraday support; a breakout opens the way lower.
USD 88,203 – strong support, converging with the lower part of the channel.
3. Price action
Currently, I see:
Rejection from the 94.1k level, which is resistance.
Attempt to return to the center of the structure, but the candlestick is rejected from above.
The market is making a short-term lower high → slight weakening of momentum.
4. Stoch RSI
Stoch RSI (4h):
The lines are in a downward trend from the upper levels, meaning a short-term correction is just beginning.
There is no signal for an upward reversal yet → momentum favors a move to lower support levels.
⭐ 5. Scenarios for the next hours/1–2 days
BULLISH (if BTC maintains 92k–90.7k)
Condition: No break below $90,757
Potential moves:
Consolidation at 92k–91k
Stoch RSI begins to curve upward
Attack:
$94,133
$95,866 (upper channel resistance)
Target:
→ $96,000
→ possible test of $99,000 with a strong breakout
BEARISH (if BTC breaks $90,757 down)
This is a key level. If it breaks:
A quick decline to $88,203
High probability of a retest of the lower channel line (~87k)
This still won't destroy the uptrend, but it will open the door to buying lower.

ETH ANALYSIS – 1h📊 ETH ANALYSIS – 1h
🔥 1. Key Fact on the Chart
We have a very strong upward impulse that:
Breaked the upper band of the descending channel (blue)
Touched the upper line of the ascending channel (orange)
Was immediately rejected (long wick)
The MACD shows extreme overbought + potential divergence in the making
Such a move usually indicates a short squeeze + profit-taking → i.e., a temporary weakening and a retest of the breakout.
🎯 2. Price areas I see on your chart
Green (resistance/TP for longs):
3479–3490 – structural highs, strong resistance
3420 – local resistance
3375 – first real resistance after the breakout
Red (support/defense levels of the structure):
3338–3348 – first test zone after the breakout
3293 – key level — sustain = trend continuation
3180–3200 – consolidation zone broken (likely retest)
📉 3. What does the current wick mean?
This giant wick signals:
short liquidations
lack of demand for a continuation after the first resistance breakout
high probability of a return to the range
possibility of a retest of the breakout (around 3185–3210)
This doesn't look like a classic breakout with a continuation, but rather a fakeout and the need for a correction.
📈 4. Scenarios
➡️ Bullish (more likely if 3293 holds)
Price falls to the 3338–3293 zone
Builds a local HH/HL
Starts a move to 3375, then 3420
If 3420 breaks → target 3480–3500
➡️ Bearish (if price loses 3293)
Retest from the bottom of 3293
Return to the blue channel
Target: 3185–3200
If this level breaks → 3050–3080 (lower band of the channel)
📟 5. MACD
MACD is:
extremely stretched
signal line begins to collapse
histogram decreases after Explosion
→ This almost always means a local intraday high + a drop to support.

ETHUSD 1D chart1️⃣ Trend and key levels
Trend
• The overall neutral-growth trend, but with clear consolidation.
• The price rebounded dynamically from the bottom (approx. USD 2,850), which creates the first higher low structure → the potential beginning of an upward impulse.
Support
• $2,973-$3,000 – SMA #1 + local support.
• USD 2,851 – strong support from which the candle made a very large wick upwards.
Resistances
• USD 3,169 – the first strong resistance, several candles bounced from this level.
• $3,236 – key daily resistance. Breakout = signal of strong momentum and opening the way to USD 3,300-3,430.
⸻
2️⃣ Candle formation and behavior
• A bullish candle with a long lower wick appeared → this is a signal of buyers.
• The price is making a series of higher lows, but no higher high yet → the market is waiting for a breakout of USD 3,236 to confirm the uptrend.
⸻
3️⃣ SMA (moving averages)
🔴 SMA #1 (short-term)
• Price is just above it → acts as support.
• If the daily candle closes below $3,000, the downside momentum returns.
🟢 SMA #2 (long term, ~$3,430)
• Is high above the price → long-term bearish pressure until the price returns to the price area.
⸻
4️⃣ RSI (momentum)
RSI around 45–50
• Neutral territory.
• Zero overbought/oversold.
• Slight upward trend in RSI → buyer momentum is growing, but without an overheating signal.
Conclusion: The market has room to move higher before the RSI becomes high.
⸻
5️⃣ MACD
• MACD is above the signal line → slight, early bullish signal.
• The histogram increases, but there is no significant acceleration.
Interpretation: increases are possible, but without strong momentum yet.

BTC/USDT 4H Chart 🔍 MARKET STRUCTURE
The chart shows a broad ascending channel in which BTC has been moving for several days:
Lower trend support: ~$87,500 – $88,000
Upper trend line: ~$94,500 – $95,000
The price has clearly rebounded from around $89,200, an important demand level.
📈 KEY LEVELS
Support
USD 89,284 – local support from which a rebound occurred
USD 87,804 – the next, much stronger support level consistent with the trendline
Resistance
USD 91,466 – currently being tested
USD 94,141 – key resistance and the upper band of the channel
📊 CHART SITUATION (4 hours)
1. Price action
The price has made a strong upward impulse from support at USD 89,280.
It is currently reaching local resistance at USD 91,450 – USD 91,700.
If this level is broken, the target is USD 94,000 – USD 94,500.
If it fails, a pullback to USD 90,200/USD 89,300 can be expected.
📉 MACD
Your MACD shows:
Bullish crossover – buy signal.
The histogram changes from red to green → momentum is increasing.
The curves are diverging, confirming the strength of the move.
This indicates that the short-term trend is turning bullish.
📌 TWO TRADING SCENARIOS
🟢 BULLISH Scenario (more likely)
Condition: H4 candle breakout and close above USD 91,700.
Targets:
TP1 → USD 92,800 – USD 93,200
TP2 → USD 94,000 – USD 94,500 (upper channel)
Stop-loss (if you were going long):
below USD 90,500
Safer below USD 89,280
MACD confirms this scenario.
🔴 BEARISH Scenario
Condition: rejection of USD 91,700 and a close below USD 90,500.
Targets:
TP1 → USD 89,300
TP2 → USD 87,800 (key trendline)
A drop to USD 87,800 would be an ideal place for large players to buy again.

BTC 4H Chart Review1. Market Structure: Rising Channel (Upward Wedge / Rising Channel)
The chart clearly shows that BTC is moving within an ascending channel, with:
the upper boundary around USD 95,000–95,500,
the lower boundary currently reaching USD 86,500–87,000.
This is a potentially exhausting formation, and lower breakouts are often dynamic.
2. Current Situation: Rebound from the upper band and Stoch RSI overbought → decline
The price has stopped exactly at the upper resistance of the channel and has begun a correction.
This is typical behavior – the market usually returns to the middle or lower edge of the channel.
Stoch RSI on 4H – has made a strong reversal from the overbought zone
→ a signal for a short-term correction has already been generated.
3. Support Levels (most important):
🔴 USD 90,500–90,000
A very important zone – previous resistance ⇒ now support.
Breakout = increased risk of a deeper breakout.
🔴 USD 88,500–88,000
A strong demand level for the 4-hour period, also aligned with the MA and local lows.
🔴 USD 86,500–87,000
The lower band of the channel – the most likely place for buyers to become active.
4. Resistance Levels:
🟢 USD 94,800
Previous local high – a breakout will be bullish.
🟢 USD 98,000–98,900
Strong resistance on the chart, likely target after a breakout of the channel to the upside.
5. Scenarios for the coming hours:
📉 Correction scenario (more likely based on the Stoch RSI)
The price could fall to one of the following zones:
92,000 → test in progress
90,500–90,000 USD → main market decision level
If it loses 90,000 → a move to 88,500–88,000 is natural.
Deeper correction: test of the lower channel line – ~86,500 USD.
In this scenario, we remain in an uptrend unless the channel breaks below.
📈 Uptrend scenario
The current decline could only be:
a local correction,
a retest of the previous demand zone.
Uptrend condition:
➡️ 4-hour candlestick retracement and close above ~94,000 USD.
Then the target:
94,800
95,500
and after the channel breakout → $98,000–$99,000

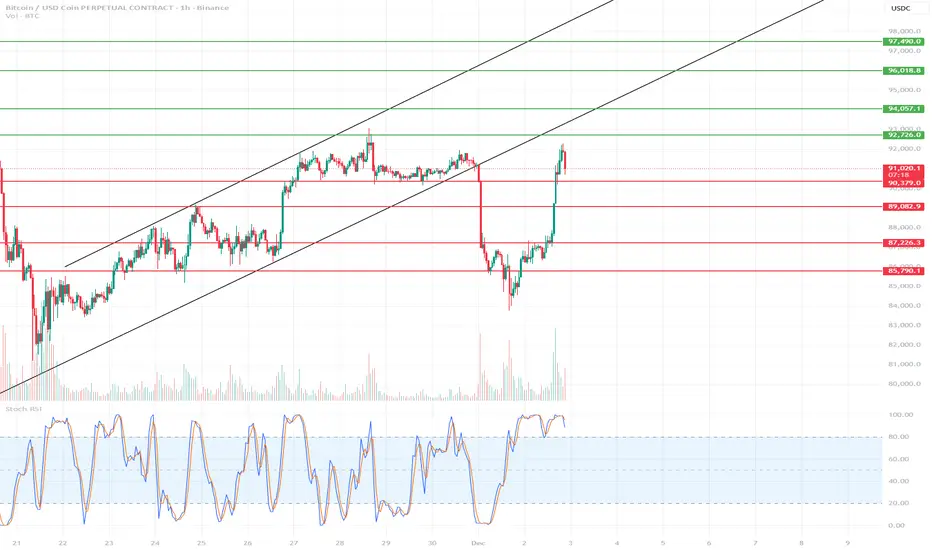
BTC Short-Term Chart 1H🔍 1. Current Market Situation
BTC has made a very strong rebound from around ~87,000 and reached the key resistance zone of 92,700–93,200, where the first signs of a slowdown are currently visible.
The Stoch RSI on the 1-hour timeframe is heavily overbought, which usually suggests a local correction or at least consolidation.
🔴 2. Key Resistance Levels (Short-Term)
92,726 → current resistance; the price has rebounded precisely from this zone.
94,057 → next strong resistance if BTC breaks above 92.7k.
96,018–96,866 → strong supply zone; only after breaking this zone will the uptrend resume in full force.
🟢 3. Major Supports (Short-Term)
90,379 – 90,990 → nearest intraday support zone
89,082 → strong support that halted the previous decline
87,726 → key to the upward structure
85,790 → critical level, a breakout opens the door to a deeper correction
📉 4. Short-Term Baseline Scenario
Most likely in the coming hours:
✔ Scenario A – correction from the current level (preferred)
Stoch RSI overbought
Price rejected from the 92.7k resistance
Large vertical move → market needs to cool down
Correction Targets:
90,900–90,300 → first TP/buy zone
89,100 → deeper correction but still healthy.
Long signal:
Return of h1 candle closes > 91.3k after a pullback.
✔ Scenario B – breakout of 92.7k and continued growth
If BTC breaks and holds above 93,200, upward momentum resumes.
Targets:
94,057
96,000–96,800 (strong supply zone – take profit area)
BTC/USDT 4H Chart Review🧭 1. Main Market Structure
The chart shows:
A broad downward channel that has been in place since the end of October.
The price bounced off the upper line of the channel, made a local upward impulse (orange trend line), and then broke it, returning back towards the lower regions of the channel.
➡️ This means that the dominant trend is still downward, and upward bounces are corrections.
🧨 2. Current Chart Situation
BTC has broken through:
the local uptrend (orange line)
fell below the 88,500–89,000 zone (green)
is heading towards further support levels
Currently, the price looks like a typical retest of the broken structure and a continuation of the decline.
🟩 3. Key Price Levels (S/R)
Resistance (upper – green):
91,600 – 92,000 – key level, a breakout would negate the local downtrend
95,000 – 97,500 – upper range of the descending channel
Support (lower – red):
85,300 – 85,800 – local support (price is currently reacting here)
83,000 – 83,100 – strong horizontal support
79,800 – strong support, historically strong in this timeframe
76,600
75,000 – lower band of a potential drop + near the lower boundary of the channel
➡️ The most logical downside targets are 83,000 and 79,800.
📉 4. Descending Channel (black) (lines)
The price has rebounded from the upper range of the channel and is heading towards the lower range.
The middle line of the channel has been broken down → a signal of trend continuation.
The lower boundary of the channel indicates a potential low around 75,000–78,000.
🔄 5. Stoch RSI
Currently oversold in the oversold zone, it is starting to curve upwards.
In a downtrend, long signals are weaker, but a short-term rebound is possible.
🧭 6. Scenarios
📉 Bearish scenario (more likely)
Technical rebound to 88,500 – 89,000
Rejection from this zone → continued decline
Targets:
83,000
79,800
Extremes: 76,000 – 75,000
➡️ This scenario is consistent with the trend and a rebound from the upper channel.

BNB/USDT ANALYSIS - 4H interval🔶 1. Current Trend and Market Structure
The chart shows:
A clear short-term uptrend – the price is respecting the ascending yellow trend line.
An increase after a bounce from the SMA 50 (green).
However, there are still no new higher highs – the market is consolidating between 888–910.
➡️ Short-term trend: up
➡️ Medium-term trend: neutral/consolidation
🟩 2. Key Support/Resistance Levels
Resistance:
910–912 USDT – currently a key resistance, tested multiple times.
930–935 USDT – local higher resistance (green zone on your chart).
957–960 USDT – stronger resistance from D1 (blue SMA95 visible in the screenshot).
Supports:
USDT 889–893 – local support and the current battleground.
USDT 871 – SMA 50 + previous swing low.
USDT 849 – powerful support from the HTF.
USDT 837 – the final “lifeline” of the bullish structure.
📈 3. Indicators (MACD, RSI)
MACD
MACD > 0 – positive.
The MACD line is starting to point upwards → a signal of bullish momentum.
No divergence.
➡️ MACD supports the bullish scenario.
RSI
RSI ~59 – a healthy zone, far from overbought.
RSI breaks the local downtrend → increasing buyer strength.
➡️ RSI confirms the bullish trend.
🟧 4. Key Price Action Now
The price is currently approaching resistance at 910–912 USDT and simultaneously touching the local trend line.
This is the market's decision point.
A breakout → opens the way to 930–935.
A rejection → a return to 889, and below 871.

BTC Short-Term 15m Chart📉 BTC 15M — Short-Term Analysis
1. Key Levels from the Chart
Support
$90,400–$90,450 – strong, repeatedly tested (orange zone).
$90,178 – lower support (thin red line).
$89,460 – deeper daily support.
Resistance
$90,900–$91,000 – local resistance zone.
$91,214–$91,545 – SMA 72 / SMA 200 (yellow and blue) = strong dynamic resistance.
$91,800–$92,200 – higher structural resistance.
🧠 2. Market Structure
Short-term trend (15m)
Price remains below the SMA 200 and SMA 72 → bearish momentum.
Lower highs and lower lows are visible → bearish structure.
Narrower range: 90,400 – 90,900 → price compression / consolidation.
📊 3. Indicators
MACD – neutral / slightly bearish
Histogram hovers around zero → lack of strong momentum.
Recent downward crossover → downward pressure.
RSI – 48 (neutral)
Not oversold yet, but:
RSI is forming a bearish divergence from previous highs.
RSI often bounces from 50 in a downtrend → confirms bearish pressure.
🔎 4. What's happening now?
The price is retesting the $90,400 zone, a key defensive level for bulls.
The structure indicates:
supply pressure,
buyers exhausting themselves below the 200 SMA,
possible breakout below if 90,400 breaks.
🎯 5. Short-Term Scenarios (15m)
🔻 Bearish Scenario (more likely)
If 90,400 falls:
Target 1: 90,180
Target 2: 89,460
Target 3: 88,960
The structure strongly suggests this because:
Price below the 200 SMA
Weak momentum
No strong rebound from the lows
🔼 Bullish Scenario (only after breaking 90,900)
If the market rebounds from 90,400 and breaks 90,900:
Target 1: 91,200 (SMA 72 + 200)
Target 2: 91,550
Target 3: 91 800

QUICK ANALYSIS (1H) — BTC BOUNCED FROM RESISTANCE✅ 1. Breakout from the downward trendline
On the chart, I see:
a yellow downward trendline—it has been broken,
the candlestick dynamically breaks through it and closes above it.
➡️ This is the first signal of a shift in momentum to upward.
✅ 2. Price is testing the 200 SMA (blue)
BTC is currently:
touching the 200 SMA,
bounces slightly downward—a classic reaction to strong resistance.
➡️ Until we break through the 200 SMA, the market remains in a downtrend.
🟩 3. Nearest resistance levels (green levels on your chart):
90,400 USDT – current resistance (reaction already visible)
92,500 USDT – next important level
93,200–94,000 USDT – strong supply zone
94,900 USDT – strong level from previous bounces
➡️ The closer the price gets to 94–95k, the greater the chance of a downward rebound.
🟥 4. Nearest support levels
From your red levels:
88,700 USDT – first level of defense
87,500 USDT – key support
85,500 USDT – major local bottom
84,150 USDT – extreme support
➡️ If BTC returns below 87.5k, the correction will deepen.
📊 5. RSI — Neutral-Bullet
RSI ~ 55,
Not yet overbought,
RSI trend is increasing.
➡️ There is room for further upward movement.
📉 6. MACD — Bullish Signal
MACD has crossed the signal line upward,
the histogram is rising.
➡️ Upward momentum, shorting here is risky.

TECHNICAL ANALYSIS – BTC (4H)📉
1. Main trend – still down
I see a clear downward trend channel (yellow lines) on the chart. The price is moving in the lower half of the channel, which means that supply pressure is still dominant.
2. Rebound, but under strong resistance
The recent upside breakout looks more like a correction in a downtrend than a reversal.
The closest resistance levels I see on the chart:
94,500 – 95,000 → EMA + local level
96,000 – 96,500 → next EMA
98,000 – 99,000 → key level where the SMAs are located
Until BTC breaks above 96,500–97,000, there's no way a sustained trend reversal will occur.
3. Current Reaction at the SMA/EMA
The price touched the red moving average (SMA?) but was rejected—a classic reaction in a downtrend.
This signals:
a lack of buying power,
a predominance of supply in the 93,300–94,500 area.
4. Support Levels I See
At the bottom, you have specific lines that make sense:
89,900–90,000 → key support
89,500 → marked level
87,600–86,500 → lower part of the channel + previous bounce
If BTC loses 89,500, a move to the 87,000–86,500 area is very likely.
5. MACD – early, but cautious signal
The MACD has started to move up, but:
there is no clear crossover yet,
the histogram is weak.
Interpretation:
The rebound continues, but there is no confirmation of a trend change.
6. RSI – slightly bullish, but neutral
RSI ~49, so:
it is not oversold,
it is not overbought,
there is room for both a further rebound and a decline.
The RSI does not provide a strong directional signal.
📌 Summary – what looks most realistic?
Baseline scenario (60% chance): continued decline
Price will rebound to:
94,000–95,000,
possibly to the upper band of the channel (95–96K),
and be rejected → a decline to 89,500, and then 87,000–86,500.
Bullish scenario (40%): breakout of the channel
We need to see:
a 4-hour candle close above 96,500,
preferably a retest and hold,
only then can we talk about a trend reversal and a move towards 98,500–100,000.
📈 Market assessment (neutral–bearish)
Everything indicates that we are only in a correction within the descending channel. Until BTC breaks ~96.5K, the advantage is on the bears' side.

BTC/USDT 1H Short-Term (maintaining support)📉 MARKET STRUCTURE
1. Trend
The chart shows a clear falling wedge, which statistically is a pro-growth pattern—breakouts most often occur upwards.
Upper wedge line: ~96,400 USDT
Lower wedge line: ~93,750 USDT
The price has just rebounded from the lower edge—this is a key demand level.
📊 SUPPORT AND RESISTANCE LEVELS
Support (demand):
93,750 – lower wedge line
93,300 – strong chart level
92,650 – lower support, strong volume reaction
Resistance (supply):
95,000 – 95,450 – local resistance (supply often returns here)
96,400 – resistance key + upper wedge line
📈 INDICATORS
Stoch RSI (1h)
We have rebounded from the oversold level.
The %K line is breaking the %D line upwards → a signal of a potential short-term rebound.
MACD
The histogram is decreasing, but the first signs of flattening are visible.
The MACD line is still below the signal line, but is approaching → momentum for a reversal is beginning.
Volume
Volume increased on bearish candles, but near the bottom, two demand candles with increased volume appeared → buyers reacted at support.
📌 CONCLUSIONS
✔️ Bullish short-term scenario (more likely at this point):
Bounce from 93,750 + rising indicators = local upward correction.
Targets:
94,800 – 95,000
95,450
96,400 (upper band of the wedge — an important decision point)
❌ Bearish scenario (if support breaks):
A drop below 93,750 on strong volume opens the door to:
93,300
92,650 (a large defensive level — aggressive demand could enter here)

BTC/USD 1D Chart🧭 Overall Market Picture
Bitcoin is in a medium-term downtrend, as confirmed by:
a descending channel (marked with white lines),
lower highs and lower lows,
price below the key EMA and SMA.
The price is currently testing the upper boundary of this channel, so it will be crucial whether it manages to break out of it to the upside or rebounds further down.
🔹 Key Price Levels
Support:
$100,650 — short-term support, previously seen price reactions.
$98,550 — next demand level from late October.
$96,950 — lower boundary of the descending channel, potential target for continued declines.
Resistance:
$106,300–$106,500 — current resistance (upper boundary of the channel + SMA100).
$109,700–$110,000 — strong resistance converging with the EMA200 and SMA200.
$112,000+ — channel breakout and trend change.
🔸 Technical Indicators
1. MACD
The histogram is starting to turn positive (descending red).
The MACD line is attempting to cross the signal from below — a potential bullish signal, but not yet confirmed.
➡️ Indicates a possible short-term upward correction within a downtrend.
2. RSI (14)
Value: ~40.5 — low, but has rebounded from oversold levels.
No bullish divergence, but the RSI is rising from below, suggesting a potential technical bounce.
➡️ Still more upside than downside before entering the overbought zone.
🔹 Moving Averages
EMA50 (~109,970 USD) and EMA200 (~110,380 USD) are above the price, confirming the downtrend.
The EMA50 < EMA200 cross holds – a classic death cross.
SMA100 (~106,300 USD) has just been tested – a key level that could determine the direction of the coming days.
🔸 Short-Term Scenarios
🟩 Bullish (30–40% chance)
Breakthrough of the upper channel line (~106.5k USD) + daily close above 107k USD.
Confirmation of the MACD and RSI signal > 50.
Targets: 109,700 → 111,500 → 113,800 USD.
➡️ A medium-term trend reversal is then possible.
🟥 Bearish (60–70% chance)
Bounce from the upper channel line and fall below 102k–101k.
Continuation of the downtrend.
Targets: 100,600 → 98,500 → 96,900 USD.
➡️ In this scenario, the market will maintain a lower high/lower low structure.
⚙️ Summary
Trend: Down, but with a short-term rebound attempt.
Key moment: reaction to the 106k–107k USD level.
If the channel with volume breaks, a bullish reversal.
If a rebound, a new low around 97k–99k USD is very possible.

BTC/USDT 1H Chart Short-Term📉 Descending Channel (black lines)
The price previously moved within a clear descending channel, which was broken upward.
A breakout from the channel signals a change in the short-term trend – from supply pressure to an attempted rebound.
From a technical perspective, a breakout from a descending channel often leads to an upward correction, the extent of which is at least the midpoint of the previous downward impulse.
🔷 Triangle Formation (blue lines)
After breaking out of the channel, the price formed a symmetrical triangle (consolidation) – a sign of market indecision.
Triangles of this type are often trend continuation patterns, but in this context – after a breakout from a descending channel – an upward breakout (i.e., a further upward rebound) is more likely.
The key resistance level to watch is $111,145 – a breakout with volume confirmation would open the way to $112,320 and then $113,921.
🧭 Key Technical Levels
Resistance:
$111,145 – local resistance (upper boundary of the consolidation/triangle).
$112,320 – another strong resistance level from the previous local high.
$113,921 – major medium-term resistance.
Support:
$110,442 – lower boundary of the triangle (short-term support).
$108,793 – support after the recent bounce.
$107,285 – next demand level.
$104,969 – bulls' defensive boundary in the broader context.
📊 Stoch RSI (bottom of the chart)
The Stoch RSI oscillator is currently in a rebound phase from the neutral level (~40–60).
If the lines (blue and orange) cross upwards and enter the zone above 80, this could confirm bullish momentum and a breakout from the triangle to the upside.
However, a rejection from 60 and a further drop below 20 would signal a false breakout and a possible retest of USD 108,800.
🔎 Scenario Summary
➡️ Upside Scenario (more likely):
Breakout from the triangle to the upside (confirmed by a 1-hour candle above USD 111,150).
Potential move to USD 112,300 → USD 113,900.
Momentum indicators support a rebound if the Stoch RSI maintains its upward trend.
⬇️ Downside scenario (alternative):
Unsuccessful breakout and return below $110,400.
A correction to $108,800 can then be expected, and if this level is broken, a further decline to $107,300.
