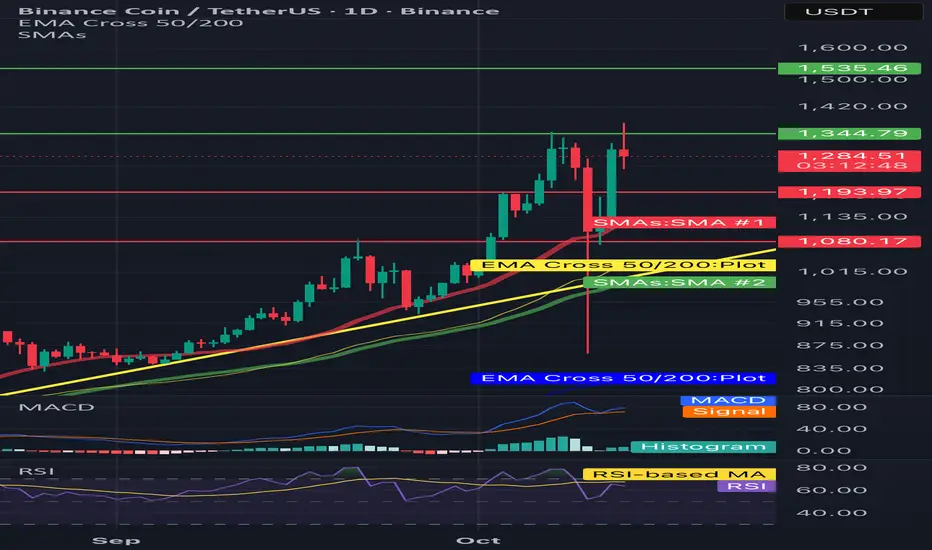
BNB/USDT 1D Chart Review🧭 Key technical levels
Resistances:
• 1,344–1,350 USDT – local resistance (last candle highs).
• 1,535 USDT – strong resistance from previous highs.
Support:
• 1,193–1,200 USDT – first strong support (the reaction of the candles is visible).
• 1,080 USDT – another important level, coincident with the yellow uptrend line and EMA50.
⸻
📊 Technical indicators
1.EMA/SMA:
• The red SMA and yellow EMA show that the medium-term trend is up (EMA 50 > EMA 200).
• The price is currently testing the zone between the SMA and EMA - if it stays above ~1,190-1,200, a rebound may occur.
2. MACD (bottom):
• The signal line (orange) crosses the MACD (blue) from above → bearish signal.
• The histogram is starting to flatten - possible end of correction if it lasts for a few days.
3.RSI:
• RSI around 50-55, neutral → no overbought or oversold yet.
• If the RSI rebounds from 50 upwards, it may mean the price rebounds from support.
⸻
📈 Scenarios
✅ Upward scenario (more likely if it maintains support)
• Maintaining above 1,190 USDT → reflection towards 1,344 and then 1,535.
• Confirmation: daily candle closed above 1,344 + increasing volume.
⚠️ Downside scenario
• Loss of the level of 1,190 USDT → correction to 1,080 USDT (EMA 50 test).
• If this support breaks, the next target is around USDT 950-1,000.
Trendbasedfib
The LINK/USDT will probably go lower📉 Trend and Structure
The price is currently trading within a descending channel (yellow lines), which has been in place since late August.
The price attempted to break out of the channel at the top around $23.40, but buyers lacked strength – it was rejected at resistance and fell back below the downtrend line.
Currently, the price is just below the upper edge of the channel and below the 50/200 EMA, confirming that the medium-term trend remains downward.
🔹 Key Technical Levels
Support:
$21.40 – local support, which is currently being tested.
$20.80 – strong support from previous price reactions.
$19.68 – lower boundary of the channel, a very important level for bulls.
Resistance:
$22.20–$22.70 – zone of the 50/200 EMA and previous rejections.
USD 23.40 – the last local high and the point of the false breakout.
USD 24.90 and USD 25.50 – key breakout levels from the channel, paving the way to USD 27–28.
⚙️ Technical Indicators
MACD:
The MACD line has crossed the upside signal → sell signal.
The histogram has turned slightly negative, indicating a loss of upward momentum.
RSI (14):
Currently around 51, with a slight downward slope.
Neutral, but with a strong upside – a drop to around 40 is possible before the bulls attempt a rebound.
🧭 Scenarios
🔻 Bearish Scenario (more likely)
If the price remains below $22 and the channel is not broken, a further decline to $20.80 is possible, or even a test of the lower band of the channel at $19.70.
Confirmation will be a close of the 4-hour candle below $21.40.
🔺 Bullish Scenario (less likely at this time)
If the bulls reclaim $22.70–$23.00 and close the 4-hour candle above it, a breakout from the channel could occur.
The targets will then be $23.40, $24.90, and $25.50, respectively.
Increased volume and confirmation on the MACD (bullish cross) are required.

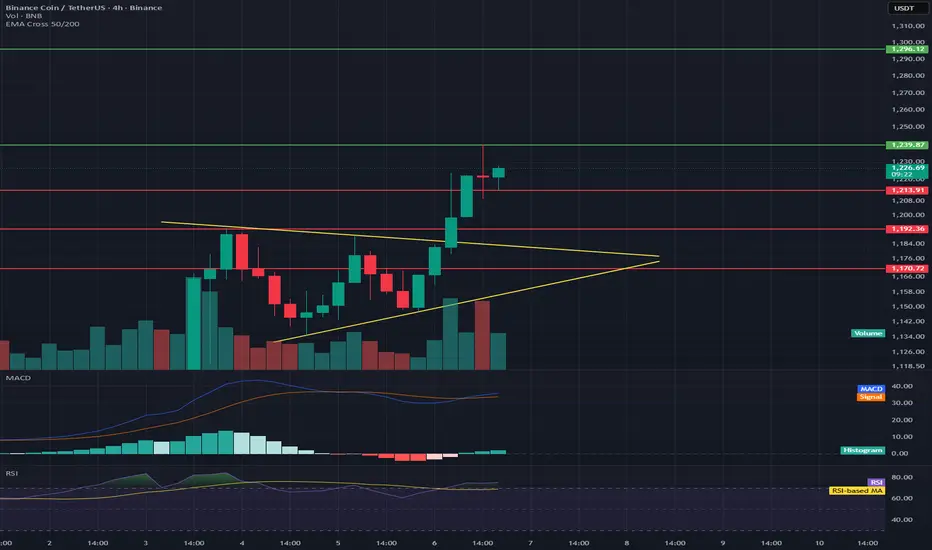
BNB/USDT 4H Chart Review📊 Market Structure
The chart shows a symmetrical triangle (yellow lines) from which a breakout occurred upwards—a classic signal of a continuing uptrend.
The price has broken above resistance at ~$1,210, which now acts as local support.
Current price: ~$1,226, following a dynamic breakout from the triangle.
📈 Key Levels
Support:
$1,210 — Retest after the breakout (important defensive level for bulls)
$1,193 — Previous local support in the triangle
$1,170 — Stronger support and lower boundary of the previous consolidation
Resistance:
$1,239 — Local resistance that has already been tested
$1,260–$1,265 — Next target upon breakout (equal movement or measuring the height of the triangle)
$1,300 — Psychological and technical resistance level
📊 Volume
The breakout was confirmed by a significant increase in volume, lending it credibility.
No sharp drop in volume after the breakout — the market remains in demand.
⚙️ MACD
The MACD is above the signal line and rising, confirming a bullish impulse.
The histogram is positive, but not excessively broad → momentum is healthy, but not overheated.
💪 RSI
RSI: ~75, which is slightly in the overbought zone.
It's worth watching for a short-term correction or retest of the $1,210 level before the uptrend becomes more established.
ETHUSDT 1D chart review📊 1. Main trend
• The chart shows a long -term movement in the inheritance trend channel in which the price is currently fighting for the mountain, but here you can see that the inferior canal limit is a strong resistance for the price.
⸻
🧠 2. Medium walking
• We see the cut SMA 50 and SMA 200 (so -called Golden Cross) - this is an upward signal in day interval.
• EMA 50 (green) is approaching the intersection of EMA 200 (red) - if the growth cross is confirmed, it may mean further growth time.
⸻
💹 3. Horizers of support and resistance
Support:
• 4,034 USDT - strong level, defended after the last inheritance.
• 4,252 USDT - short -term support (after breaking above trendline).
Resistance:
• 4 720 USDT - local resistance, previously rejected several times.
• 4,966 USDT - next strong resistance (local peak).
If ETH pierces 4 720 with a volume, the road opens towards 4,950-5,000 USDT.
⸻
⚙️ 4. Indicators
Macd:
• The histogram grows green → growth momentum.
• The MacD line cut the signal line from the bottom → buy signal.
RSI:
• RSI around 60, which indicates the advantage of bulls, but without buying out.
• If the RSI pierces 70, a short -term pullback may occur.

BTCUSD 1W chart review• Currently BTC is at ~ USD 123,000 (+1.97%).
• Strong support visible in the area of 113 400 USD and USD 106,800.
• The next resistance is USD 124,500, and the next important is USD 133,500.
2. Trend:
• You can see the growing trend line (orange), which supports increases.
• The weekly candle is green and quite strong - suggests that the demand persists.
3. Medium walking (SMA / EMA):
• SMA 50/200 shows the Golden Cross (EMA CROSS 50/200), which is a long -term bull signal.
• SMA (red) is below the price → pro-rectification signal.
4. RSI (Relative Strength Index):
• Currently approx. 60 → Neutral-BYCZECZE territory.
• Not bought yet (> 70), so there is space for further increases.
5. MacD / Histogram:
• The histogram begins to grow green - growth moment is growing.
• This confirms that the buyers are taking over the initiative.
⸻
📈 Scenarios:
1. Bull (greater likelihood at the moment)
• If BTC pierces and stays above USD 124,500, the goal may be USD 133,500.
• Breaking over 133K opens the road even to around 140k.
2. Bear
• If the price does not pierce 124.5k and reject the resistance, it may drop to $ 113,400.
• Punction below this zone will give a signal of declines up to USD 106,800.

Will BTC come out of the downward channel?• In the chart you can see how we are close to the upper limit of the downward channel. This is a key signal - if the breaking persists, it may mean a change in the trend.
• We have several support levels from below (marked with red lines):
• 112,238 USD
• USD 108,981
• USD 107,040
• From the top you can see resistance (green lines):
• 115,266 USD (local resistance - the course is just approaching)
• 117 395 USD
• 119 404 USD
⸻
🔹 Medium walking (SMA/EMA)
• You can see EMA Cross 50/200 (yellow label) - a classic signal "Golden Cross" / "Death Cross". It seems that the average is raised recently, which the market often interprets as a signal of a potential change of trend.
• SMA #1 and #2 (red and green lines) - the course tries to stay above the average, which is positive.
• SMA #5 (blue line below) shows long -term support ~ 107k USD.
⸻
🔹 MacD (below)
• The histogram shows reversal - red posts decrease, and the lines (blue and orange) are approaching each other → possible buy signal.
• If the signal line is intersected up, this will be confirmed by the growth moment.
⸻
🔹 RSI (Relative Strength Index)
• RSI is currently around 40-50 →, i.e. a neutral level (neither purchase nor selling).
• It slightly reflects from below, which suggests that there may still be space for further growth before we enter the purchase zone (> 70).
⸻
📌 Summary
• Short -term (1-7 days): it looks like BTC is trying to stand out from the downward trend. If it pierces 115,266 USD and persists above, subsequent goals are 117 395 USD and 119 404 USD.
• Medium -term (weeks): support levels 112K - 108K are key. A decrease below 107k would negate a bull scenario.
• Technical signals: MacD and RSI give the first signs of reflection. The course balances on the border of breaking the trend.
👉 It looks at the beginning of a potential growth movement, but it will be crucial whether BTC will stay above 115K.

LTC/USDT 1h short term 1. The inheritance channel (orange lines) - the course was in the downward trend, but just struck the mountain from the channel. This is a signal of short -term shift Momentum to upward.
2. Horizers of support/resistance (red and green lines):
• Support: 104.64, 103.15, 101.77 - you can see that the course reflected several times from these levels.
• Resistance: 106.05, 107.85, 109.32 - these levels are now key goals with further increases.
3. STOCHASTIC RSI (bottom of the chart) - is in the purchase zone (above 80). This suggests the possibility of short -term correction, but after struggling from the channel, the momentum can still pull the price higher before the stronger pullback occurs.
⸻
Scenarios:
✅ Taurus (continuation of stroke):
• If the price lasts above 106 USDT, subsequent goals are 107.85 and 109.32.
• Closing a few candles above 106.05 will confirm the burst and gives space for growth.
⚠️ Bear (false breakup):
• If the price does not last above 106 and returns to 104.64, the market may fall again to 103.15 and even 101.77.
⸻
Summary:
• The trend has changed to a short -term upward after having broken out of the downward channel.
• Keeping the level of 106 USDT is key - if it succeeds, there is a chance for an attack 107.85 → 109.32.
• RSI is high, so in a short time it is possible to lightly withdraw before we go higher.

SOL/USDT 1D chart review 1. General trend
• A strong upward trend has been underway since June (orange trend marked).
• Recently, we had a very strong rally to around USD 250, but there was a violent correction.
2. Support and resistance
• resistance:
• USD 214 (local resistance, the market has bounced down here).
• 230 USD (strong resistance).
• USD 250 (peak, main resistance).
• Support:
• USD 193 (here the price is currently fighting).
• 176 USD (another strong support - earlier consolidation).
• USD 158 (key support, fracture could mean a change in the trend).
3. STOCHASTIC RSI
• Currently in the sales zone (nearly 0) → may suggest that the market is approaching a local hole and a potential reflection.
4. Scenarios
• Bullish:
If support is supported at 193 USD, possible reflection in the direction of USD 214, and after breaking this level - an attack on USD 230.
• Bearish:
If the price pierces $ 193 down, the next goal is 176 USD, and below even USD 158.
5. Summary
• The market is in correction after strong height.
• At the moment, the key level is 193 USD. Maintaining this support can be reflected.
• However, breaking 193 will open the road to 176.
• RSI shows the sale → short -term relief.

BTCUSD 4h ShortTerm Chart1. Main Trend
The chart clearly shows a descending channel – the recent upward breakout failed to hold, and the price has returned to resistance.
The pattern of lower highs (LH) and lower lows (LL) continues, likely indicating a break to a lower low.
The recent high at ~$118.3k has been rejected, and the market is heading down.
2. Key Levels
Support (red lines):
$111.426 – currently being tested.
$109.408 – stronger support, previous local lows.
$108.100 and $107.356 – further potential targets if the decline deepens.
Resistance (green lines):
$115.775 – the nearest significant resistance.
$118.322 – the upper boundary of the channel and the previous LH.
USD 122,367 – a key breakout level that would reverse the trend.
3. EMA/SMA
The 50 and 200 EMAs (blue/yellow) show a bearish cross, with the price below the averages → a negative signal.
The 200 SMA (~USD 114,137) acts as strong resistance, currently unbroken.
4. Indicators
MACD: lines strongly below the line, histogram rising in the negative zone → a downtrend with a predominance of supply.
RSI: ~33, close to the oversold zone (<30), which could result in a short-term rebound, but there is no upside divergence yet.
5. Scenarios
🔴 Bearish (more likely)
Continuation of the downward move towards 109.4k → 108k → 107.3k.
A break below 107k opens the way to 103–105k (LL2 on the chart).
🟢 Bullish (less likely)
A defense of 111.4k and a return above 114.1–115.7k.
A break above 118.3k would negate the downtrend and open the way to 122k+.

BNB/USD 1D Chart Review UpTrend1. Trend Structure
The price was in a long-term uptrend (marked by the orange lines).
The last breakout occurred at the top of this channel, which is a strong signal of trend continuation.
A breakout from the channel usually means that the market is gaining additional momentum – not only maintaining the current growth rate, but even accelerating it.
2. Breakout Range
The height of the channel (the difference between the lower and upper orange lines) is approximately ~$300–$320.
It is assumed that after breaking out of the channel, the price can cover a distance equal to its height.
This indicates a potential target around:
$1,100–$1,150 (the first key resistance level, aligned with the green zone on the chart).
The next range is as high as $1,280–$1,300 (the upper level marked by the green line).
3. Key Technical Levels
Support (red lines):
USD 899
USD 775
USD 702
These levels are most important for potential corrections.
Resistance (green lines):
USD 1,116 (nearest target after the breakout)
USD 1,280–1,300 (full range of the channel height)
4. Oscillators and Momentum
Stoch RSI (at the bottom of the chart): heavily overbought, which may suggest a short-term correction before further upward movement.
In uptrends, overbought levels do not always lead to large declines – often only to sideways consolidation.
5. Scenarios
Bullish:
Price remains above USD 900, consolidates, and then tests USD 1,116, with a target of USD 1,280–1,300.
Bearish:
If the market fails to maintain the breakout and returns below $900, a return to the middle of the channel to the $775–$800 area is possible.
✅ Summary:
A breakout from the channel to the upside is a very positive signal, and the technical upside range reaches $1,100–$1,300. However, due to the overbought position (Stoch RSI), a correction or short-term consolidation is possible before the price continues towards the full target.

XRPUSD 1D chart review1. Trend and lines
• We had a clear downward trend (orange trend falling line).
• The price broke this line and came out of the top - this is usually a signal of changing the sentiment to a more bullish.
2. Support and resistance
• The next support: approx. 2,93–2.92 USD (Red Zone + SMA).
• Another strong support: approx. USD 2.76 (below, heavily tested earlier).
• The nearest resistance: approx. USD 3.12 (green line).
• Another resistance above: approx. 3,35-3.36 USD - very important, because breaking this level can open the road to $ 3.50 and higher.
3. Medium walking (SMA)
• Red SMA (shorter) slowly turns up.
• Green SMA (longer) is still slightly inheritance, but the price is already lasting.
• This is a positive signal - the beginning of the trend change may suggest.
4. MacD (at the bottom of the chart)
• The blue line (MacD) cut the orange (Signal) from below - this is a buy signal.
• The histogram begins to grow green → Momentum tilts to the bull side.
5. RSI
• RSI is around 55–60, i.e. in the neutral zone, not yet noticed.
• There is a place for further growth before it enters the purchase zone (> 70).
⸻
✅ Summary for you (straight)
• Breaking the inheritance trend, buy signal on MacD, RSI not too high yet.
• Key resistance now: USD 3.12 → If it pierces, the target is USD 3.35.
• Key support: USD 2.92 → If it drops below, possible exit to USD 2.76.

ETCUSDT 1D chart reviewTrend and structure
• The price is currently in the 20.40 USDT area.
• You can see the downward trend line (orange), from which the price was rejected several times.
• The next support:
• 20.40 USDT (local, just tested)
• 19.01 USDT (stronger support from earlier holes).
• The nearest resistance:
• 21.09 USDT (SMA + local level)
• 22.64 USDT (strong resistance, last peak before fall).
Medium walking
• SMA (red/green lines) show that the short -term price is below most of the average → supply advantage.
• Only breaking above 21.1–22.6 USDT could change the fondness for more bullfinches.
MacD
• The histogram grows slightly up (less red), but MacD lines and signal are close to each other → no clear trend, rather consolidation with slight relegation.
RSI
• RSI around 45–50, i.e. neutral.
• There is neither a sale (<30) nor purchase (> 70).
⸻
📊 scenario
• bull:
If ETC persists above 20.40 and boots over 21.1 USDT, it is possible to move in the direction of 22.6 USDT (main barrier).
• Bear:
If the price drops below 20.4 USDT, another goal is 19.0 USDT. Punction of 19 could open the road even towards 18-17.5 USDT.

BTCUSD 4H chart short-term1. Trendline breakthrough
• In the chart you have a drawn orange relegation line (downward trend).
• The current candle struck above this line, which is the first signal of a change of sentiment from short -term inheritance to more bullshit.
2. Horizers of support and resistance
• Support:
• USD 115,426
• 114,487 USD (below, strong support, where price reactions can be seen)
• Resistance:
• 116,826 USD (the price came there)
• 117,717 USD (next resistance - an important destination point, if the moment is maintained).
3. Volume
• The last candles have a growing volume when struck. This is healthy, confirms that breaking from Trendline is not "empty".
4. STOCHASTIC RSI (below)
• You can see a dynamic break from the level of sale (<20) in the direction of 60+.
• This is a signal of growth, but note: the indicator begins to enter the purchase zone. A correction may appear in the short term.
5.
• Long (aggressive): entry around the retestation around 116k as support, target ~ 117.7k, SL below 115.4k.
• Short (versus): If the price rejects 116.8-117K and returns below 116k, you can consider Shorta with Target 115.4k → 114.5k.

LTCUSDT 1D chart review🔎 key levels
• Resistance resistance:
• 118.92 USDT (local resistance, recently tested several times).
• 126.05 USDT (stronger resistance - if it pierces, the trend is continued).
• Support (Support):
• 113.31 USDT (current level, currently defended).
• 109.28 USDT (SMA as dynamic support).
• 102.38 USDT (key support - if it falls, there may be a stronger decrease).
⸻
📉 Trend
• You can see the yellow inheritance trend line on the chart - the course respected it several times.
• Currently, the price is trying to stay above SMA200 (green line), which is a signal of a potential reflection.
⸻
📊 indicators
• MacD:
• The histogram has gone into a positive zone, which suggests growth moment, but the signal lines are close to each other → possible consolidation.
• RSI:
• Value around 50 → neutral zone, no clear purchase or sale.
• If he pierces 60, he may enter the upward trend.
⸻
📌 Scenarios
1. Bullish
• If it stays above 113.31 and breaks 118.92, the goal will be 126 USDT.
• Confirmation: RSI> 60 and MacD further opening up.
2. Bearish
• If the course drops below 113.31, subsequent support is 109.28 and 102.38.
• Confirmation: Macd Cross down + RSI <45.

BNB/USDT Short-Term🔎 Current situation:
• Price: ~ 896.9 USDT.
• Trend: You can see an upward trend short -term, but now the price consolidates just below the resistance.
• Support:
• 892.8 (SMA - short -term).
• 885.5 (key horizontal support).
• resistance:
• 899.5 (local resistance, SMA #1).
• 907.9 (strong resistance - previous peak).
⸻
📊 Indicators:
• SMA: The price balances between the short (892.8) and the long average (green ~ 896). This gives a picture of the "balance point".
• MacD: The lines are close to each other, the histogram decreases → neutral signal, possible transition towards sales, if the signal line goes up above MacD.
• RSI: ~ 50–55 → neutral zone, nor purchase nor sales.
⸻
📈 short -term scenarios (1-6h):
1. Bull (more likely if it stays above 892.8):
• Breaking 899.5 → Attack on 907.9.
• If the volume increases, up to 912+ may occur.
2. Bear (if it goes below 892.8):
• decrease towards 885.5 (key level of support).
• Punction 885.5 → Movement down to 878–880.

SOL/USDT 4h chart 1. Trend:
• The price was bounced off from the yellow growth line, but it just pierced it down. This is the first signal of buyers' weakness.
2. Support (red lines):
• $ 200 - psychological level, just tested.
• 193.6 $ - stronger support if the current one cannot withstand.
• 187.4 $ - even lower, bull defense limit.
3. Resistance (green lines):
• $ 206.9 - the first greater resistance to come back up.
• 214.7 $ - stronger, where there were reflections before.
• $ 220.5 - main resistance, heavy to punctures.
4. Stoch RSI (downstairs):
• It is low → the market looks sold out, which means that there may be a chance to reflect, but there is no reversal signal yet.
⸻
👉:
Sol has lost his growth line and is now fighting to stay $ 200. If it falls lower, subsequent stops are $ 193 and $ 187. Only breaking over $ 207–214 will show the strength of buyers.

BNB/USDT 4H chart1. Trend
• There is a clear yellow inheritance trend on the chart - the price has been moving under it for a long time.
• Currently, the course is testing this line - that is, we are at which it is possible to either break up the mountain or another reflection down.
⸻
2. Key levels
• Resistance resistance:
• 856 USDT (SMA - green line, short -term resistance).
• 865 USDT (last local peak, additional psychological resistance).
• Support (Support):
• 849 USDT (red SMA #1).
• 843 USDT (horizontal support).
• 835 USDT (stronger support, marked in red).
⸻
3. Indicators
• SMA - the price is between short -term (red) and medium -term (green) average walking. This is a consolidation signal.
• MacD - the blue line pierces the orange from the bottom, the histogram begins to shine green → a sign of potential growth.
• RSI - around 45–50 → neutral, shows neither a sale nor buying out. It indicates the possibility of both directions.
⸻
4. Possible scenarios
• bullish (upward):
• If the price stands out above 856–865 USDT and persists, a possible level of 880 USDT levels.
• Confirmation will be further strengthening MacD and RSI going towards 60+.
• Bear (inheritance):
• If the course is rejected from the trend line, the decline may go down to 843 USDT first, and in case of puncture - up to 835 USDT.
• RSI Congress below 40 and MacD reversing down will confirm their weakness.
⸻
✅ Summary:
BNB is now in the decision zone - it tests the downward trend line and key resistance at 856–865 USDT. MacD suggests that bulls are trying to take the initiative, but RSI is still neutral. If the mountain is broken, the movement can be dynamic. If rejection - descent to 835 USDT very real.

BTCUSD 4h short-term📊 Trend and structure
• You can see the price output from the downward channel (orange trend lines). This is a signal of a potential change of trend.
• The price currently oscillates around USD 112,200, i.e. above several key supports (109,000 - 111,000).
• The nearest strong resistance is around 113,450 - 114,955 USD (marked with green lines and average SMA).
⸻
📈 indicators
• MacD: MacD (blue) line pierces above the signal (orange) and the histogram grows in the plus → it is a growth signal.
• RSI: ~ 60, i.e. it grows, but is not yet entering the purchase zone (> 70). There is still room for increases.
• SMA:
• Price has pierced short -term medium (red and green lines, ~ 109–112k), which works as support.
• The next key test is SMA around $ 114,955 - a puncture could open the road to 116–118k.
⸻
🔑 key levels
• Support:
• 111.014
• 109.023
• 107.580
• resistance:
• 113,450
• 114,955
• 116,000+
⸻
📝 Summary
• short -term (4h) - signals are upward: breaking from the downward channel, positive MacD, RSI is growing healthy.
• Bull scenario: Breaking above 114,955 opens the way to 116–118k.
• Bear scenario: unsuccessful puncture 113,450/115K → possible retest support at 111K and 109k.

ETH/USDT (4H) 1. Trend
• The price is in the downward channel (designated orange lines).
• The last candle tests the lower restriction of the channel → Possible reflections or breaking down.
2. Horizers of support and resistance
• resistance (green lines):
• 4,440 USDT
• 4,382 USDT
• Support (red lines):
• 4,268 USDT (currently tested)
• 4,247 USDT
• 4,176 USDT
• 4 090 USDT (stronger support)
If 4,268 is pierced and maintained below, a further exit can be around 4 176–4 090.
3. RSI (Relative Strength Index)
• Currently RSI oscillates below 50 → Bear advantage.
• There is still a strong sale signal (<30), so theoretically there is still a space to decline.
4. Chop (Choppiness Index)
• The indicator shows a fairly "jagged" market → no strong trend, but from the current context of more bear pressure.
⸻
📊 Scenarios:
• Bull (reflection): If the price stays above 4 268 and reflects from the bottom line of the channel → possible traffic towards 4 382 and 4 440.
• Bear (continuation of declines): closing the candle 4h below 4,268 → a signal for further drop to 4 176 and even 4 090.

XRP/USD 1D Chart ReviewFormation
The chart shows a narrowing symmetrical triangle (orange lines).
The price is now in the lower part of the triangle, with support around $2.80–2.79.
If the price breaks out of this consolidation, we could see a larger trend move.
Supports
$2.80–2.79 – local support (lower line of the triangle).
$2.63 – strong horizontal support, reinforced by the earlier rebound.
$2.46 (SMA200) – key intermediate-term level.
Resistances
$3.00–3.08 (SMA50) – first major resistance.
$3.17 – next barrier.
$3.42 – strong resistance from July.
Indicators
MACD: below the 0 line, negative histogram → bearish signal, but no strong downward momentum yet.
RSI (41): close to the oversold zone, but still neutral-weak – no clear divergence.
SMA50 (red) is falling and is above the price → selling pressure.
SMA200 (blue) is rising and acting as medium-term support.
Scenarios
Bullish – a rebound from the lower boundary of the triangle (2.80) and an attack on $3.00–3.08. A breakout from the upper boundary of the formation will open the way to $3.42.
Bearish – a breakout below the $2.80–2.79 zone → a test of $2.63 and deeper into $2.46 (SMA200).
Summary
The market is at a critical juncture – price is squeezed within the triangle, indicators are neutral-weak, and volume is decreasing. A breakout from this consolidation (most likely in early September) will set the course for the next move.
👉 If you're trading short term, maintaining the $2.80 level is key.
👉 If you're trading medium/long term, only a break above $3.08–3.17 will provide a strong bullish signal.

BTC/USD 4h Chart🔹 Trend and Price Action
• There was a downward trend on the chart (orange trend line).
• The price creates above the inheritance trend line, which is the first signal of the potential change of direction.
• Currently, the course oscillates around USD 111.9.
⸻
🔹 levels of support and resistance
You have key zones marked:
• resistance:
• $ 112 236 (local resistance - the price is currently struggling with it),
• $ 113 171,
• 114 481 $.
• Support:
• 110 677 $,
• $ 109 430,
• $ 107 309 (stronger support).
👉 If the price lasts above $ 112 $ 236 - we can see the test 113-114K.
👉 If it does not pierce, possible retest 110.6k or lower.
⸻
🔹 indicators
• MacD - I see that the blue line cut the orange from below → Bycza signal (confirms the attempt to change the trend).
• Stochastic RSI - is high (exit from the hole), but already close to the purchase zone → possible light withdrawal or consolidation before it moves further.
⸻
🔹 Scenarios
1. Bull (more likely now):
• Maintenance above 111.9k - 112.2k → Movement up to 113.1k and 114.4k.
• Breaking 114.4k opens the way to 116K+.
2. Bear (if he doesn't beat 112.2k):
• Rejection → descent to 110.6k.
• Breaking 110.6k → test 109.4k.

AVAX/USDT 1D ChartCurrently 25.86 USDT (+2.42%).
• The price has reflected from support around 22.6 USDT and broke over SMA (average walking).
• You can see an attempt to continue the upward trend - local "mini bull run".
⸻
2. Support and resistance
• Support:
• 24.39 USDT (SMA #1, short -term support).
• 22.60 USDT (strong support - earlier level of consolidation).
• 20.20 USDT (key hole below which the downward trend returns).
• resistance:
• 26.26 USDT (local resistance, currently tested).
• 27.72 USDT (another strong level of resistance).
• 30.95 USDT (key resistance - return to a strong supply zone).
⸻
3. Medium walking (SMA)
• The price was pierced by SMA #1 (red) and SMA #2 (green).
• SMA #5 (blue) is located lower (~ 22.5), which shows that the short -term trend is now stronger than the long -term → bull signal.
⸻
4. MacD
• The histogram begins to grow above line 0.
• The MacD line cut the signal line from the bottom → buy signal.
• The growth moment is developing.
⸻
5. RSI
• RSI ~ 58 → neutral, but close to the "bull" zone.
• Not yet bought out (> 70), so there is space for further increases.

BNB/USDT 12h chart🔎 Current situation
• Price: 898.50 USDT (+7.03%) - outstanding candle.
• Trend: We see a strong growth impulse, confirmed by the reflection from the trend line (yellow).
• Support:
• 869.75 USDT (next short -term support).
• 838.37 USDT.
• 818.56 USDT (SMA #2).
• resistance:
• 921.99 USDT.
• 952.26 USDT (key level - potential target, can be tested).
⸻
📊 Indicators
• SMA (movable average):
• The price struck over SMA and lasts above-a pro-rectification signal.
• MacD:
• The MacD line pierces the signal line from the bottom → fresh buy signal.
• The histogram begins to grow green.
• RSI (Relative Strength Index):
• Currently ~ 60 → a lot of space for the purchase zone (70+).
• RSI directed up, confirms the momentum of bulls.
⸻
📈 Scenarios
1. Bycza (more likely short -term)
• If the price lasts above 869–870 USDT → attack on 922 USDT.
• Breaking 922 with a strong volume → Another target 950–960 USDT.
2. Bear (less likely now but possible)
• Rejection from 922 and descent below 870 USDT → withdrawal to 838 or even 818 USDT.
• Only the loss of 818 will negate the current upward trend.
⸻
📝 Summary
BNB currently looks very strong - a fresh growth impulse, breaking over medium, MacD gives a buy signal, RSI is not yet in the purchase zone.
➡️ If something negative on BTC or the wide market does not happen, then the 922 and 952 test is real in the short term.
