Advanced Algorithmic Trendline Breakout Strategies● Advanced Algorithmic Trendline Breakout Strategies: A Comprehensive Analysis of Dynamic Support/Resistance and Geometric Target Projection
● Part I: The Theoretical Architecture of Market Geometry
• 1. Introduction to Algorithmic Price Action
The intersection of classical technical analysis and modern algorithmic trading has birthed a new class of indicators that bridge the gap between subjective chart interpretation and objective mathematical execution. At the core of this evolution is the automation of the trendline—a tool as old as the Dow Theory yet as relevant as high-frequency trading algorithms. This report provides an exhaustive, expert-level analysis of a specific methodology: the automated construction of trendlines based on user-defined pivot points, the identification of breakouts via closing price confirmation, and the projection of price targets using a vertical distance metric derived from the structure's final swing point.
This methodology is not an invention of the digital age but rather a quantification of principles established by the titans of technical analysis: Robert D. Edwards, John Magee, John Murphy, and Thomas Bulkowski. By synthesizing Edwards and Magee’s geometric rigidity, Murphy’s trend-following philosophy, and Bulkowski’s statistical rigor, we establish a robust framework for identifying high-probability structural shifts in financial markets.
• 2. The Lineage of The Path of Least Resistance
To understand the efficacy of an automated trendline strategy, one must first dissect the theoretical lineage that validates the trendline as a predictive tool. The concept of the trendline is rooted in the physical laws of inertia and momentum, applied to market psychology.
• 2.1 The Dow Theory Foundation
John Murphy, in Technical Analysis of the Financial Markets, posits that the trend is the foundational concept of all technical analysis. Murphy explains that market action discounts everything, meaning that the price chart is the ultimate arbiter of truth. The trendline serves as the visual representation of the primary trend defined by Charles Dow. In an uptrend, demand consistently exceeds supply at progressively higher price levels. The trendline connects the troughs of these demand waves. As long as the price remains above this line, the physical law of inertia suggests the trend will continue.
The automated methodology described utilizes this principle by identifying Pivot Lows (in an uptrend) or Pivot Highs (in a downtrend) to anchor the trendline. This mirrors Murphy’s instruction to draw lines under significant reaction lows. However, where Murphy relied on visual inspection, the algorithm relies on specific lookback parameters to define what constitutes a significant reaction, thereby standardizing the identification of the trend across all assets and timeframes.
• 2.2 Edwards and Magee: The Geometry of Conflict
While Dow and Murphy focused on the trend's direction, Edwards and Magee formalized the geometry of the trendline. In Technical Analysis of Stock Trends, they describe the trendline as a dynamic boundary of conflict between buyers and sellers. They introduced the crucial concept that a trendline is a line of dynamic support or resistance. Unlike a horizontal support level (e.g., $100), which represents a static price memory, a trendline represents a time-dependent price memory.
In a rising market, the value buyers place on an asset increases with time. A trendline sloping upward at a 45-degree angle indicates that the market demands a specific rate of price appreciation to maintain bullish sentiment. The automated indicator’s logic—extending a line infinitely to the right based on two points—is a direct application of this geometric theory. It creates a line in the sand that moves. If price fails to keep up with the slope of the line (i.e., breaks below it), it signals a deceleration of momentum that Edwards and Magee classify as a potential reversal signal.
• 2.3 Bulkowski’s Statistical Empiricism
Thomas Bulkowski revolutionized the field by testing these classical theories against vast datasets. His Encyclopedia of Chart Patterns moves beyond the anecdotal evidence of Edwards and Magee to provide statistical probabilities. Bulkowski’s work is essential to the Target Projection component of this methodology. He established that patterns like wedges, triangles, and flags have predictable failure rates and measure rules.
The methodology’s reliance on the vertical distance for target calculation is a generalized application of Bulkowski’s findings on Measured Moves. Bulkowski observed that the volatility inherent in the pattern (represented by its height) is often replicated in the breakout move. By automating this measurement, the indicator moves from a discretionary guesstimate to a statistically grounded projection.
• 3. The Geometry of Trendline Construction
The automated generation of trendlines requires precise definitions of points and lines that can be executed by code. This section explores the mathematical mechanics used by the indicator and their theoretical implications.
• 3.1 Pivot Point Identification Logic
The script constructs the trendline by connecting two distinct points in time. These are not arbitrary points but Pivots or Swing Points.
Definition: A Pivot High is a candle that has a higher high than the N candles preceding it and the N candles following it. A Pivot Low is the inverse.
User Input: The snippet references Start Date and End Date inputs. This implies a semi-automated approach where the trader identifies the region of interest, and the algorithm snaps the trendline to the exact mathematical extremes (High or Low) within those timestamps.
This Hybrid approach solves a major issue in algorithmic trading: context. A fully automated script might draw trendlines across every minor fluctuation. By allowing user input for the anchor points, the tool leverages human pattern recognition (identifying the Forest) while using algorithmic precision for the execution (identifying the Trees and calculating the exact slope).
• 3.2 The Slope and Infinite Extension
Once the two pivots (P1 at t1, P2 at t2) are locked, the algorithm calculates the linear equation of the trendline:
y = mx + c
Where:
m (slope) = (Price2 - Price1) / (Time2 - Time1)
x is the current time index.
c is the y-intercept.
The crucial feature described in the research is the infinite extension to the right. This extension transforms the historical line into a future-predictive tool. It allows the trader to see where the price must be at a future time tn to maintain the trend.
Wedge Construction: In a wedge pattern, two trendlines converge. The automated extension allows the user to define the upper resistance line independently of the lower support line. As time progresses, the gap between price and this extended line narrows, decreasing volatility and increasing the probability of a violent breakout—a phenomenon described by Bulkowski as coiling.
• 3.3 Logarithmic vs. Arithmetic Scaling
A nuance often overlooked but critical in Edwards and Magee’s work is the scale of the chart. They heavily favored semi-logarithmic charts for long-term trend analysis because a straight line on a log chart represents a constant percentage rate of change.
Algorithmic Implication: While most simple scripts use arithmetic calculations (Price2 - Price1), advanced implementations of this methodology (as hinted at in market geometry references) may need to account for log-scale slopes, especially for long-term targets. However, for the vertical distance calculation method described (measuring price difference at a specific bar), the arithmetic difference is the standard convention in modern coding (Pine Script/Python).
• 4. Dynamic Support and Resistance Mechanics
The trendline created is not just a visual aid; it is a functional barrier.
Bullish Trendline: Connects Pivot Lows. Acts as dynamic Support.
Bearish Trendline: Connects Pivot Highs. Acts as dynamic Resistance.
The dynamic nature implies that the support level rises with every new candle (in an uptrend). This puts constant pressure on the bears. If they cannot push price down fast enough, the rising support line will eventually intersect with the current price, forcing a decision. This interaction is the Trigger Event for the strategy.
● Part II: The Mechanics of the Breakout
• 5. Defining the Breakout Event
In classical analysis, a breakout is subjective. Edwards and Magee speak of decisive penetrations. The automated methodology rigorously defines this using boolean logic.
• 5.1 The Close vs. Wick Debate
The research material explicitly states that a breakout is identified based on closing prices.
The Trap of Wicks: Intraday price action often pierces trendlines due to temporary liquidity sweeps or stop-hunting algorithms. These are false breakouts. A wick above a resistance line shows that buyers pushed price there, but sellers were strong enough to push it back down before the close.
The Commitment of the Close: A closing price beyond the trendline indicates that the market sentiment has fundamentally shifted. Buyers (in a bullish breakout) were willing to hold the asset at a higher valuation through the end of the session.
Murphy’s Rule: John Murphy emphasizes that a closing price filter (e.g., requiring a 3% penetration or a two-day close) significantly reduces whipsaws. The automated script simplifies this to a single bar close logic:
Signal = Close > TrendlineValue
This binary condition (True/False) allows the script to print a BC (Breakout Candle) label instantly, providing the trader with an actionable signal that removes hesitation.
• 5.2 Volume Confirmation
Snippet 16 and 17 highlight the necessity of volume. A breakout on low volume is suspect. The Edwards and Magee standard requires an increase in volume on upside breakouts.
Algorithmic Integration: While the primary trigger is price, the most robust versions of this indicator likely include a volume condition (e.g., Volume > SMA(Volume, 20)). This aligns with Bulkowski’s finding that breakouts with above-average volume are less likely to experience a failure or a deep throwback.
• 5.3 The Throwback and Pullback Phenomenon
Bulkowski’s statistics are vital here. He notes that after a breakout, price returns to the trendline (Throwback) in approximately 40-60% of cases, depending on the pattern.
Methodology Handling: The automated target logic (discussed in Part III) is static once the breakout occurs. This is crucial because if a throwback occurs, the trendline value has changed (it has moved higher/lower). By locking in the targets at the moment of the breakout candle, the algorithm provides a fixed reference point for the trader to manage risk during the chaotic throwback phase.
• 6. Breakout Filters and False Signals
To further refine the signal, the methodology references concepts like Change of Character (CHOCH) and Liquidity Sweeps.
• 6.1 Change of Character (CHOCH)
Snippet 19 and 11 mention an optional CHOCH module. This concept, popular in Smart Money Concepts (SMC), looks for the breach of a prior swing high/low in addition to the trendline break.
Confluence: If a bearish trendline is broken (price goes up), AND the price also breaks above the most recent significant Pivot High (CHOCH), the probability of a sustained reversal increases. This aligns with Dow Theory’s requirement for a pattern of higher highs to confirm a new uptrend.
• 6.2 The Busted Pattern Strategy
Bulkowski identifies a specific scenario called a Busted Pattern: when a breakout occurs, moves less than 10%, and then reverses to break the other side of the pattern. These often result in powerful moves in the reverse direction. While the core indicator focuses on the initial breakout, understanding this failure mode is essential for risk management (Stop Loss placement).
● Part III: The Vertical Distance Target Projection Model
• 7. Theoretical Derivation of the Target
The most distinctive feature of this methodology is its target calculation: Projecting the vertical distance between the breakout line and the last pivot. This differs from the standard Pattern Height rule in subtle but significant ways.
• 7.1 The Measure Rule vs. Last Pivot Logic
Classic Measure Rule (Triangles/Wedges): Edwards and Magee typically measure the widest part of the triangle (the base) and project that from the breakout.
Automated Method: Measures the distance at the Last Pivot before the breakout.
Why the distinction?
In a converging pattern like a wedge or triangle, volatility is compressing. The widest part represents volatility from weeks or months ago. The Last Pivot represents the current volatility state immediately preceding the breakout.
Volatility Compression: As the price coils into the apex, the energy available for the initial thrust is often proportional to the most recent swing. Using the Last Pivot provides a more conservative and highly probable target (Target 1) compared to the widest part, which might be an overestimation in a low-volatility environment.
• 7.2 Mathematical Formula for Target Calculation
Let t_break be the time of the breakout candle.
Let P_break be the closing price of the breakout candle (or the trendline value).
Let P_pivot be the price of the most recent significant swing point (High or Low) at time t_pivot.
Let L(t) be the value of the trendline at time t.
Step 1: Calculate Vertical Distance (D)
The distance is measured strictly vertically at the time index of the pivot.
D = | P_pivot - L(t_pivot) |
Crucially, this uses the trendline value at the historical pivot time, not the current time.
Step 2: Project Targets (T)
The distance D is projected from the Trendline value at the breakout point (or the breakout price itself, depending on specific script implementation).
Target 1 (1.0x): T1 = P_break +/- (D x 1.0)
Target 2 (1.618x): T2 = P_break +/- (D x 1.618)
Target 3 (2.618x): T3 = P_break +/- (D x 2.618)
• 7.3 Fibonacci Harmonics
The use of 1.618 (Golden Ratio) and 2.618 multipliers aligns the strategy with harmonic trading theory. Bulkowski often references Fibonacci extensions as secondary targets when the primary measure rule is exceeded.
Target 1 represents the Measured Move (Symmetry).
Target 2 represents the Extension (Momentum run).
Target 3 represents the Exhaustion (Statistical outlier).
• 8. Comparative Analysis of Target Methods
The following table contrasts the Vertical Distance at Last Pivot method with other classical targeting methods referenced in the literature.
Method: Widest Base
Source: Edwards & Magee
Measurement Basis: Widest part of pattern (start of trendlines).
Projection Point: Breakout Point
Pros: Captures full potential of the structure.
Cons: Can be overly ambitious for late breakouts; ignores volatility compression.
Method: Flagpole
Source: Murphy
Measurement Basis: Entire preceding trend leg (Flagpole).
Projection Point: Breakout Point
Pros: Best for Bull Flags/Pennants.
Cons: Often overestimates targets for Reversal patterns (like wedges).
Method: Last Pivot (Vertical)
Source: Automated Method
Measurement Basis: Distance from Trendline to Last Swing.
Projection Point: Breakout Point
Pros: Adjusts for recent volatility; higher probability T1.
Cons: May underestimate the move in explosive breakouts (requires T2/T3).
Method: Percent Decline
Source: Bulkowski
Measurement Basis: Percentage drop/rise of prior trend.
Projection Point: Breakout Price
Pros: Statistically robust across large datasets.
Cons: Harder to automate visually on a chart compared to geometric lines.
• 9. Intraday vs. Swing Targets
The methodology applies to both intraday and swing trading.
Intraday: The Last Pivot method is superior because intraday volatility changes rapidly (e.g., opening range vs. lunch hour). Measuring the most recent swing captures the immediate liquidity conditions better than a pivot from 4 hours ago.
Swing/Daily: On daily charts, the Widest Base method of Edwards and Magee often aligns with the Last Pivot method if the pattern is a Rectangle or Channel (where width is constant). It only diverges significantly in Triangles.
● Part IV: Pattern-Specific Applications and Analysis
The automated trendline tool is pattern-agnostic—it simply sees a line and a pivot. However, the trader applies it to specific structures. This section analyzes how the tool performs on the specific patterns mentioned in the research.
• 10. The Wedge (Rising and Falling)
Wedges are defined by converging trendlines with a distinct slope against the prevailing trend.
Falling Wedge (Bullish): Resistance line slopes down; Support line slopes down (steeper).
Automated Setup: User draws the Resistance Trendline connecting lower highs.
Target Logic: The Last Pivot is the most recent Lower Low.
Bulkowski Stat: Falling wedges break upward 69% of the time.
Nuance: Because wedges converge, the Last Pivot distance is naturally smaller than the Base. This makes the automated Target 1 very achievable. Snippet 16 shows a specific example of a Wedge in Tata Motors where the target was exactly hit using the High minus Low difference, validating the math.
• 11. The Bump and Run Reversal (BARR)
This is a proprietary pattern identified by Thomas Bulkowski. It consists of three phases:
Lead-in: A steady trend (30-45 degrees).
Bump: A rapid acceleration (speculative excess) moving price far away from the trendline.
Run: The reversal after the trendline break.
Applying the Automated Tool to BARR:
Construction: The user draws the trendline along the Lead-in phase pivots.
The Vertical Distance Check: Bulkowski validates the pattern by measuring the vertical distance of the Bump height. It must be at least 2x the height of the Lead-in height.
Target: The automated tool is perfect for this. The Last Pivot corresponds to the Bump High.
D = Height of Bump.
Target = Breakout Price - D.
This implies a full retracement of the speculative bump, which is exactly Bulkowski’s target for this pattern.
• 12. Triangles (Symmetrical, Ascending, Descending)
Symmetrical Triangle: Indecision. Breakout can be either way.
The 50-75% Rule: Snippet 17 emphasizes that breakouts are most reliable when they occur 50-75% of the way to the apex.
Automated Filter: If the user sets the trendline, the visual proximity of the Last Pivot to the breakout point tells the story.
If D is tiny, the breakout is near the apex (late). Targets will be small.
If D is large, the breakout is early (potentially premature).
The Sweet Spot generates a moderate D and a high-probability Target 1.
• 13. Flags and Pennants
These are continuation patterns.
Edwards & Magee: The Flag flies at half-mast. The move after the flag equals the move before (Flagpole).
Automated Adaptation: The tool measures the flag's width.
Target 1 (1x Width): A scalper's target inside the trend.
Target 3 (2.618x Width): Often approximates the full Flagpole height.
Insight: This highlights the utility of the multi-target system. T1 ensures money is banked if the trend fails; T3 captures the classical Measured Move of the Flagpole.
● Part V: Statistical Validation, Risk Management, and Coding
• 14. Statistical Reliability (The Bulkowski Data)
No technical analysis report is complete without addressing failure rates. Bulkowski’s data provides the reality check for the geometric projections.
• 14.1 Pattern Success Rates (2025 Data)
The research snippets provide updated statistics for 2025:
Head and Shoulders: 89% accuracy (when confirmed).
Double Bottoms: 88% success in bull markets.
Symmetrical Triangles: 76% success in direction of trend.
Bull Flags: 91.5% success rate (highest reliability).
These high success rates validate the Breakout signal. However, success is often defined as a 5% move, not necessarily hitting the full target. This is why the Target 1 (1:1) rule of the automated indicator is so effective—it aims for a statistically probable move rather than a home run.
• 14.2 The Busted Opportunity
If a pattern fails (e.g., a Bull Flag breaks up, hits T1, then collapses), it becomes a Busted Pattern. Bulkowski found that busted patterns have higher average gains than standard patterns because the trapped traders provide fuel for the reversal.
Strategy: If price reverses and closes back below the trendline after triggering a breakout, the automated system’s signal is invalidated. Advanced traders reverse their position immediately, targeting the opposite side pivot.
• 15. Risk Management: Stop Loss Placement
Where does the stop loss go?
Method A (Conservative): Below the Last Pivot used for the calculation.
Logic: If price breaks the trendline but then takes out the pivot that created the setup, the structure is broken (Dow Theory violation).
Risk/Reward: Since Target 1 is calculated using distance D (Trendline to Pivot), placing the stop at the Pivot means the Risk is D.
Result: A perfect 1:1 Risk/Reward Ratio for Target 1.
Method B (Aggressive): Just below the trendline or the breakout candle.
Logic: Minimizes risk.
Danger: High susceptibility to Throwbacks (40-60% probability).
The report recommends Method A for swing trading (to survive the throwback) and Method B only for high-momentum scalping.
• 16. Algorithmic Implementation Challenges
Translating this theory into code (e.g., Pine Script) involves specific challenges.
• 16.1 Repainting
The script must leverage confirmed pivots. If the script uses a pivothigh function with rightbars=5, the pivot is only confirmed 5 bars after it happens.
Solution: The trendline is drawn retrospectively, but the breakout is real-time. The script must ensure that the Last Pivot index is stable before the breakout candle closes.
• 16.2 Parameter Sensitivity
The lookback period for pivot detection determines the scale of the trendline.
Short Lookback (e.g., 5 bars): Catches micro-trends. Targets are small. High noise.
Long Lookback (e.g., 20 bars): Catches major structural trends. Targets are large. Fewer signals.
Recommendation: Users should align the lookback with the timeframe (e.g., 5 on Daily chart, 20 on 1-minute chart) to capture relevant liquidity sweeps.
• 17. Conclusion: The Synthesis of Old and New
The automated trendline breakout strategy is a testament to the enduring validity of classical technical analysis. By automating the insights of Edwards and Magee (dynamic support/resistance), adhering to the filters of John Murphy (closing price confirmation, volume), and applying the statistical rigor of Thomas Bulkowski (measured move targets, failure rates), the methodology transforms subjective art into objective science.
The Vertical Distance to Last Pivot calculation stands out as a robust, volatility-adaptive metric that provides realistic profit objectives. Whether applied to a Bulkowski Bump and Run or a classic Murphy Flag, the logic holds: Energy accumulated during the compression (Pivot Distance) is released during the expansion (Target).
For the modern trader, this tool does not replace analysis; it standardizes it. It ensures that every breakout traded adheres to the same geometric rules, allowing for consistent risk management and performance tracking—the ultimate goal of any professional trading system.
● Appendix: Data Tables and Reference Summaries
• Table 1: Comparative Breakout Statistics (Source: Bulkowski & 2025 Data)
Pattern Type: Head & Shoulders | Breakout Direction: Down | Success Rate: 89% | Avg. Throwback Rate: ~45-50% | Target Reliability (T1): High
Pattern Type: Bull Flag | Breakout Direction: Up | Success Rate: 91.5% | Avg. Throwback Rate: Low | Target Reliability (T1): Very High
Pattern Type: Sym. Triangle | Breakout Direction: Trend Continuation | Success Rate: 76% | Avg. Throwback Rate: Moderate | Target Reliability (T1): Moderate (depends on apex proximity)
Pattern Type: Falling Wedge | Breakout Direction: Up | Success Rate: 69% | Avg. Throwback Rate: Low | Target Reliability (T1): High
Pattern Type: Bump & Run | Breakout Direction: Reversal | Success Rate: Variable | Avg. Throwback Rate: Low (Violent Move) | Target Reliability (T1): Very High (for T1)
• Table 2: Target Projection Multipliers
Target Level: T1 | Multiplier of Distance (D): 1.0 | Theoretical Basis: Geometric Symmetry / Measured Move | Usage Case: Primary Take Profit (Conservative)
Target Level: T2 | Multiplier of Distance (D): 1.618 | Theoretical Basis: Golden Ratio Extension | Usage Case: Strong Trends / Runners
Target Level: T3 | Multiplier of Distance (D): 2.618 | Theoretical Basis: Deep Harmonic Extension | Usage Case: Climactic / Blow-off Tops
• Table 3: Filter Logic Summary
Filter Name: Close Filter | Condition: Close > Trendline | Source Justification: Edwards & Magee / Murphy (Avoid wicks/noise)
Filter Name: Volume Filter | Condition: Vol > AvgVol | Source Justification: Murphy / Bulkowski (Confirm institutional participation)
Filter Name: Pivot Filter | Condition: Pivot > Previous Pivot | Source Justification: Dow Theory (Trend definition)
Filter Name: Time Filter | Condition: 50-75% to Apex | Source Justification: Bulkowski (Avoid dead zones in triangles)
Trendbreakout

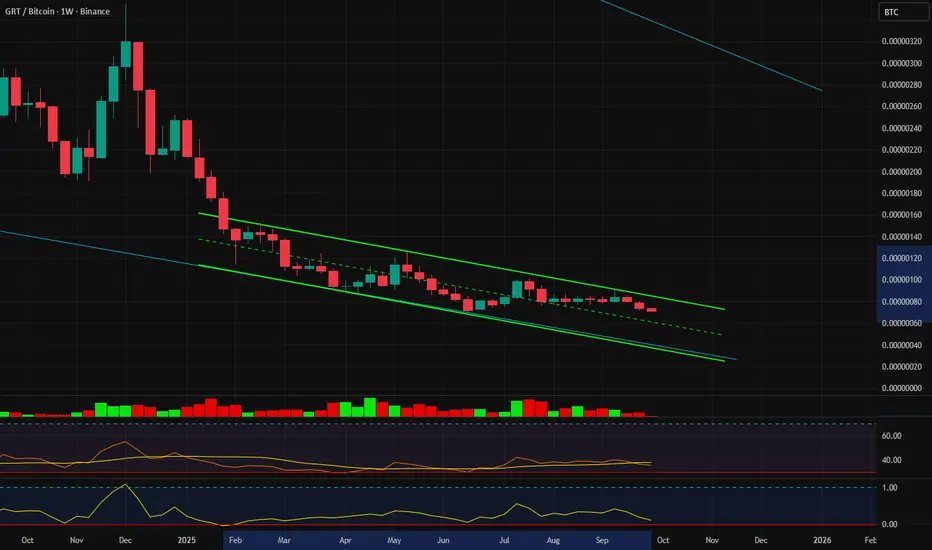
GRT/BTC Descending ChannelThis 245 day descending channel once broken on the BTC pair, we can finally stop this 4 yr down trend!!
Hold wait till breaks Upper channel.
EUR/USD | Bearish Breakdown & Retest | Short Setup EUR/USD VIP Short Setup | Smart Money Move 🔥📉"
Chart Analysis:
Ascending Channel Breakdown: EUR/USD broke below a well-respected bullish channel, signaling a potential downtrend.
Retest & Resistance: Price is currently retesting the broken structure near 1.08565, a key resistance zone.
Sell Confirmation: The rejection at this level suggests bearish momentum.
Target: The next major support lies at 1.06513, aligning with previous price action levels.
Trading Plan:
✅ Entry: Around 1.08155 - 1.08565 (after rejection confirmation)
✅ Take Profit: 1.06513
✅ Stop-Loss: Above resistance for risk management
Summary: Smart money is eyeing this short trade after a strong bearish breakout. A retest of resistance gives a prime entry for sellers. 📉🔥

USD/JPY Premium Trade Setup | High-Probability Short OpportunityKey Elements in the Chart:
Uptrend Channel: The price was moving inside an ascending channel but recently broke downward.
Resistance Zone: Marked near the 150.000 level, indicating a key rejection area where sellers are strong.
Sell Zone: A potential short-selling opportunity is identified around 149.300 after a breakdown from the channel.
Support Zone: Located around 148.500, where the price may find temporary buying interest.
Target: The final target for the bearish move is near 147.000, suggesting a further downside potential.
Trading Idea:
Bias: Bearish (selling opportunity after a trendline break)
Entry: Near 149.300 (confirmed rejection)
Target: 147.000
Risk Management: Stop-loss can be placed above the resistance area.
This setup suggests that USD/JPY may continue its downward move after failing to sustain the uptrend. Traders should watch for confirmation signals before entering.

GBP/USD Breaks Rising Channel – Bearish Target Ahead!Key Observations:
Rising Channel: The price was trading within an ascending channel, bouncing between resistance and support.
Breakout & Sell Signal: The price has broken below the channel support, indicating a potential trend reversal.
Bearish Target: The next key support level is around 1.27024, aligning with a previous demand zone.
Confirmation: If the price stays below 1.29165, further downside movement is likely.
Trading Idea:
Short Entry: After confirmation of a breakdown below support.
Target: 1.27024 (next major support level).
Stop Loss: Above 1.30127 (previous resistance).
This setup suggests bearish momentum as long as the price remains below the broken support. Traders should watch for retests and volume confirmation.

Atul ltd Atul ltd is complted wave 4 in large degree its goes for wave 5th
target 12k
sl wave 4
entry current
this chart is only on studies purpose

ETC BULL MARKET GETTING STARTEDETC is breaking the previous downtrend line and it has reversed from the golden pocket of previous bull market.

BITCOIN BULLISH short term!!!Bitcoin has broken through a massive downtrend and is now retesting the diagonal or dynamic resistance. If bitcoin manages to hold these levels, I would exspect prices to move higher at tap the 28k level.
This is a great area to enter a long while managing your risk for a 2% max loss on trade if your stop-loss hits.
You can also see that on the 6hr TF is is well oversold which is more bullish than bearish in the medium term.
Calculate Your Risk/Reward so you don't lose more than 1% of your account per trade.
Every day the charts provide new information. You have to adjust or get REKT.
Love it or hate it, hit that thumbs up and share your thoughts below!
This is not financial advice. This is for educational purposes only.

BANK NIFTY ANALYSIS - 03/07/2023UPTREND BREAKDOWN HAPPEND
BUY ABOVE - 44790
SL - 44700
TARGETS - 45000,45120,45230
SELL BELOW - 44700
SL - 44790
TARGETS - 44600,44500,44310
Disclaimer - All information on this page is for educational purposes only,
we are not SEBI Registered, Please consult a SEBI registered financial advisor for your financial matters before investing And taking any decision. We are not responsible for any profit/loss you made.
HAPPY TRADING GUYS


btcusdt long
$BTC this has become so ridiculous. up and down same amounts daily. Lenders should be broke by now, but they are not and why, because you guys need to understand, you're lending off people that know your positions, its so easy to liquidate you as there is absolutely no regulations, no insight on who is dumping or pumping.
Clearly manipulated, so obvious the market making, the liquidations, same game daily, they dump you all sell and give them a cheaper entry, they'll keep repeating as long as the can buy back their BTC for less and you keep raising till they dump again. This is like farming people. If you people would constanly raise its value they cant buy cheaper, they wont dump easy because they cant retrive what they've sold. To hard to understand? Keep feeding them.
Dont know what you all see in charts when everything is control of a few people.
I'm here to invest long-term and not play daily games, but daily people, exchanges/lenders running it down makes it unatractive

BBTC has broken a year long resistanceMore than a year old trendline breakout
Volumes increasing
Looks like further upside is dew
Spent a lot of time on support
stay tunes!

[08/28] Beast Trading _ Today's Bitcoin Perspective Beast Trading _ Today's Bitcoin Perspective
Today, I will explain the wave that has been coming down from 25k.
First, the bit went up well to 25k, but you can see that the volume was much stronger when it went up than when it went down
Through this, it was analyzed that the wave that rose toward 25k was not an impulse wave, but a technical rebound from the decline that had fallen a lot.
The shape of the wave coming down from 25k is also seen as a falling impulse wave.
Since the wave starting from the high point is the impulse wave, the current section is likely to fall strongly to the impulse wave
If the trading volume really explodes and starts to fall, I think there will be a strong fall with panic selling, renewing 17.6k lows.
Currently, NASDAQ is also proceeding as I posted the NASDAQ market situation before.
After leaving the parallel channel, a strong drop continues, and the shape of the wave is analyzed as an impulse drop wave such as a bit.
Since the investment market atmosphere is not so good, I recommend short positions rather than long positions, and there are many up and down shaking movements.
Be careful not to make unshakable sales!


EUR/NZD shorting opportunityThe price broke the old ascending trend line and did a retest and also broke this trendline the rest is broke the horizontal support with closed 4h candle below 1.63450 to catch 250 pips until next support

piind piind gives breakout and have done retest,
Entry: 2700 above
Target: 2850, 3000 and 3370 & 3500
SL: 2520

$DYDX - trendline breakout + stochastic bullish divergenceDYDX printed a bullish divergence on 4h timeframe and is breaking the downtrend
might look into a long position for this
the price is also approaching the resistance level around 4.5, which I expect to be broken soon
let me know what you think about this in the comments

GbpusdGbpjpy weekly analysis
H4 H1 Breaktrendline
future downside support and resistance follow
short:165.28
SL:165.83
tp.164.16

Trend Breakout in TATAPOWER
TATAPOWER is breaking out the long term sideways trend.
We can expect it to touch 270 from current level of 226.
Possible intermediate targets are 236, 250.
Happy Trading !!

AUDCAD possible opportunityAUDCAD short opportunity.
This is served as research for my own trading plan.
Do your own research.

Elliot Wave Scenario BTC holds 37k last three days which gives slow progress to the upside. Breakout seems more possible! Volume has been raised constantly. If it keeps it between 38k 39k at the end of the day, a good signal to the upside. If so, 41k will be the rejection. Monday will be critical for the trading volume.
Sunday is whales day so keep an eye on range trade with a small percentage.

It's Time to Have Our Hero Back!Hero has broken a long daily downtrend and prices are began to break previous high on the low timeframes. On a short term trade this idea is good and for a long term trade the bias is long and change in momentum may be coming to this coin.
HLong

Trade Idea About Idea 💡The price has broken previous downtrend and previous high and did a retest on a previous support. Now the bulls have more probability to take over. Please adjust your risk according to the SL and TP mentioned in this idea. Good Luck. NFA
ILong
