When Trends Are Young: A Framework for Maximizing Reward-to-RiskContext: Why Early-Stage Trends Matter
Market trends are not static phenomena. They evolve through phases, each offering very different structural characteristics from a risk management perspective. One of the most overlooked distinctions is where a market sits within its trend lifecycle. Early-stage trends often differ meaningfully from mature or exhausted ones, particularly in how risk and potential reward are distributed.
This article presents an educational framework focused on early-stage trend participation, emphasizing how objective trend identification, structural entries, and distant reference targets can combine to create asymmetric reward-to-risk profiles. The discussion is not outcome-focused. Instead, it centers on how trade structure influences expectancy, consistency, and overall risk efficiency.
Identifying Trend Direction with Objective Rules
Trend direction is the foundation of this framework. Rather than relying on subjective interpretation, this case study uses the Supertrend indicator as an objective method for defining directional bias.
Supertrend operates by:
Establishing a directional state (uptrend or downtrend)
Providing a dynamic invalidation level
Adjusting as volatility and price structure evolve
In the scenario examined here, Supertrend transitions into a newly established downtrend. This transition is significant because early trend phases often present:
Limited structural opposition
Cleaner directional flows
Greater potential for price exploration before encountering major support zones
The goal is not to anticipate how far price will move, but to recognize when the conditions for favorable trade geometry are present.
Trade Structure: From Breakout to Invalidation
With directional bias defined, attention shifts to how a trade is structured, not whether it is taken.
The proposed framework engages the market at a breakout point aligned with the downtrend, rather than attempting to fade or counter the move. This alignment simplifies decision-making and ensures that:
Entry is consistent with prevailing momentum
Risk is defined by structure rather than emotion
In this case study:
Breakout level: 425’2
Initial Supertrend invalidation: near 450
Adjusted stop location: 440’6
The adjustment of the stop reflects a practical consideration: stops placed exactly at indicator levels are often vulnerable to short-term volatility. By slightly refining the stop location, the structure remains intact while reducing the likelihood of premature invalidation.
Targeting with Relevant Supports
Targets are often the weakest element of trade design. Arbitrary price objectives or fixed multiples can disconnect a trade from actual market structure.
This framework instead uses a UFO Support (UnFilled Orders) as a reference point. UFOs represent areas where price previously moved too quickly to facilitate meaningful two-sided trade, leaving behind potential zones of future interaction.
In trending environments, especially early-stage trends, price often seeks out these distant structural references.
For this case study:
Support zone: 382
This level is significantly removed from the entry point, not because of optimism, but because:
The trend is in an early phase
Structural support has not yet been tested
There is limited evidence of opposing accumulation at higher levels
The result is a target derived from market structure, not projection.
Reward-to-Risk Expansion: The Core Advantage
With all components defined, the reward-to-risk profile becomes clear:
Entry: 425’2
Stop: 440’6
Risk: ~15’4 points
Target: 382
Potential reward: ~43.2 points
This produces a reward-to-risk ratio of approximately 2.8:1.
The significance here is not the number itself, but how it is achieved:
Without tightening stops unrealistically
Without extending targets arbitrarily
Without predicting future price behavior
Early-stage trends naturally allow reward-to-risk expansion because risk is defined nearby, while structural references may exist far away. Over time, such asymmetry can:
Improve trade expectancy
Reduce reliance on high win rates
Enhance risk-adjusted performance metrics
Application to Futures Markets
This framework is applied using corn futures (ZC) as a case study. The analysis itself is performed on the standard futures contract due to its liquidity and structural clarity. However, the same logic applies seamlessly to the micro futures contract (MZC), allowing for:
Finer position sizing
Greater accessibility
More granular risk control
Importantly, the analytical framework does not change with contract size. Only exposure does.
Contract Specifications Overview
Standard Corn Futures (ZC):
Contract size: 5,000 bushels
Minimum price fluctuation: 1/4 of one cent (0.0025) per bushel
Tick value: $12.50 per tick
Quoted in cents per bushel
Current margin requirement per contract: $975
Micro Corn Futures (MZC):
Contract size: 500 bushels
Minimum price fluctuation: 0.0050 per bushel
Tick value: $2.50 per tick
Designed to mirror the standard contract at reduced scale
Current margin requirement per micro contract: $97
Margin Requirements:
Initial and maintenance margins vary and are subject to change
Micro contracts typically require a fraction of the standard contract margin
Traders should always verify current margin requirements with their broker
These specifications highlight how the same structural idea can be expressed across different risk profiles.
Risk Management Considerations
Despite favorable reward-to-risk characteristics, early-stage trends are not inherently “safer.” Risk management remains central.
Key considerations include:
Predefining risk before trade entry
Adjusting position size rather than widening stops
Accepting invalidation quickly when structure fails
Understanding that no single trade defines performance
Reward-to-risk asymmetry does not eliminate losses; it reframes how losses are absorbed within a broader process.
Chart Walkthrough
The accompanying chart illustrates:
The Supertrend transition into a downtrend
The structural breakout point
The refined stop location
The distant UFO support zone used as a target reference
Each element serves a specific function within the framework. None rely on hindsight, and none assume future certainty. Together, they demonstrate how structure, not prediction, drives trade design.
Key Takeaways
Early-stage trends often provide superior trade geometry
Trend alignment simplifies decision-making
UFOs offer structurally grounded target references
Reward-to-risk expansion is a byproduct of structure, not optimism
Consistency is built through frameworks, not outcomes
Data Consideration
When charting futures, the data provided could be delayed. Traders working with the ticker symbols discussed in this idea may prefer to use CME Group real-time data plan on TradingView: www.tradingview.com - This consideration is particularly important for shorter-term traders, whereas it may be less critical for those focused on longer-term trading strategies.
General Disclaimer
The trade ideas presented herein are solely for illustrative purposes forming a part of a case study intended to demonstrate key principles in risk management within the context of the specific market scenarios discussed. These ideas are not to be interpreted as investment recommendations or financial advice. They do not endorse or promote any specific trading strategies, financial products, or services. The information provided is based on data believed to be reliable; however, its accuracy or completeness cannot be guaranteed. Trading in financial markets involves risks, including the potential loss of principal. Each individual should conduct their own research and consult with professional financial advisors before making any investment decisions. The author or publisher of this content bears no responsibility for any actions taken based on the information provided or for any resultant financial or other losses.
Trendfollowing

Bearish Trend Continuation — Short SetupBias: Short while price remains below 30.41:
Technical structure remains decisively bearish. ADX (~41) confirms a strong directional downtrend, with price trading well below both the SMA50 (36) and SMA200 (54), reinforcing the prevailing downside structure. Short-term momentum indicators support continuation, with a negative MACD histogram and subdued RSI signaling sustained selling pressure.
Sentiment is deeply negative, influenced by recent high-impact developments including senior leadership changes, materially increasing the probability of further downside and supporting a trend-following short bias. Order flow indicating no clear institutional distribution signal.
Execution plan:
Entry: 26.51–26.80
Stop: 30.41
Target: 17.78 (primary)
Conservative target: 26.01
Estimated duration of the swing trade: 20–40 days
Market regime context is currently characterized by a broader low-volatility bullish environment, which can create tactical headwinds for short trades. Strict position sizing and disciplined stop management are therefore essential. Monitor closely for any shift in order flow toward Absorption or materially positive fundamental developments that could alter the risk profile.

MP Materials: Pentagon’s Rare Earth Champion in Trump’s Project MP, owner of Mountain Pass, already has a major Pentagon stake and is a primary beneficiary of Trump’s critical‑minerals stockpile narrative. Focusing on trend structure, pullback zones, and continuation setups as stockpile news hits.

XAUUSD - Long Entries Targeting Continuation Higher HighsPrice is in a strong uptrend inside an ascending channel, so bias is bullish toward higher levels around 5,200–5,300. The idea is to wait for a pullback into the marked demand/support zone near the lower channel line and then look for long entries rather than selling.

SOL 15m LONG TP HIT _ Continuation Timeframe: 15m (SOLUSDT.P)
Trade recap:
SOL respected the intraday support cluster around 125.6–125.1, reclaimed structure, and expanded into the next liquidity area.
Entry idea: reclaim/continuation trigger off 125.6–125.1
Take Profit: 127.60 ✅ (hit)
Key levels:
• Support cluster: 125.6–125.1
• Invalidation: 124.85 (aggressive) / 123.94 (hard invalidation)
• Target / liquidity: 127.6
Execution note (important):
Avoid taking signals during low-visibility / choppy conditions (tight ranges, unclear direction). In those moments, indicators can produce noisy signals. The higher-probability approach is to wait until price chooses a direction, align with your structure/HTF bias, and execute with the trend.
Risk management:
Once momentum expands, protect the position (move to BE or trail below the latest 15m structure) while trend remains intact.
—
🔗 FPZ Lite (free indicator):
If you want more trade recaps and execution plans, follow for updates.

Gold (XAUUSD) – Bullish Channel ContinuationGold has already delivered the anticipated upside expansion, and price is now trading within a well-defined ascending channel. From a structural perspective, the market has transitioned into a bullish environment, at least on the medium timeframes.
So far, every correction observed on lower timeframes has acted as a continuation pattern, rather than a reversal signal. Pullbacks have remained shallow, controlled, and corrective in nature — a strong indication that buyers are still in control and that momentum has not yet shown signs of exhaustion.
Key technical observations:
Clear ascending channel structure
Strong impulsive legs followed by continuation-type corrections
No distribution or topping structure visible at this stage
Price is still comfortably trading below the upper boundary of the channel, leaving room for further upside expansion
As long as price respects the channel structure and corrective moves remain shallow, the path of least resistance stays to the upside, with the upper boundary of the channel acting as the next logical magnet.
This is a trend-following context, not a mean-reversion setup. Any bearish narrative is premature unless the channel structure is broken with acceptance.
Trading Perspective
Prefer buy-the-dip / continuation setups on lower timeframes
Focus on pullbacks that hold structure and show bullish confirmation
Avoid aggressive counter-trend shorts while price remains inside the channel
Invalidation
A clean breakdown and acceptance below the ascending channel would be the first technical signal of trend weakness and possible regime shift.
Conclusion
Until proven otherwise, the trend remains healthy, and corrections are viewed as opportunities, not threats. The market has not yet shown any meaningful sign of buyer exhaustion.

ETHUSD – Weekly Update | Key Level Being TestedThesis
CRYPTOCAP:ETH remains in a long-term bullish structure. Price is rotating higher without a full reset to the 200WMA, suggesting underlying strength and a continuation bias.
Context
- Weekly timeframe
- Long-term ascending wedge intact
- Prior cycle highs still acting as structural reference
What I see
- ETH did not retest the 200WMA around $2450
- Price reclaimed the 50-day MA around $3000
- ETH is now testing the 0.5 Fibonacci level near $3160
- Structure shows higher lows and improving momentum
What matters now
- $3160 needs to flip to support to confirm continuation
- A successful hold here opens a move toward the upper wedge boundary
- Momentum remains constructive while price stays above the 50-day MA
Buy / Accumulation zone
- Current area around $3160 becomes actionable if confirmed as support
- Deeper pullbacks toward moving averages remain secondary opportunities
Targets
- Near-term: $3800 area (200-day MA + upper wedge confluence)
- Long-term cycle target: ~$9000 (Wave 5 extension)
Risk / Invalidation
- Loss of $3000 and failure to hold the 50-day MA would delay the bullish scenario

SPY – ATH into Heavy Macro Week | Trend Still IntactThesis
AMEX:SPY continues to trade in a mature but intact bullish cycle, pushing to new all-time highs despite a heavy macro and event-driven calendar.
Context
- Weekly timeframe
- CPI, PPI, Jobless Claims ahead
- Start of key earnings season
- Supreme Court ruling delayed into next week, adding uncertainty
What I see
- Market printed another ATH and closed the week at the highs
- Price remains well above rising trend support
- No visible distribution or topping structure yet
- Momentum remains strong despite known macro risks
What matters now
- As long as price holds above the rising channel, the trend remains bullish
- Last CPI print came in much cooler than expected
- A second consecutive soft CPI would confirm a disinflation trend and likely fuel further upside
- Market is clearly not pricing near-term stress
Buy / Accumulation zone
- This is not an area for aggressive new buying
- Focus shifts from adding risk to managing and cleaning the portfolio
- Selectively trimming positions that fully rode the last 5–6 years of the cycle
Targets
- Trend-following extension remains open toward higher Fib projections
- No confirmed cycle top yet
Risk / Invalidation
- A sustained loss of the rising channel would signal the need to reduce exposure
- Until then, price action favors holding, not anticipating a top

Home ConstructionLooking at ITB, home construction could be finally waking up. I'm going to add this to my watch list for both my Trend Following account (weekly charts) and Swing Trading account (daily charts). I've got a list of stocks with good volume to consider buying once we get a pullback and an entry signal. As soon I notice a good setup that I like I'll try to go ahead and post it. Cheers!!

Forex Trend Following. Short. CAD/CHF. Daily. Classic, pure trend following. Short entry on Daily timeframe for CAD/CHF.
OANDA:CADCHF

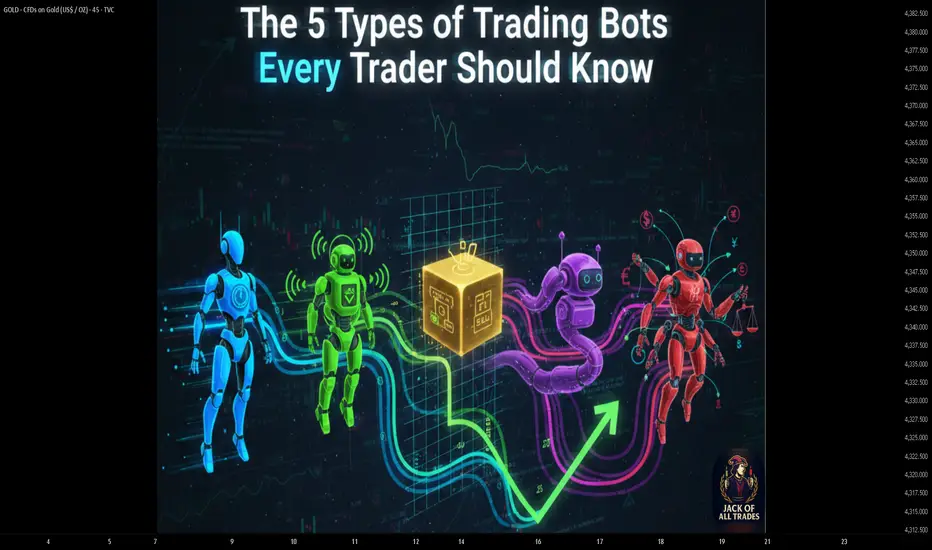
The 5 Types of Trading Bots Every Trader Should Know
Not All Trading Bots Are the Same - Some Amplify Your Edge, Some Amplify Your Pain
Saying "I want a bot" is like saying "I want a vehicle":
A Formula 1 car
A delivery truck
A scooter
A helicopter
All are vehicles. None are interchangeable.
In the era of AI‑assisted trading, bots are execution engines for your ideas. This post breaks down five major bot archetypes so you can stop hunting for "the best bot" and start matching the right structure to your market, risk profile, and skill set.
First Cold Truth: Bots Don't Create Edge — They Scale It
Before we talk types, it’s worth being brutally honest:
If your strategy has no edge, a bot just lets you lose money faster, more consistently, and with perfect discipline.
Bots are about discipline , speed , and scalability . The edge still has to come from your logic, testing, and risk framework.
Quick Map of the 5 Bot Types
Trend‑Following: Ride directional moves, ignore the noise.
Mean‑Reversion: Fade extremes, bet on snap‑backs.
Grid: Harvest volatility inside a range.
Signal‑Based: Turn ideas/alerts into consistent execution.
Arbitrage: Exploit price differences between related markets.
From here, you want to ask two things: What structure is the market in? and What structure is my brain comfortable with?
Type 1 – Trend‑Following Bots
These bots try to behave like a disciplined trend trader that never hesitates and never gets emotional.
Core idea: Buy strength in uptrends, sell weakness in downtrends.
Typical tools:
Moving‑average crossovers (fast vs slow)
Breakouts above recent highs or below recent lows
Momentum filters (e.g., ADX, rate of change, volatility filters)
Shine in: Clean, directional markets where pullbacks are shallow.
Struggle in: Sideways chop where price crosses the same levels repeatedly.
Main risk: A long sequence of small whipsaw losses when there is no real trend.
In the AI era, you can use models to classify regimes (trending vs ranging) and only let the trend bot run when the environment actually supports it.
//@version=6
indicator("Simple Trend Filter", overlay=true)
fast = ta.ema(close, 20)
slow = ta.ema(close, 50)
trendUp = fast > slow
trendDown = fast < slow
// Simple visual trend filter
plot(fast, color=color.teal)
plot(slow, color=color.orange)
bgcolor(trendUp ? color.new(color.teal, 90) : trendDown ? color.new(color.orange, 90) : na)
This kind of logic is usually just one piece of a full bot, but it shows how a trend‑following engine "sees" the market.
Type 2 – Mean‑Reversion Bots
Mean‑reversion bots assume that, most of the time, price doesn't drift off to infinity — it oscillates around some reference value.
Core idea: Fade overextended moves and bet on a return to the mean.
Typical tools:
RSI or Stochastic extremes ("overbought" / "oversold")
Touches or pierces of Bollinger Bands
Deviation from a moving average (z‑score, % distance)
Shine in: Ranging markets, stable channels, and mean‑reverting pairs.
Struggle in: Strong trends where "oversold" keeps getting more oversold.
Main risk: One big runaway move can erase many small wins if sizing and stops are not controlled.
These bots can feel smooth until they don't. AI can help here by measuring when volatility/range structure changes and cutting exposure before that "one big trend" shows up.
Type 3 – Grid Bots
Grid bots are volatility harvesters. They care less about direction and more about price oscillating through pre‑defined levels.
Core idea: Place a ladder of buy and sell orders above and below price.
Profit engine: As price bounces through the grid, the bot systematically buys lower, sells higher, and repeats.
Shine in: Sideways but active markets that revisit levels frequently.
Struggle in: Strong one‑way moves that blow through the grid and never mean‑revert.
Main risk: Deep, unrealized drawdowns if price trends hard against the grid without a safety mechanism.
Smart grid design in the AI era often includes:
Dynamic grid width that widens or tightens based on volatility
Max drawdown or margin‑usage limits that trigger a partial or full shutdown
Regime filters that turn the grid off when a strong trend is detected
Type 4 – Signal‑Based Bots
Signal bots don't "think" on their own – they are pure executors. Their job is to turn a human or model‑generated signal into consistent, rules‑based action.
Core idea: Separate idea generation from order execution .
Signal sources can include:
Multi‑indicator confluence (trend + volume + volatility)
Pattern recognition (breakouts, candle patterns, structures)
Order‑flow or whale‑tracking alerts
On‑chain, macro, or sentiment data for crypto and indices
Shine in: Any market where the underlying signal logic has been tested and proven.
Struggle in: Environments where the signal is over‑fitted, delayed, or not monitored.
Main risk: Blind faith in a black‑box signal without understanding its limits.
This is where AI often plugs in directly – models generate scores or labels, and the bot simply acts when the score crosses a threshold.
Type 5 – Arbitrage Bots
Arbitrage bots focus on relationships instead of single charts. They look for small, temporary mispricings and try to lock them in.
Core idea: Buy where something is cheap and sell where it's expensive, as close to simultaneously as possible.
Common approaches:
Same asset, different exchanges (spot vs spot or spot vs perp)
Triangular FX arbitrage between three currency pairs
Statistical arbitrage between correlated assets that have diverged
Shine in: Fragmented, less efficient markets with occasional big gaps.
Struggle in: Highly efficient markets where spreads and latency competition eat the edge.
Main risk: Execution risk – slippage, fees, and delays can flip a theoretical "risk‑free" trade into a losing one.
These are the most infrastructure‑heavy bots. Latency, connectivity, fee structure, and capital sizing matter as much as the model itself.
Choosing Your Bot in the AI Era
Instead of asking "Which bot makes the most?", ask:
What market structure am I actually trading most of the time?
How much drawdown and variance am I truly comfortable with?
Am I more aligned with riding trends or fading extremes?
What is my technical and infrastructure level right now?
Where can AI realistically help me – signal quality, risk controls, or execution?
AI can support you by:
Classifying regimes (trend vs range) and routing orders to the right bot type
Monitoring portfolio‑level risk across multiple bots and symbols
Detecting when performance degrades and suggesting parameter reviews
But the decision of which bot to run, when to turn it off, and how to size it is still your responsibility.
Your Turn
Which of these five bot types actually fits your temperament and the markets you trade right now?
If you had to upgrade one layer of your automation with AI today - signal generation, risk management, or execution - which one would move the needle the most for you?
Share it below. The clearer you are about what kind of bot you’re running and why , the less you’ll ever have to blame "the bot" when the outcome doesn’t match the plan.
GBP/USD: Very Bullish PatternThe GBPUSD pair is currently trading in a long term bullish trend.
Earlier this month, the market established a new higher high, subsequently initiating a corrective movement.
A bullish flag pattern has formed, within which a minor bearish trend has been established.
Yesterday, the pair began to appreciate, with buyers successfully violating the resistance level of the flag.
This development may potentially instigate a trend-following movement.
The next objective is 1.3385.

BTC Daily Swing Lab: 50/200 EMA + ATR Stop (Open-Source StrategyThis is a simple daily swing framework for BTC and other major crypto pairs.
Rule 1: Only trade long when the 50 EMA is above the 200 EMA.
Rule 2: Use an ATR-based trailing stop.
Rule 3: Exit when volatility catches up or the trend breaks.
I built this as a lab tool to study daily swings on BTC, ETH, SOL and other majors without over-complicating the rules.
CORE IDEA
1. Define a bullish regime: 50 EMA above 200 EMA.
2. Only look for long trades inside that bull regime.
3. Use an ATR stop to trail exits instead of guessing tops.
4. Close if the 50/200 EMAs lose their bullish structure.
The goal is not to catch every wiggle. The goal is to ride the middle of big daily moves with clear, testable rules.
HOW I USE IT ON BTC 1D
Timeframe: 1D
Direction: Long-only
I use it to:
* Stay out of chop when the 50 is under the 200.
* Study how ATR stops behave in different BTC cycles.
* Compare mechanical exits to my discretionary levels.
Try it on ETH, SOL or your favorite majors and see how the behavior changes.
HOW TO ADD IT
1. Open BTCUSD and switch to the 1D timeframe.
2. Add “Lab: Daily 50/200 EMA + ATR Stop (Long Only) – by FlyingOceanTiger” from the Indicators & Strategies tab.
3. Open Strategy Tester and scroll through past bull and bear cycles to see how it handled them.
Feel free to fork the code and experiment with your own rules (different EMAs, ATR settings, extra filters). If you build a variation you like, drop it in the comments so I can check it out.
DISCLAIMER
This is a research tool and not financial advice. Always do your own testing and manage your risk.

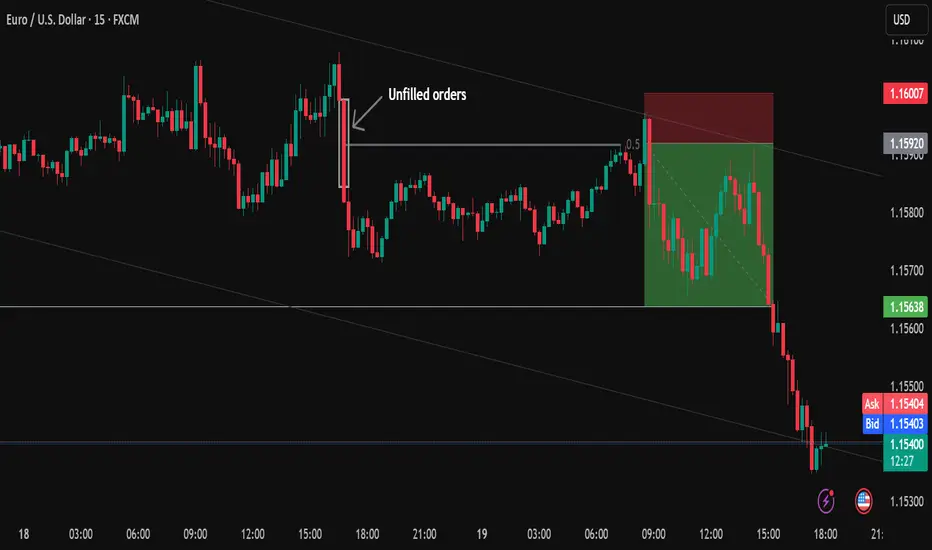
The market isn’t random. It’s driven by algorithms.The market is not arbitrary. It is powered by algorithms that essentially accomplish just two tasks:
either push the price in the direction of the next liquidity pool or pull it back to fill the orders they missed en route, such as leftover blocks, imbalances, and unfulfilled orders.
Understanding that basic behavior is the foundation of everything I trade.
Since it indicates where the algorithm is attempting to go next, I begin with the higher-timeframe trend.
Then, in order to determine which side is in control, I wait for a powerful push, a distinct, quick displacement.
The algorithm nearly always retraces slowly after that push because it must return to correct imbalances and complete the orders it overlooked.
Additionally, that gradual decline indicates that the trend is still going strong.
A quick or forceful pullback indicates that the algorithm is probably changing course because it is creating new imbalances rather than going back to correct the previous ones.
I therefore only accept trades when the price gradually returns to my order blocks, imbalances, or prior liquidity areas before moving on to the next pool of liquidity.
I don't forecast highs or lows.
I do not oppose the market.
All I'm doing is following the algorithm as it shifts from one liquidity pool to the next, making any necessary corrections before moving on.
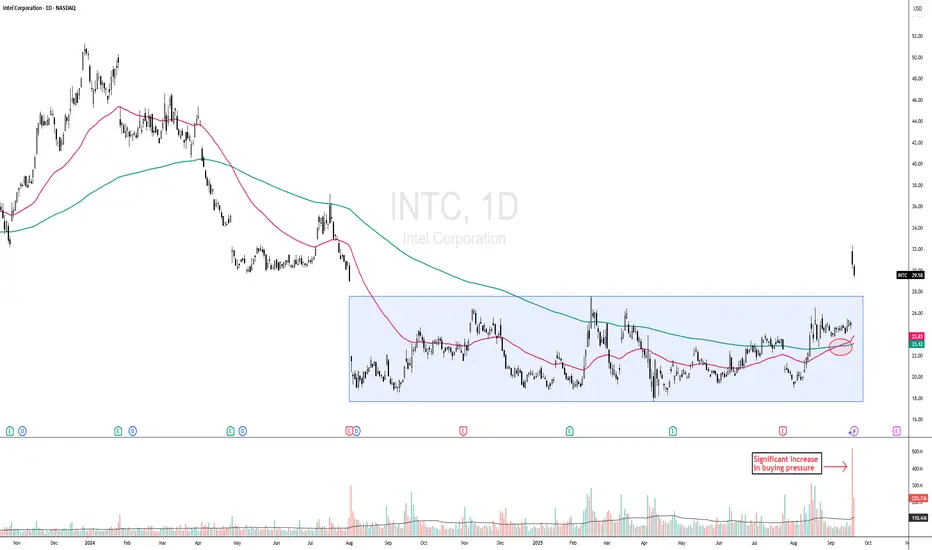
DOW THEORY PLAY - INTC CONFIRMS BREAKOUT FROM ACCUMULATION PHASEINTC - CURRENT PRICE : 29.58
Key Technical Highlights:
1. Breakout from Accumulation Phase with Strong Volume
Intel has successfully broken out of a prolonged sideways accumulation zone. The breakout is accompanied by significantly higher-than-average volume , indicating strong buying interest and institutional participation.
2. New 52-Week High Achieved
Price has breached the previous 52-week high, signaling bullish momentum and the potential start of a new price discovery phase. Historically, such breakouts often attract trend-following traders.
3. Golden Cross Formation (look at the red circle)
A Golden Cross has formed for the first time in a long period, where the 50-day EMA has crossed above the 200-day EMA — a classic long-term bullish confirmation. Notably, the last occurrence of this pattern was in July 2023 , making this the first reappearance in over two years, further reinforcing its significance as a potential turning point in market sentiment.
4. Dow Theory Alignment – Public Participation Phase
According to Dow Theory, this marks the second phase of a major uptrend — the Public Participation Phase — where broader market participants begin to enter following early accumulation by smart money. This phase typically sees strong price advances.
ENTRY PRICE : 28.00 - 30.00
FIRST TARGET : 35.00
SECOND TARGET : 42.00
SUPPORT : 25.00 (CUTLOSS below 25.00 on closing basis)
Note : This is related to point no 1. Markets have a tendency to "fall of their own weight." At bottoms, however, markets require a significant increase in buying pressure, reflected in greater volume, to launch a new bull market. A more technical way of looking at this difference is that a market can fall just from inertia. Lack of demand or buying interest on the part of traders is often enough to push a market lower; but a market does not go up on inertia. Prices only rise when demand exceeds supply and buyers are more aggressive than sellers.
Gold’s Pullback: The Dip Everyone’s Afraid to Buy🏆 Gold’s Pullback: The Dip Everyone’s Afraid to Buy 🏆
Gold just gave us the pullback we’ve been waiting for. After an incredible vertical run to $4,400, price has tapped right back into long-term trend support — exactly where past rallies have launched from.
Zoom out on the weekly channel and it’s clear:
Momentum spikes look scary, but historically they’ve reset just before the next leg up.
Volume confirms conviction — this isn’t a fade; it’s a reload.
On the 4H chart, buyers are already defending the trendline like clockwork.
On the 15M, we’re seeing the first signs of stabilization.
💡 My take:
This isn’t the time to panic — it’s the time to position.
“Buy fear, sell greed” wasn’t written for stocks; it was written for gold.
🎯 Watch zone: $4,000–$4,050 — that’s my reload range.
Next resistance: $4,400 → $4,800 if the structure holds.
📈 I’m buying the dip. Are you brave enough to?
#Gold #GC1 #Comex #Futures #BuyTheDip #Macro #Commodities #TrendFollowing #TechnicalAnalysis
US30: Consecutive breakouts signal an emerging downtrend
SPREADEX:DJI – When price rejects the high, the market begins to shift
On the 30-minute chart, price action is clearly signaling a loss of bullish momentum and a transition toward a bearish structure.
________________________________________
🧠 Price Action Analysis
1. First Failed Breakout
Price initially broke above the ascending trendline that had held since early October — but failed to hold the breakout.
➤ A classic early warning of buyer exhaustion, often seen during distribution phases.
2. Multi-Layered Resistance Zone
The 46,725 – 46,779 region has become a clustered resistance zone, rejecting price repeatedly.
➤ Multiple rejections here suggest dominant selling pressure, with strong supply overhead.
3. Second False Breakout
A more subtle second breakout attempt followed — but again, price was swiftly rejected.
➤ Consecutive failed breakouts typically indicate a lack of conviction and precede sharp reversals.
________________________________________
📉 Trend Structure Has Shifted Bearish
• Lower highs and lower lows now visible
• Price broke below the previous trendline
• Pullback attempts failed to reclaim broken support
• Market is respecting resistance instead of support
➡ These are clear signs of a short-term downtrend emerging.
________________________________________
🔻 Trading Strategy: Favoring Sell Setups in the New Bearish Context
✴️ Scenario 1: Sell at Retest of Proven Resistance Zone
• Optimal Sell Zone: 46,700 – 46,750
• This area has already triggered two failed breakouts — a third touch could be the ideal trap for late buyers
• Watch for bearish rejection candles (pin bars, bearish engulfing, etc.)
Suggested Sell Limit Order:
→ Entry: 46,730
→ Stop Loss: 46,830 (above prior swing high)
→ TP1: 46,500
→ TP2: 46,300
→ Risk-Reward: At least 1:2
_______________________________________
✴️ Scenario 2: Momentum Sell on Breakdown of Local Support
• Trigger Level: 46,580 — if price breaks below with strong momentum (long red candle, increased volume)
• Confirms trend continuation after consolidation
Suggested Sell Breakout Order:
→ Entry: 46,580
→ Stop Loss: 46,680
→ Target: 46,350 – 46,200
→ Tip: Use smaller position size if breakout appears weak to avoid getting trapped in a fakeout
________________________________________
🎯 Trade Management
• Only enter trades with clear price rejection or momentum confirmation
• Move SL to breakeven after TP1 is hit to lock in safety
• Exit the trade if price closes above 46,830 — that would invalidate the bearish thesis
________________________________________
False breakouts leave a trail — for those who know how to read it. It's not a failure. It’s the market whispering that direction has changed.
Please like and comment below to support our traders. Your reactions will motivate us to do more analysis in the future 🙏✨
Harry Andrew @ ZuperView

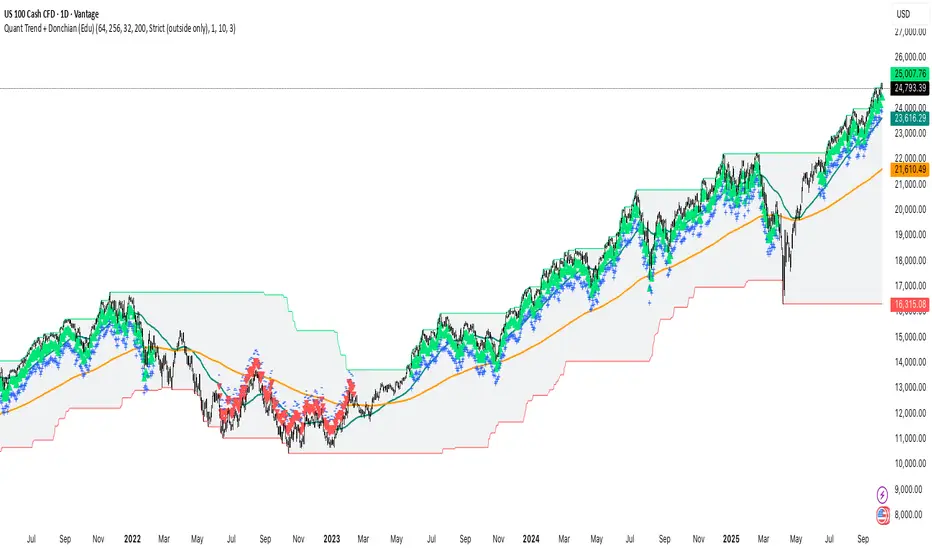
Trend-Following + Donchian Breakout (Regime Visualizer)Most traders chase trends too late or exit too early.
Quant systems don’t predict — they measure and adapt.
This educational chart uses the public Quant Trend + Donchian indicator to visualize how trend-following and breakout logic can define market regimes in NASDAQ 100 & S&P 500.
⚙️ Core Logic
• Trend — EMA(64 vs 256): approximates EWMAC trend state.
• Breakout — Donchian (200): identifies volatility-based range breaks.
• Volatility awareness — internally normalized to adjust behavior across markets.
📊 How to read it
• EMA fast > EMA slow and price near Donchian high → bullish trend regime.
• EMA fast < EMA slow and price near Donchian low → bearish regime.
• Inside channel with EMAs tangled → range or noise.
💡 Key insight
Regime definition + volatility scaling > entry cleverness.
Systems survive not by prediction, but by risk-controlled persistence .
This public view illustrates the foundations used in my more advanced risk-scaled quant strategies for NASDAQ and S&P indices.
#Quant #TrendFollowing #Breakout #Donchian #EMA #NASDAQ #SP500 #SystematicTrading #AlgorithmicTrading #Volatility
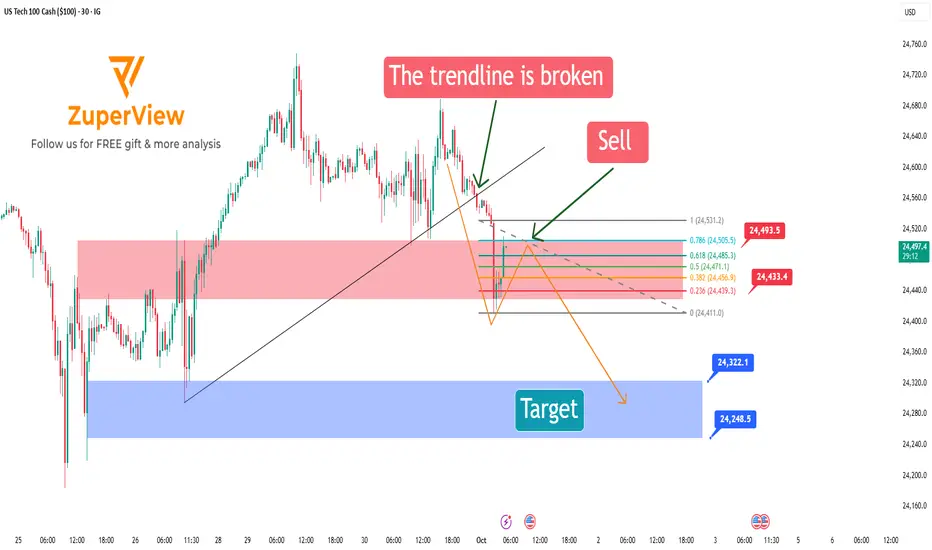
US100: Short setup using fib levels from flash candleIG:NASDAQ m30 chart analysis: short action!!
The chart signals a potential short opportunity after breaking the previous bullish structure and printing a strong bearish flash candle. The strategy focuses on shorting the pullback using fibonacci retracement measured from that candle.
🔺 1. Structure break and flash candle confirmation
The price broke below the rising trendline supporting the bullish move from sep 26 to sep 30.
Immediately after, a large bearish flash candle appeared — signaling strong selling pressure and a potential trend reversal.
This candle becomes the reference point for measuring the retracement and anticipating a continuation to the downside.
📏 2. Measuring fibonacci from the flash candle (high → low)
Apply fibonacci from the high to the low of the flash candle.
This technique identifies potential resistance zones within the context of that specific bearish move.
Key fibonacci levels to watch:
0.5: 24,472.0 | 0.618: 24,486.4 | 0.786: 24,506.9
🎯 3. Ideal entry zone: from 0.382 to 0.786
After a strong bearish flash candle, price often pulls back moderately before continuing lower.
The optimal short zone is between fibo 0.382 and 0.786:
This respects the integrity of the bearish impulse.
A retracement smaller than 0.382 may be too shallow to confirm a strong rejection.
A retracement beyond 0.786 might indicate loss of bearish momentum and invalidate the flash candle setup.
🎯 4. Bearish scenario and targets
If price reacts at the 0.382–0.786 zone and resumes downtrend, a potential ABC bearish correction forms:
A: Flash move down
B: Pullback to fib zone
C: Next impulsive leg down
Suggested take-profit levels:
🎯 Target 1: 24,322.1
🎯 Target 2: 24,248.5
🛡️ Stop-loss: above the flash candle’s high (around 24,533)
✅ Summary
After a structure break and a decisive bearish flash candle, us tech 100 is showing a clear bearish setup.
Using fibonacci measured from the high to low of the flash candle helps identify high-probability pullback zones.
📌 Entry zone: between 0.382 and 0.786 retracement — outside this range, the flash candle's power may be invalidated.
This is a momentum-following trade with defined entry, stop loss, and take profit zones.
Wait for confirmation from price action within the fib levels before entering.
Please like and comment below to support our traders. Your reactions will motivate us to do more analysis in the future 🙏✨
Harry Andrew @ ZuperView
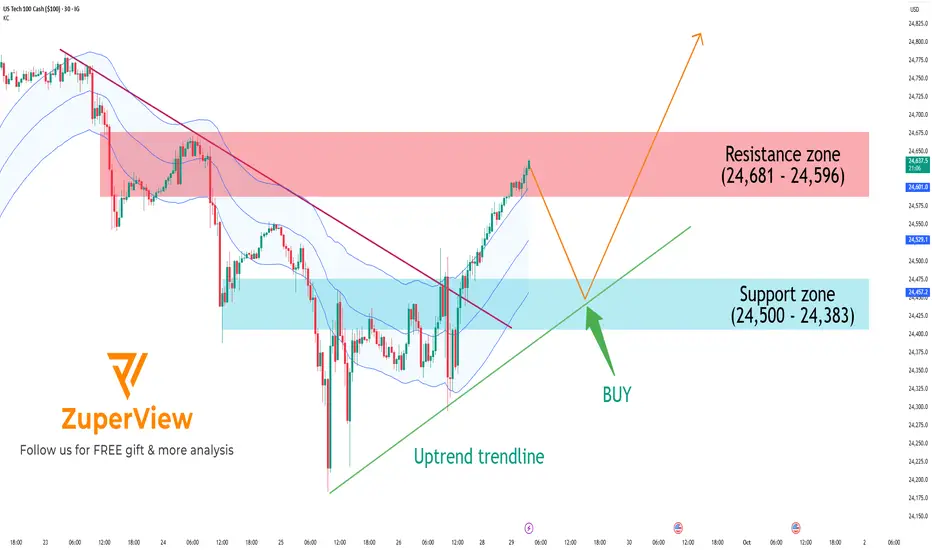
US100: Approaching resistance, pullback likely before breakoutThe IG:NASDAQ has shown a strong short-term recovery after breaking a major descending trendline. However, price is now testing a significant resistance zone, and a technical pullback is likely before the uptrend can continue.
📊 Technical Analysis: 30-minute Chart
📉 1. Overall Trend
Price has successfully broken above a descending trendline (red line), shifting market structure from bearish to bullish.
An uptrend line (green) is now acting as dynamic support.
Price is trading near the upper band of the Keltner Channel, indicating sustained bullish momentum.
🟥 2. Resistance Zone: 24,596 – 24,681
This zone has acted as a strong supply area in the past, causing multiple rejections.
Price is currently testing this area again → a rejection or short-term pullback is highly probable.
🟦 3. Support Zone: 24,383 – 24,500
This zone overlaps with previous consolidation and aligns with the uptrend line.
If a pullback occurs, this area could attract buyers and act as a launchpad for the next leg up.
🔁 Potential Trade Setups
✳️ Primary Scenario (preferred):
Price rejects at resistance → pulls back to support → bounces and resumes the uptrend
Wait for a pullback toward 24,500 – 24,383
Look for bullish price action (e.g., bullish engulfing, hammer) for entry
Enter long if support holds:
🎯 TP1: 24,650
🎯 TP2: 24,700+
🛑 SL: Below 24,350 (trendline invalidation)
🔻 Alternative Scenario (risk):
If price breaks below 24,383 and the uptrend line fails → short-term trend could shift sideways or bearish
Avoid long entries without a confirmed recovery
Re-evaluate trend structure if support fails
✅ Conclusion
A short-term uptrend is in place
However, price is now testing a major resistance zone, and a healthy pullback is likely
Please like and comment below to support our traders. Your reactions will motivate us to do more analysis in the future 🙏✨
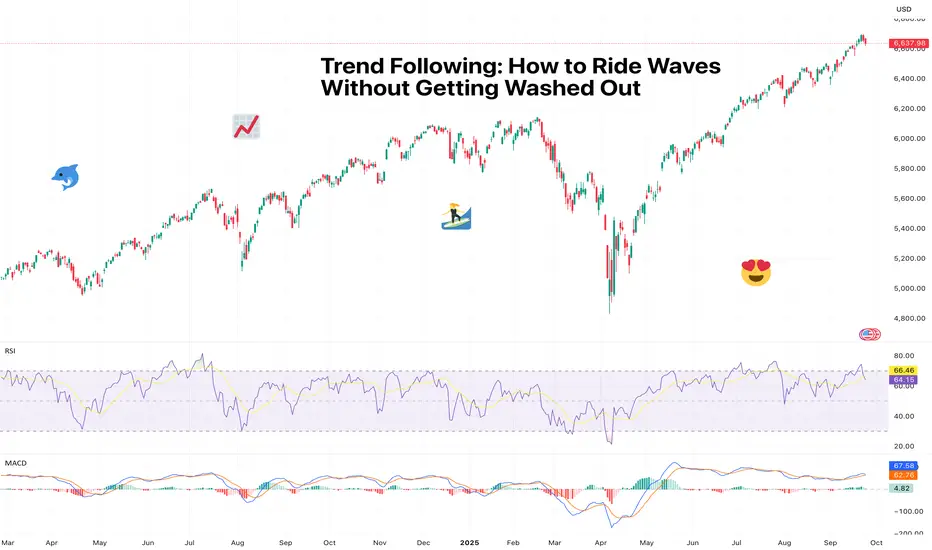
Trend Following: How to Ride Waves Without Getting Washed OutMarkets move in waves. Easy, right? But if you’ve tried catching one only to find out you get washed out, you’ve realized it ain’t’ that easy.
Sometimes there are gentle ripples that lull traders into boredom, other times they’re tsunamis that wipe out everything in sight.
The trick isn’t predicting when the next big set will hit – it’s learning how to catch it without falling off your board from the get-go. That’s where trend following comes in. Simple, structured, and surprisingly effective, it’s a strategy that says: stop guessing, start riding.
🌊 Catching It, Not Fighting It
At its core, trend following is about spotting momentum and sticking with it. If prices are climbing, you’re a buyer. If they’re falling, you’re a seller. No need to argue with the market about “fair value.” The trend follower’s mantra is: Mr. Market is always right, I’m just here to hitch a ride.
Why does this work? Because markets are essentially a bunch of thinking participants who move in herds. They share the same fears, hopes, expectations, and goals.
Traders, funds, and algorithms pile into the same ideas, technical patterns, and price levels, pushing valuations higher or lower. Your job isn’t to outsmart the herd – it’s to ride with it until the stampede loses steam.
Or better yet, spot the opportunity before the herd. "I am the animal at the head of the pack. I either get eaten, or I get the good grass,” says David Tepper, hedge fund manager.
🤫 Why It’s Harder Than It Sounds
“Buy high, sell higher” feels wrong anywhere but in the market. Human brains are usually wired to hunt for bargains, not chase expensive things. But there’s something about a record high that pulls you in and makes you say “Take my money!”
Traders love to bet on success. So when they see that Bitcoin BITSTAMP:BTCUSD is at $117,000 , near a record, it’s easier to throw cash than when it’s crashing and burning at a 60% discount.
True, no trend stays intact after a huge drop. But sometimes it’s better to see confirmation that the trend is exhausted than to exit during a mild dip and risk missing out on the big move.
Trend following isn’t about catching every top or bottom. It’s about accepting that you’ll never time it perfectly, but if you stay disciplined and let the trend play out, you’ll capture at least some of the move.
But in trading everything’s possible – some prefer to catch tops and bottoms, and that’s completely fine as long as it works.
“For twelve years I have been missing the meat in the middle but I have made a lot of money at tops and bottoms,” says Paul Tudor Jones, another big name in the industry.
📈 Tools of the Trade
So how do you know a trend is worth following? Traders lean on a few classics:
• Moving averages : If the 50-day is above the 200-day, that’s your green light. Prices above both? Bullish trend intact. Prices dive below the 200-day? Cue that a bear market is here.
• Support and resistance : Connect the dots (literally) and see if the price is respecting an upward or downward slope.
• Breakouts : When the price pops above resistance or drops below support on big volume, that’s the market saying, “Watch this.”
• Reversals : For those that like to live on the edge, spotting reversals might be a good way to catch a move from start to finish.
The trick isn’t in the tool itself, but in sticking to the plan when the inevitable wiggles and pullbacks happen.
🚤 Don’t Mistake Chop for Trend
Not every chart with bars pointing up is a trend. Sometimes you’re just looking at chop – those sideways, back-and-forth price moves that exist to chew up stop-losses and ruin Fridays.
Trend followers learn to wait for confirmation. That could mean a clean breakout with volume, or a moving average crossover with conviction. Enter too early, and you may find yourself drowning in false signals.
A confirmation is oftentimes triggered by economic news and reports. So pay attention to big and small releases stacked in the Economic Calendar .
🛟 The Stop-Loss Lifeboat
Here’s a little secret of trend following: you’ll be wrong a lot. The method is built around small losses and (occasional) big wins. That’s why stop-losses are essential . You’re not trying to win every trade, you’re trying to catch the few monster trends that more than pay for the slip-ups.
Think of it like surfing: you’ll get wiped out plenty of times, but you only need one clean wave to make the day worthwhile.
📊 The Math Behind the Swings
Why does this work over time? Because of asymmetric returns. If you risk $1 to make $3, you only need to be right 30% of the time to profit. Trend followers build systems where the losers are cut quickly, but the winners are allowed to run. That’s where the proper risk-reward ratio comes in.
Most traders do the opposite. They cut winners too early (“I’ll take my quick profit!”) and let losers drag on (“It’ll bounce, right?”).
🧩 Famous Trend Followers
This isn’t just theory. The Turtle Traders in the 1980s—an experiment by Richard Dennis and William Eckhardt—proved that complete novices could learn a rules-based trend following system and make millions. Fast forward, and big CTAs (Commodity Trading Advisors) still run billions using similar strategies today.
They all share one principle: don’t predict, only follow.
⏳ Patience Pays
The hardest part isn’t identifying trends. It’s sticking with them. Every pullback will tempt you to bail. Every analyst estimate, every scary headline, even your cousin at Thanksgiving telling you “Ether’s going to zero” will test your patience.
But trends don’t end because you got nervous. They end when the move breaks. Patience is what separates the trend followers who catch the big wave from the ones stuck paddling.
🎯 Final Take: Ride It Out
Trend following may not make you look like Paul Tudor Jones calling tops and bottoms. But it will keep you aligned with where the money is flowing. And when you’re on the right side of a trend, the ride is smoother, the wins are bigger, and the stress is lower.
Off to you : When’s the last time you got a nice wave and surfed it out to completion? Share your experience in the comments!
GOLD is BACK with a new potential move... so I m back to it tooCommodities have such a good time time this month. After a period of ranging and no specific direction, I secured over 9R in the last 21 days with a +8.85R on XAGUSD, a loss on XPTUSD, a BE on US2000, a +2.64R on COFFEE and another loss on JP225.

AUDCAD — Holding > 0.91477; Stay bullishChronex | AUDCAD - Bullish - Conviction - Medium | buy pullbacks
Structure: Bullish
Market Phase: Extension
Orderflow: Bullish
Daily: Bullish
H4: Bullish
H1: Bullish
Liquidity: Target IRL then ERL
Entry Model: Chain
Follow for timely Signals and Setups
What would make you stand aside today?
