AUDUSD is Nearing an Important Support!Hey Traders, in today's trading session we are monitoring AUDUSD for a buying opportunity around 0.66600 zone, AUDUSD is trading in an uptrend and currently is in a correction phase in which it is approaching the trend at 0.66600 support and resistance area.
Trade safe, Joe.
Trend Lines

Selena | EURUSD – 4H | Higher-Timeframe Channel Support ReactionFX:EURUSD
After a strong bullish expansion toward the upper range highs, price entered a corrective phase. The current decline has reached a confluence zone consisting of prior support and channel support, where selling momentum has slowed. This suggests potential for a technical bounce as long as structure holds.
Key Scenarios
✅ Bullish Case 🚀
If price holds above the current demand zone and respects the ascending channel:
🎯 Target 1: 1.1720
🎯 Target 2: 1.1800
🎯 Target 3: 1.1880 – 1.1900
❌ Bearish Case 📉
A decisive 4H close below 1.1575 would break the channel structure and open the door toward lower liquidity levels near 1.1510 – 1.1485.
Current Levels to Watch
Resistance 🔴: 1.1720 – 1.1800 – 1.1880
Support 🟢: 1.1640 – 1.1575
⚠️ Disclaimer: This analysis is for educational and informational purposes only. It is not financial advice. Please conduct your own research before trading.

BTCUSDT: Bullish Structure Intact - Targeting 93K ResistanceHello everyone, here is my breakdown of the current BTCUSDT setup.
Market Analysis
BTCUSDT previously traded inside a well-defined consolidation range, where price moved sideways and volatility was compressed, showing balance between buyers and sellers. During this phase, multiple internal swings failed to establish a clear trend direction. Before the range, price experienced several fake breakouts near the upper highs, highlighting strong selling pressure inside the 93,000 Resistance Zone, where buyers repeatedly failed to gain acceptance.
Currently, price is trading above the support zone and consolidating below the key 93,000 Resistance, where selling pressure previously emerged. The structure remains constructive, with higher highs and higher lows still intact, suggesting the move is corrective rather than a full reversal.
My Scenario & Strategy
My primary scenario: as long as BTCUSDT holds above the 90,800 Support Zone and respects the rising trend line, the bullish bias remains valid. I expect price to consolidate and potentially push higher toward the 93,000 Resistance, which acts as the next major upside objective (TP1). A clean breakout and acceptance above the resistance zone would confirm bullish continuation and open the door for further upside expansion.
However, a decisive breakdown below support and the trend line would invalidate the long setup and signal a return to range behavior or deeper correction. For now, buyers remain in control while support holds.
That's the setup I'm tracking. Thank you for your attention, and always manage your risk.

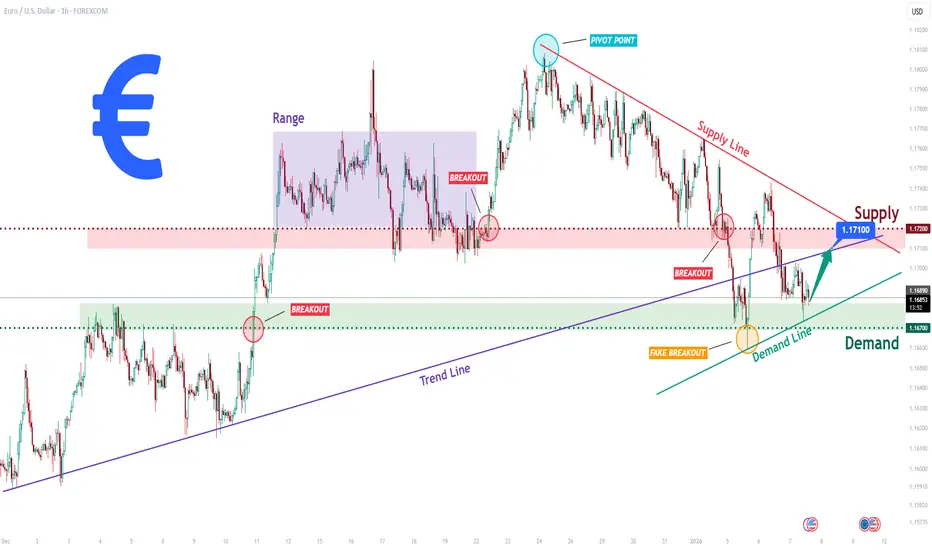
EURUSD Long: Compression Near Key Zones Signals Upcoming MoveHello traders! Here’s a clear technical breakdown of EURUSD (1H) based on the current chart structure. EURUSD previously traded within a well-defined ascending structure, respecting a rising trend line that acted as dynamic support during multiple pullbacks. This bullish phase showed consistent higher lows, confirming buyer control. After the impulsive upside move, price entered a consolidation range, highlighted on the chart, where buyers and sellers temporarily reached equilibrium. From this range, EURUSD executed a bullish breakout, confirming continuation and pushing price toward the upper structure. However, as price approached the Supply Zone around 1.1720–1.1750, bullish momentum started to fade. Multiple reactions, including fake breakouts and rejections near the pivot point, clearly signal strong selling pressure in this area. A descending Supply Line now caps price, reinforcing bearish pressure from above.
Currently, on the downside, price recently swept below short-term support, forming a fake breakout into the Demand Zone around 1.1670, which aligns with an ascending Demand Line. The quick recovery from this area suggests active buyers defending demand and preventing deeper downside for now. Currently, EURUSD is compressing between demand support and descending supply resistance, indicating a tightening structure and an upcoming directional move.
My scenario: as long as EURUSD holds above the 1.1670 Demand Zone and respects the rising demand line, a corrective bounce toward the 1.1710–1.1720 Supply Zone is possible. This area remains a key decision point. A strong rejection there would favor renewed bearish continuation, while a clean breakout and acceptance above supply would invalidate the bearish pressure and open the door for bullish continuation. Manage your risk!
SPX Short: We are at the PEAK! STOP above 7050!Over in this video analysis, I spent almost 20 minutes to talk about the wave structure, the Fibonacci relationships, the fractal relationships between different waves, how to short, and also warns about "What-if-I'm-wrong" scenario.
What I missed to mention in the video is that for now, we still do not have any extensions in our waves 5 (Cycle and Primary). NOT that there MUST be an extension, but it is something to keep it mind for the alternate count of a series of 1s and 2s, leading to a compounded wave 3.
Remember that the most important part of this video, which I mentioned at the end, is the ending diagonal invalidation price: 7049.65. A stop MUST be place above this price. For easier remembering, above 7050.
Good luck!

BITCOIN Structure Improving - 145k by JULY
BTC is starting to look better. We’ve now printed five consecutive weeks without making new lows, which is exactly what you want to see when a market is trying to base.
Price is holding above the last swing low — yes, it could still dip below it — but for now, directional bias is leaning long.
The Level That Matters
For me, everything hinges on $95.5K.
That level:
Coincides with the monthly mode
Provides structural confirmation
Makes positioning far more comfortable once reclaimed
A clean move above it would strongly support the idea that the market is transitioning from consolidation to expansion.
Positioning Thoughts
I was hoping to get some fills below $79K, but it is what it is.
If BTC decides to move up from here and establishes a new 6-month trend, I won’t complain — especially if that trend opens the door toward $150K over time.
For now, patience paid off. Structure is improving, and the market is slowly tipping its hand.

GBPUSD Could Push Higher? | Rate-Cut Risk Pressures the Dollar!Hey Traders,
In today’s trading session, we are closely monitoring GBPUSD for a potential buying opportunity around the 1.33800 zone. GBPUSD remains in a well-established uptrend and is currently undergoing a healthy corrective pullback, approaching a key trendline confluence and the 1.33800 support-turned-resistance area, which may act as a strong demand zone for bullish continuation.
From a fundamental perspective, growing expectations of a potential interest rate cut by the Federal Reserve in the coming months continue to weigh on the US Dollar. A softer USD environment typically supports upside momentum in GBPUSD, reinforcing the bullish technical outlook.
As always, wait for confirmation and manage risk responsibly.
Trade safe,
Joe.

XAUUSD (H3) – Liam Plan Trendline break confirms the uptrend ✅ | Buy the discount, scalp-sell at ATH
Quick overview
On the H3 chart, the story is clean: price has broken the bearish trendline and held structure after a clear BOS, which keeps the bias bullish for continuation.
But the best execution is still the same: no FOMO. I’d rather buy from discount liquidity zones than chase mid-range candles.
Key Levels (from your chart)
✅ Buy Zone 1 (re-buy): 4434 – 4437
✅ Buy Zone 2 (liquidity imbalance): 4340 – 4343 (deep sweep zone)
✅ ATH Sell scalping: 4560 (main profit-taking / reaction sell)
Technical read (Liam style)
Breaking through the trend confirms uptrend: the trendline break signals buyers are back in control.
4434–4437 is the clean re-entry area: a logical pullback zone with better R:R.
If volatility spikes and price hunts liquidity, 4340–4343 is the “best value” area to look for a strong reaction.
Trading scenarios
✅ Scenario A (priority): BUY the pullback at 4434–4437
Entry: 4434 – 4437
SL: below 4426 (or below the most recent H1/H3 swing low)
TP1: 4485 – 4500
TP2: 4560 (ATH – main target)
Logic: Uptrend confirmation is in place — I only want the pullback entry, not a chase.
✅ Scenario B (deep buy): If price sweeps down into 4340–4343
Entry: 4340 – 4343
SL: below 4330
TP: 4434 → 4500 → 4560
Logic: This is the “sweet spot” if the market does a liquidity reset before pushing higher again.
⚠️ Scenario C (scalp only): SELL reaction at ATH 4560
Entry: 4560 (only if we see clear rejection / weakness)
SL: above the sweep high
TP: 4520 → 4500 (quick scalp)
Note: This is a scalp idea at ATH — not a long-term bearish call while the bullish structure is intact.
Key notes
Avoid entries mid-range. Only execute at 4434–4437 or 4340–4343.
Wait for confirmation on M15–H1 (rejection / engulf / MSS).
Risk management: 1–2% per idea, scale out into ATH.
Are you waiting for the 4434 pullback buy, or hoping for a deeper sweep into 4340 for the cleanest entry? 👀

SOL — High-Confidence Long Zone
This is one of the safest areas to look for longs on CRYPTOCAP:SOL , as long as price continues to hold above 121, which marks the monthly value area.
What I’m Looking For
Holding above 121: Keeps the bullish structure intact.
Target: A push toward just below 400 remains on the table.
Stronger continuation: If SOL manages to build a clean mode around 172, the odds of an accelerated move increase significantly.
I seriously doubt we’ll get another opportunity to long SOL anywhere near the 2023 close, which is why current levels are already attractive from a risk–reward perspective.
For now, this is a hold-and-build setup, not a chase.

HYPE — One to Keep on the Radar
HYPE is one I’m actively keeping an eye on.
It should be basing here, as the 8-week downtrend is set to expire this week. On top of that, price has already filled the weekly FVG and is now sitting right at a monthly support/resistance level — a solid area for a potential shift in momentum.
Key Levels
Above $29: Structure remains intact — safe to hold.
Below $22: Opens up a fresh long opportunity, not weakness.
Adding small size,

Bullish in the short term, bearish longer termI think silver is gearing up for something interesting here. We had good support from the rising white line from early Dec which is encouraging me to think we could be gearing up for a run at initially the blue resistance area by the weekend hopefully which we were rejected at a couple of times leading to some good short profits. If we manage to get the RSI up and blast through there then the blow off top big boy - daddy-O comes into play with a confluence of top of channel resistance and top of the cup and handle at 89.30. If we get there (or blow straight through) I'll be closing out my longs 💰 and gearing up for an epic correction. As ever this is all my musings which are mostly wrong (except when they aren't) 💪

#Sei Holding Key Support After Supply RejectionSEIusdt continues its multi month decrease within a large descending channel, price now bounced off the Critical Demand Zone after rejecting from the Important Supply Area. Current price action hovers near $0.122, holding the Accumulation Zone with a potential bounce setup. A strong hold here could spark reversal toward previous supply zone close to $0.3088. Breakout from channel plus reclaim of $0.308 resistance confirms reversal with Targets towards $0.70. But Failure to hold Critical Demand opens path to Base Support for deeper correction.

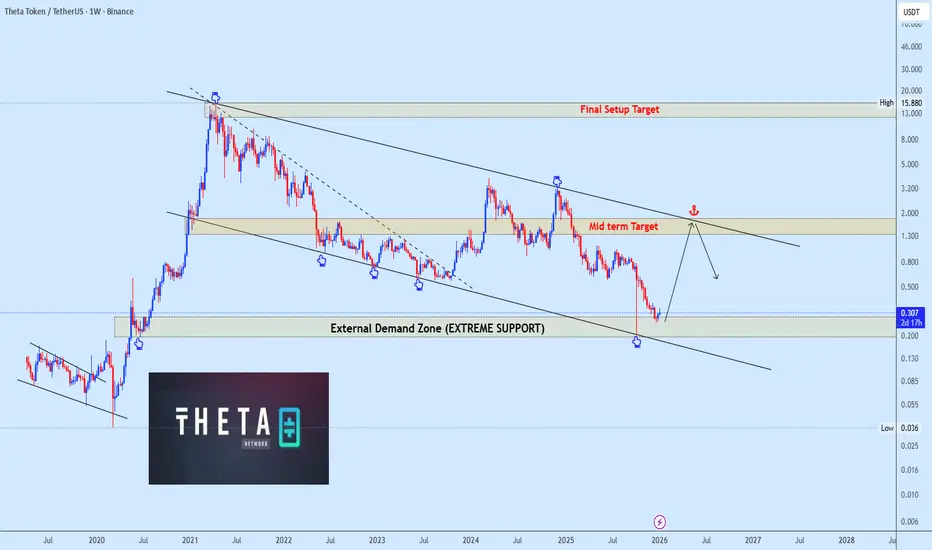
$THETA Holding Strong at Extreme Support – Reversal Incoming?After years in a multi-year descending channel, #THETA is holding strong at the External Demand Zone (Extreme Support) around $0.20–$0.30.
The setup points to a potential reversal:
1. Mid-term target: $1.30
2. Final setup target: $15–$18 (channel top projection)
Bullish breakout above the trendline could confirm massive upside. Watching for accumulation here!
EURUSD Breakout and Potential RetraceHey Traders, in today's trading session we are monitoring EURUSD for a buying opportunity around 1.16600 zone, EURUSD was trading in a downtrend and successfully managed to break it out. Currently is in a correction phase in which it is approaching the retrace area at 1.16600 support and resistance area.
Trade safe, Joe.

GBPJPY - Cound be a Possible Bounce?!...Watch OutThe image provided is a technical analysis chart for the GBPJPY currency pair on a 4-hour timeframe, indicating an "overall bullish" outlook.
Chart Analysis and Outlook 📝
Overall Trend: I expect the price to experience an upward movement over the long term. This often involves a pattern of higher highs and higher lows.
Key Zones: 🔑
Demand Zones: Indicated areas ("DEMAND", "SHORT-TERM", "MEDIUM-TERM", "LONG-TERM") are price levels where buying interest is expected to be strong enough to potentially reverse a downward price move to continue an uptrend.
DEMAND - on h4 timeframe
SHORT-TERM - overall bullish on h4 timeframe 📈
MEDIUM-TERM - overall bullish on h4 timeframe 📈
LONG-TERM - dynamic support and overall bullish from Daily timeframe 🚀
"Look for Longs": The blue shaded area is a specific instruction to traders to look for opportunities to buy the currency pair when the price enters this zone, consistent with a long (buy) position in a bullish market. 📈

Gold Outlook: Key Break at 4475 Ahead of U.S. Jobs DataGOLD | Market OVERVIEW
Gold edges higher as traders await key U.S. economic data later today for clues on the rate path. Focus is on December NFP, expected to show solid hiring with steady unemployment—potentially reducing urgency for near-term Fed cuts. Markets are also watching the Fed leadership transition, after Treasury Secretary Scott Bessent said Donald Trump may name a successor to Jerome Powell later this month.
📉 MARKET BIAS
Short-term bearish below 4475; direction confirmed by intraday closes.
🔼 BEARISH SCENARIO (PRIMARY BELOW RESISTANCE)
• While below 4475, price may pull back toward 4458
• A 15M close below 4458 supports continuation toward:
🎯 4436 🎯 4407
🔼 BULLISH SCENARIO (INVALIDATION)
• A 1H close above 4475 flips momentum bullish
• Upside targets:
🎯 4500 🎯 4520
📌 KEY LEVELS
• Pivot: 4475
• Support: 4458 – 4436 – 4407
• Resistance: 4500 – 4520

WTI M15 Bullish Continuation After H1 FVG Hold📝 Description
WTI crude remains in a strong short-term bullish structure on M15 after an impulsive expansion. Price has pulled back in a controlled manner and is holding above the H1 FVG / BPR zone, suggesting this move is a healthy retracement, not distribution. The higher lows indicate continuation potential rather than exhaustion.
________________________________________
📈 Signal / Analysis
Primary Bias: Bullish
Preferred Setup:
• Entry (Buy): 58.03
• Stop Loss: Below 57.8
• TP1: 58.36
• TP2: 58.60
• TP3: 58.75
Acceptance below the H1 FVG invalidates the bullish continuation idea.
________________________________________
🎯 ICT & SMC Notes
• Clean impulsive leg followed by corrective pullback
• Price respecting H1 FVG + BPR as demand
• No bearish CHOCH on LTF
________________________________________
🧩 Summary
WTI is consolidating above a key HTF demand zone after a strong markup. As long as price holds above the H1 FVG, the market favors continuation toward upside liquidity rather than deeper retracement.
________________________________________
🌍 Fundamental Notes / Sentiment
Oil sentiment remains supported by steady demand expectations and ongoing geopolitical sensitivity. With no immediate bearish catalyst and technical structure aligned, price action favors trend continuation, especially according to geopolitical situation in in Iran and Venezuela.
________________________________________
⚠️ Risk Disclosure
Trading involves substantial risk and may result in capital loss. This analysis is for educational purposes only and does not constitute financial advice. Always apply proper risk management, predefined stop-loss levels, and disciplined position sizing aligned with your trading plan.

USDCHF - Watch-out on a Potential Down Trend..Analysis of the Chart ✍️
Overall Trend: The chart indicates a larger bearish trend, marked by a downward-sloping channel and a "Weekly-Resistance" zone. The price has been forming a series of "impulses" (strong, directional moves) and "corrections" (counter-trend retracements or consolidations) within this channel. 📊
Current Situation: The price is currently in a "correction" phase (a temporary upward move against the main trend) after bouncing from a lower support area. This correction has a local upward trend, labeled "Bulls take over". 📝
Key Insight & Forecast: The current corrective move is approaching a significant resistance level. The label "LOOK FOR SHORTS" is a trading signal, suggesting that traders should prepare to enter a short position (selling the currency pair to profit from a falling price) as the price is expected to be rejected at this resistance and continue the overall bearish trend. 📉
Timeframe: The analysis is based on the 4-hour (4H) timeframe, which is often used to determine momentum and intraday trends. ⏰

BTC M15 HTF FVG Rejection and Liquidity Pullback Setup📝 Description
On the M15 timeframe, BTC is trading within a broader bearish context after a strong impulsive sell. Price has retraced into a clear H1 FVG / supply zone, where sell-side interest is active again. The current bounce looks corrective rather than impulsive, suggesting a potential continuation lower toward nearby liquidity pools.
________________________________________
📈 Signal / Analysis
Primary Bias: Bearish below 90,600
Preferred Setup:
• Entry: 90,650
• Stop Loss: Above 90,800
• TP1: 90,356
• TP2: 90,027
• TP3: 89,425
________________________________________
🎯 ICT & SMC Notes
• Price reacting inside unmitigated H1 FVG
• Current move classified as a bearish pullback, not reversal
• Below-price sell-side liquidity remains intact
________________________________________
🧩 Summary
BTC is showing a classic bearish retracement into premium HTF supply. As long as price remains capped below the H1 FVG, downside continuation toward 90k and sub-90k liquidity levels remains the higher-probability scenario. Rejection from this zone strengthens the bearish case.
________________________________________
🌍 Fundamental Notes / Sentiment
US labor data supports a stronger USD, reinforcing higher-for-longer rates and weighing on risk assets. With dollar strength in play, a bearish move in Bitcoin is favored, and any short-term upside is likely corrective.
________________________________________
⚠️ Risk Disclosure
Trading involves substantial risk and may result in capital loss. This analysis is for educational purposes only and does not constitute financial advice. Always apply proper risk management, predefined stop-loss levels, and disciplined position sizing aligned with your trading plan.

SPX500 Outlook: Volatile Consolidation Ahead of U.S. Jobs DataSPX500 | Market Overview
Global stocks edged higher ahead of the U.S. jobs report, while investors await a potential U.S. Supreme Court ruling on the legality of President Donald Trump’s global tariffs, which previously triggered sharp market volatility.
Ongoing geopolitical tensions have supported oil prices and defense stocks, with developments in Venezuela, Iran, and Greenland remaining in focus. Market participants are cautious as they balance macro data, geopolitical risk, and legal uncertainty around trade policy.
TECHNICAL VIEW (SPX500)
The index maintains a bullish momentum, currently trading within a volatile consolidation range.
📈 Bullish Scenario
Consolidation is expected between 6918 and 6943
While trading above 6918, bullish bias remains active
Upside targets:
6943
6968
6990
📉 Bearish Scenario
A 1H candle close below 6900 would weaken the bullish structure
Downside targets in that case:
6877
6820
Key Levels
Pivot Line: 6918
Resistance: 6943 – 6968 – 6990
Support: 6900 – 6877 – 6820

US100 M15 HTF FVG Rejection and Short-Term Bearish Continuation 📝 Description
US100 on the M15 timeframe is trading below a key HTF BPR / FVG structure, with price failing to reclaim the upper FVG zone. The recent push into the 30m FVG was met with rejection, indicating that the move is more likely a pullback into premium rather than a trend reversal. Market structure remains weak in the short term.
________________________________________
📈 Signal / Analysis
Primary Bias: Bearish
Preferred Setup:
• Entry: 25,55
• Stop Loss: Above 25,575
• TP1: 25,515
• TP2: 25,487
• TP3: 25,468
________________________________________
🎯 ICT & SMC Notes
• Clear HTF FVG rejection
• Price trading below prior equilibrium
• Structure favors lower highs and continuation
• Sell-side liquidity rests below recent range lows
________________________________________
🧩 Summary
As long as price remains capped below the 30m FVG, US100 favors a bearish continuation. The current move looks corrective, with liquidity resting below the range acting as a magnet for price.
________________________________________
🌍 Fundamental Notes / Sentiment
Strong wage growth and elevated inflation expectations reinforce a higher-for-longer rate outlook, which continues to pressure tech stocks. With no clear labor market breakdown, downside risk remains dominant and any short-term rallies are likely corrective rather than trend-changing.
________________________________________
⚠️ Risk Disclosure
Trading involves substantial risk and may result in capital loss. This analysis is for educational purposes only and does not constitute financial advice. Always apply proper risk management, predefined stop-loss levels, and disciplined position sizing aligned with your trading plan.

GBPUSD H1 Sell-Side Liquidity Sweep and Bullish FVG Reclaim📝 Description
GBPUSD has been trending lower and recently swept sell-side liquidity below the H4 lows. After this liquidity grab, price is now stabilizing inside a discount zone, reacting positively around the H1/H30 FVG area.
________________________________________
📈 Signal / Analysis
Primary Bias: Bullish (Pullback)
Preferred Setup:
• Entry: 1.3429
• Stop Loss: Below 1.3410
• TP1: 1.3450
• TP2: 1.3465
• TP3: 1.3503
________________________________________
🎯 ICT & SMC Notes
• Clear SSL sweep of H4 lows
• Price trading in HTF discount
• Multiple H1 / M30 FVGs above acting as magnets
________________________________________
🧩 Summary
This setup favors a sell-side liquidity grab followed by bullish mean reversion. As long as price holds above the recent low and respects the FVG base, upside continuation toward higher liquidity pools remains the higher-probability scenario.
________________________________________
🌍 Fundamental Notes / Sentiment
Despite generally USD-supportive data, the market has largely priced in the higher-for-longer narrative. With no fresh GBP-negative catalyst today, USD strength may stall, opening room for a short-term corrective pullback higher in GBPUSD. As long as upside is treated as counter-trend and tactical, intraday longs can play out before USD demand potentially reasserts itself.
________________________________________
⚠️ Risk Disclosure
Trading involves substantial risk and may result in capital loss. This analysis is for educational purposes only and does not constitute financial advice. Always apply proper risk management, predefined stop-loss levels, and disciplined position sizing aligned with your trading plan.

US30 Outlook: Bullish Momentum Holds Above 48830US30 | Market Overview
The market maintains a bullish momentum while trading above the pivot line.
TECHNICAL VIEW
Bullish bias remains active above 48830
Upside targets: 49250 and 49580
Alternatively:
A 1H candle close below 48830 may trigger a corrective pullback
Downside targets in that case: 48670 and 48450
Acceptance below 48450 would strengthen bearish pressure toward 48100
Key Levels
Pivot Line: 48830
Resistance: 49030 – 49250 – 49580
Support: 48660 – 48450 – 48100
