Will this date come true?This is not fundamentally unbelievable, especially with the manipulation of governments in the crypto market
What is completely clear to us activists is the manipulation of absurd markets with great temptation by the yellow-haired doll and the child politicians and child killers around him.
Although I am not active in this market, I feel sorry for you, despite this cesspool soaked in the blood and hearts of the people of the world!
These numbers may not be realized, but the much blood that has been spilled on the ground will rise and the consequences will drown it.
The freedmen will definitely win.
And I must say, this analysis may expire after a while:
Good luck
MJ.REZAEI
Trend Lines

Bitcoin Bearish Below 87.3K as ETF Outflows IntensifyCrypto Selloff Accelerates Amid ETF Outflows
The cryptocurrency market downturn has intensified as spot Bitcoin ETFs recorded nearly $900 million in outflows, led by the iShares Bitcoin Trust. This wave of selling has added significant pressure across the market.
Bitcoin has fallen about 26% this month, dropping from the 110.3K area and now trading below 87K, reflecting sustained bearish sentiment.
Technical Outlook
Bitcoin continues to look weak in the short term under current conditions.
As long as price remains below the 87.3K pivot, downside pressure is expected to continue toward 76.68K, and a break lower may extend the decline to 72.6K.
In the case of a bullish recovery, Bitcoin would need to close a daily candle above 87.3K to signal a corrective move toward 95.5K and potentially higher.
Pivot Line: 87.3K
Support: 76.68K, 72.6K, 66.4K
Resistance: 95.5K, 100K

Gold continues to fluctuate; is it brewing a major move?Gold prices remained range-bound yesterday, reaching our suggested shorting points and support levels. The highest point reached was around 4110, before falling back to around 4040 in the US session before rebounding. The day closed with a bearish doji candlestick, a signal of a potential breakout. A breakout today would likely lead to further continuation of the downward trend. After a quick rebound to around 4088, prices fell again, with key support around the previous low of 4020. This level represents the last line of defense for the bears; a breach here would open up further downside potential, with the next target around 4000. However, this is only the first small target; a further break below this level could lead to a retest of the previous low of 3900.
The overall trend is currently weak and volatile. During the decline or rise, unexpected patterns may emerge. What we need to do now is patiently wait for the price to reach the resistance level or break out of the narrow range before following suit. Avoid blindly chasing highs and lows, as this could lead to losses during the consolidation phase. If gold rebounds to around 4065-4080, consider shorting, targeting 4050-4030. If it breaks through this level during the European session, look for opportunities to short during the US session rebound.

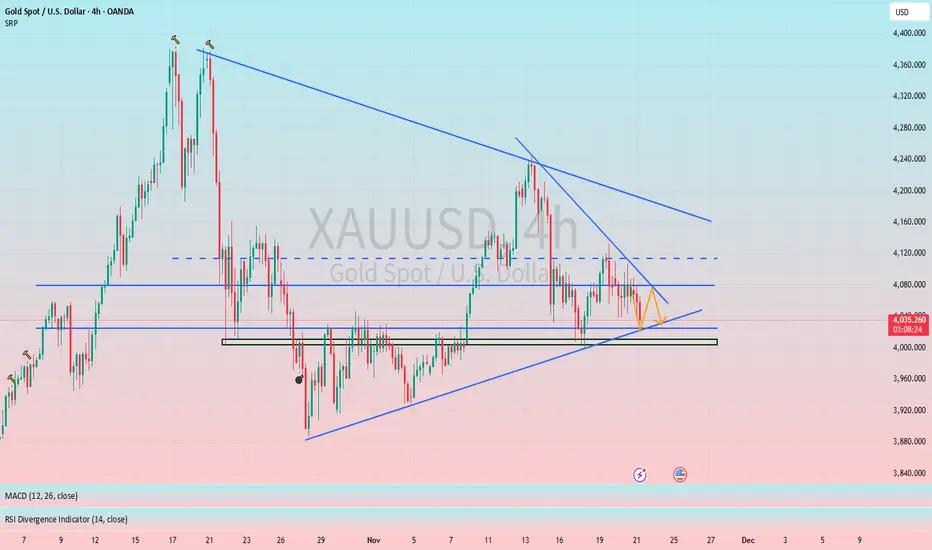
Breakout from a triangle pattern indicates a potential direction#XAUUSD OANDA:XAUUSD TVC:GOLD
From a trend perspective, gold is currently in a triangle consolidation range. As time goes on, the short-term resistance is also moving downwards. Therefore, gold did not provide us with a suitable opportunity to participate in trading last night. Gold is currently continuing its decline and may further test the 4025-4015 support level. If it pulls back to this level, we can consider a small long position in gold.
Gold Weak Below 4084 as Market Awaits PMI DataGOLD – Technical & Fundamental Outlook
FX:XAUUSD attempted a bounce from the 4030 support and is currently trying to approach the 4085 resistance, but overall momentum still appears weak.
From the fundamental side, recent data was mixed — NFP showed growth while the unemployment rate increased, creating higher volatility. Rate-cut expectations also remain muted, with markets pricing around 40% probability for another Fed cut, keeping the Fed cautious about premature easing.
Today, gold traders will monitor the PMI data, which may shape intraday volatility and short-term direction.
Technically Gold maintains a bearish structure in both the short and medium term while trading below 4084.
Below 4084, price is expected to retest 4030,
and a break below this zone can extend the decline toward 4008 – 3982,
as long as the fundamental backdrop remains unchanged.
On the upside, a 1H candle close above 4084 would invalidate the bearish setup
and open the door for a move toward 4104.
Pivot Line: 4051
Resistance: 4084, 4104, 4133
Support: 4030, 4008, 3982

EURGBP Potential UpsidesHey Traders, in today's trading session we are monitoring EURGBP for a buying opportunity around 0.88000 zone, EURGBP is trading in an uptrend and currently is in a correction phase in which it is approaching the trend at 0.88000 support and resistance area.
Trade safe, Joe.

GOLD (XAU/USD): Breakout & Important Selling ZoneThe price of 📈Gold has fallen below a significant horizontal support level.
The previously violated structure and a descending trend line now form a notable supply zone.
I will consider initiating selling positions from this area, anticipating a downward movement towards the 4000-support level.

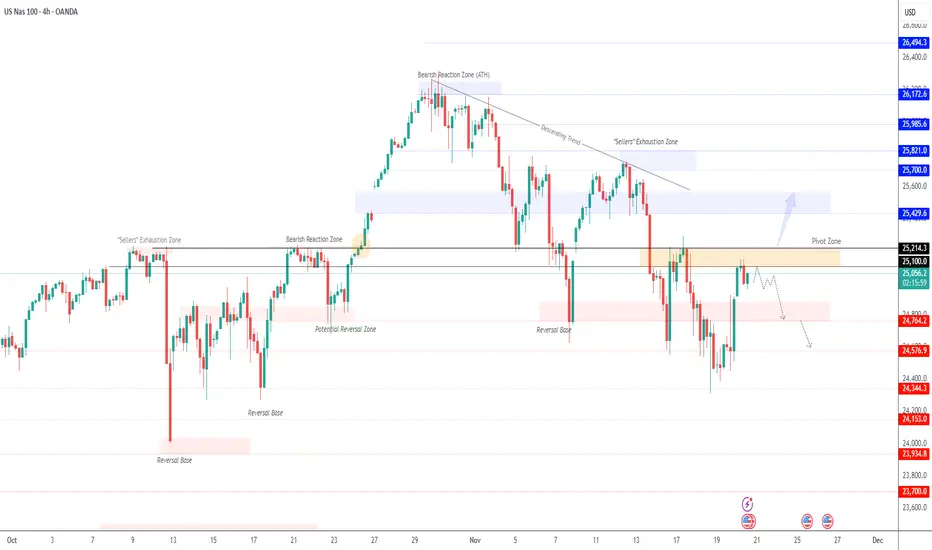
USNAS100 –Key Breakout Levels | Bearish Below 25100 Ahead of NFPUSNAS100 | OVERVIEW
NASDAQ futures surged as Nvidia’s strong earnings eased concerns of an AI-driven market bubble, boosting overall tech sentiment.
Markets are now shifting attention to the NFP and U.S. jobs report, with expectations of elevated volatility throughout the NY session, especially given Nvidia’s strong influence on tech stocks.
Technically:
Below 25100: Bearish continuation toward 24880 → 24760 → 24350
Above 25215: Bullish breakout toward 25430 → 25650 → 25700
Pivot: 25100
Support: 24880 · 24760 · 24350
Resistance: 25220 · 25430 · 25650
USNAS100 stays bearish under 25100; only a confirmed close above 25215 will signal bullish continuation.
Bitcoin - reversal?BTC has moved into "Oversold" territory on the daily RSI - clue no. 1
The RSI is also nearing "oversold" on the Weekly TF - clue no. 2
Price is approaching the previous high of 73.7K - this price level which acted as resistance could well flip into support as it did in April.
Clues I would be looking for to go long (that haven't happened yet):
Bullish div. on the Daily RSI
A touch on the thick white line (projection from Dec 2022)
Price not falling sub-74K
Anticipate an explosive move into December at the start of the month - possibly 4th Dec.
Entry @ 77K
TP @ 240K
SL @ 63K

Can BNB Print Some USDT for Us?Well, time will tell. Let's see how this trade will play out on BINANCE:BNBUSD
Set your limit order now, and when it is triggered, manage your trade.
I would risk 1% of the account balance on this.
Risk management is essential.
See you at full TP or SL.
What do you think about this analysis? Please share your thoughts with me in the comment box.
Don't forget to follow me now and like my idea.
Cheers!

Can Dash Cook Some USDT for US?Full thesis is on the chart, view it to find entry and exit levels on BINANCE:DASHUSDT
What are your thoughts about this analysis? Share them with me in the comment box.
Like and share with your friends.
Manage your risk properly.
Cheers!

US30 – AI Bubble Pressure | Bearish Below 46000US30 | OVERVIEW
US30 declined on Friday as major technology stocks — including Nvidia — remained under pressure following the previous session’s sharp selloff.
Concerns over stretched AI-related valuations continued to weigh on market sentiment, despite Nvidia posting stronger-than-expected Q3 revenue and projecting an upbeat Q4 outlook.
Even with bullish forward guidance, the market is increasingly focused on the risk of an “AI bubble”, which remains the primary driver behind the decline.
US30 – Market Outlook | Bearish Below 46000
US30 declined as tech stocks came under pressure again, with concerns over a possible AI bubble overshadowing Nvidia’s strong earnings and positive guidance.
Below 46000: Bearish continuation toward 45680 → 45285 → 44950
Above 46000–46050: Short-term bullish correction toward 46250 → 46420 → 46600
Pivot: 46000
Support: 45680 · 45285 · 44950
Resistance: 46250 · 46400 · 46600
US30 remains bearish while below 46000, with only limited upside if 46050 breaks.

SPX500 – Key Levels After 3.5% Drop | Bearish Below 6578SPX500 | OVERVIEW
U.S. index futures declined as Nasdaq and S&P500 faced renewed selling pressure, with tech names — including Nvidia — continuing to weaken after Thursday’s sharp drop.
Concerns over stretched valuations remain a key driver of the pullback.
SPX500 – Market Outlook | Bearish Below 6578
SPX500 and Nasdaq futures fell again as tech stocks remain under pressure following Thursday’s selloff. Market sentiment continues to weaken due to concerns over stretched valuations.
Below 6578: Bearish continuation toward 6510 → 6425
Above 6578 (1H close): Short-term correction toward 6610 → 6635
Pivot: 6578
Support: 6510 · 6425
Resistance: 6610 · 6635
SPX500 stays bearish as long as price remains below the pivot. A break above 6578 would only allow a short correction, not a trend reversal.
previous idea:

BTCUSD: Bearish Momentum Aiming for New LowsHello everyone, here is my breakdown of the current Bitcoin setup.
Market Analysis
BTCUSD continues to follow a strong bearish market structure, consistently moving inside a well-defined Downward Channel. The chart clearly shows that after a prolonged consolidation phase inside the large Range, Bitcoin attempted both a fake breakout to the downside and a bullish breakout above the upper boundary — but neither attempt resulted in a sustained trend shift. This indicates that buyers lacked the strength to reverse the broader trend. Once price broke down from the range, BTCUSD established a clean sequence of lower highs and lower lows, forming two consecutive downward channels. Each retest of the channel’s upper boundary resulted in a strong bearish rejection, confirming heavy selling pressure at every corrective move upward.
Currently, the recent breakout below the minor support line inside the second downward channel once again demonstrates that sellers remain fully in control. Price is currently trading just above the major Support Zone around $90,400–$91,000, which has acted as a short-term demand area. However, the repeated bearish impulses and weak buyer reactions suggest decreasing bullish interest at these levels. BTCUSD is now hovering around support but forming a continuation pattern that leans toward further decline. Failure to break above the $96,000 Resistance Zone, aligned with previous structure and the former trendline, reinforces the bearish outlook.
My Scenario & Strategy
I expect that Bitcoin will likely attempt a minor corrective push to retest the broken support or the lower boundary of the channel — but any such move is expected to be short-lived unless strong buying pressure appears. After this corrective phase, BTCUSD may continue its decline toward the lower part of the channel and deeper support areas.
A confirmed breakdown below the current Support Zone ($90,400–$91,000) would strengthen the bearish scenario and open the path toward the next downside targets. Only a strong breakout above $96,000 — with clear bullish confirmation — would weaken the bearish bias and signal that buyers are stepping back into the market. For now, short positions remain more favorable, especially after corrective pullbacks into resistance zones within the downward channel structure.
That's the setup I'm tracking. Thank you for your attention, and always manage your risk.

Bitcoin Dominance – Monthly Insights📉 The 2022 cycle correction remains in progress, with potential downside toward the 54%–52% zone.
📈 Once this pullback completes, CRYPTOCAP:BTC.D is projected to rise again, targeting 77% dominance by 2028–2029.
💡 The big question: Which #Altcoins will survive and thrive in a Bitcoin‑dominated market?

BITCOIN SHORT BITCOIN rejected on the Resistance level on a htf touching it 3 Times showing a rejection level.
Price broke my Trendline support and retested it on the H4 Timeframe giving us clear directions that BITCOIN is reaching $76k as anticipated! Bear market!
This is a 7+rr

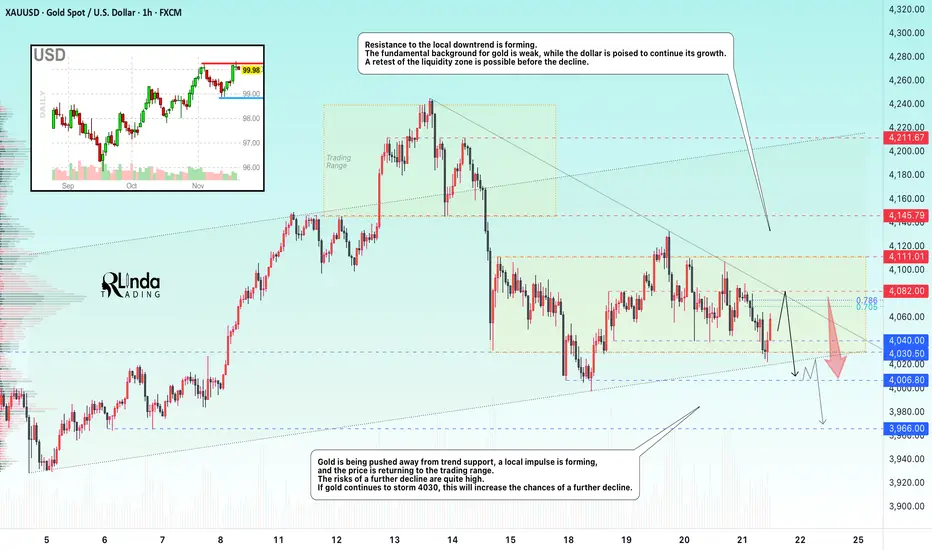
GOLD → Mixed data forms a symmetrical triangle FX:XAUUSD is bouncing off support at 4030, with bulls trying to maintain the current trend. The fundamental backdrop is currently weak for gold, which is why there are bears in the market. The PMI report is coming up...
Mixed US employment data (NFP growth to 119K, but unemployment rose to 4.4%) has created uncertainty. The probability of a Fed rate cut in December remains at 40%. Fed officials remain cautious, warning of the risks of premature easing.
Focus on the 4070-4082 area and local trend resistance...
Gold is awaiting new signals from PMI data. A breakout of the range is likely if there are significant deviations from forecasts (Manufacturing PMI: 52, Services PMI: 54.8)
Technically, a symmetrical triangle is forming on the chart, which could keep the market within its boundaries if the fundamental background remains unchanged. However, a breakout of either boundary could trigger a distribution in the direction of the break
Resistance levels: 4080, 4110
Support levels: 4040, 4030, 4006
In the medium term, gold currently looks weak. The reaction to support is weakening, a cascade of levels and a downward resistance line are forming. The market may test the 4080 area, but if the PMI is weak, gold will return to attack the trend support. However, a break above 4082 and a close above this zone could give us a chance for growth.
Best regards, R. Linda!
GBPNZD: Consolidation is Over 🇬🇧🇳🇿
Looks like GBPNZD finally completed a consolidation.
The price violated a resistance line of a symmetrical triangle
pattern with a high momentum bullish candle on a daily.
We can expect a move up now.
Goal - 2.3475
❤️Please, support my work with like, thank you!❤️
I am part of Trade Nation's Influencer program and receive a monthly fee for using their TradingView charts in my analysis.

XAUUSD | Gold Signal | Now 21, 2025 SELL TREND TARGET FOR TODAY 📊
Based on the current trend, structure is strong to bearish. But right now, there’s still a chance for price to make a retracement first.
HAYATE is monitor the structure to see which one is safe whether we BUY first or continue SELL trend.
HAYATE target for this setup we should be able to collect around 100–150 pips++.
♾️Gold sell now @ 4046 - 4050
💰TP1 - 4043
💰TP2 - 4039
🚨SL - 4053

Gold at a Critical Level: Will the Channel Hold or BreakXAUUSD Analysis – Key Rejection at Lower Channel Support
Gold has just shown another rebound from the lower boundary of the ascending channel, a level it has respected consistently since October 28. However, yesterday’s strong NFP data increased expectations that the Federal Reserve will not cut rates in December, which strengthens the U.S. dollar and creates potential downside pressure on gold.
If bearish momentum builds, gold could move toward the 4000 zone, completing the current fractal. This would be a dangerous level, as breaking below 4000 would mean losing the bullish channel and could send price back toward the 3950 support area.
Since today is Friday and liquidity tends to be lower, we may also see sideways movement between 4100 and 4020, as the market waits for next week’s catalysts.

Focus on opportunities to buy on dips.My thoughts on today's gold price movement!
From a technical perspective, gold is currently still consolidating at high levels, with the consolidation narrowing. Gold will face a choice in the near future. Looking at the price action, yesterday's US session saw gold prices rebound to a high below 4110 before encountering resistance and trending lower again. This area remains a significant resistance zone, and it's a key resistance level for short sellers to watch. Since the price hasn't broken through this level yet, we should continue to analyze the consolidation, buying low and selling high. The main resistance level is around 4100-4110. Therefore, if gold prices directly retest the 4100-4110 area and a clear bearish pattern forms, short positions can be initiated. However, if the price breaks strongly above this area, it's best to avoid short positions. Conversely, if the price first falls to test the 4040-4120 support level, long positions can be considered.

Is BTC going down?In the weekly charts, BTC breaks the bullish trend, complementing the Bearish divergence in RSI 14. First best buy would be at 80k. But if it breaks the HL at around 74k, then the second-best buy would be at around 65,366 (with Fair Value Gaps).

Looking to long CRWV at $60Previously I was bearish on coreweave, and wow did that cause some strife in the comments, but I've closed my short yesterday and now looking to long $60.
Good luck!
