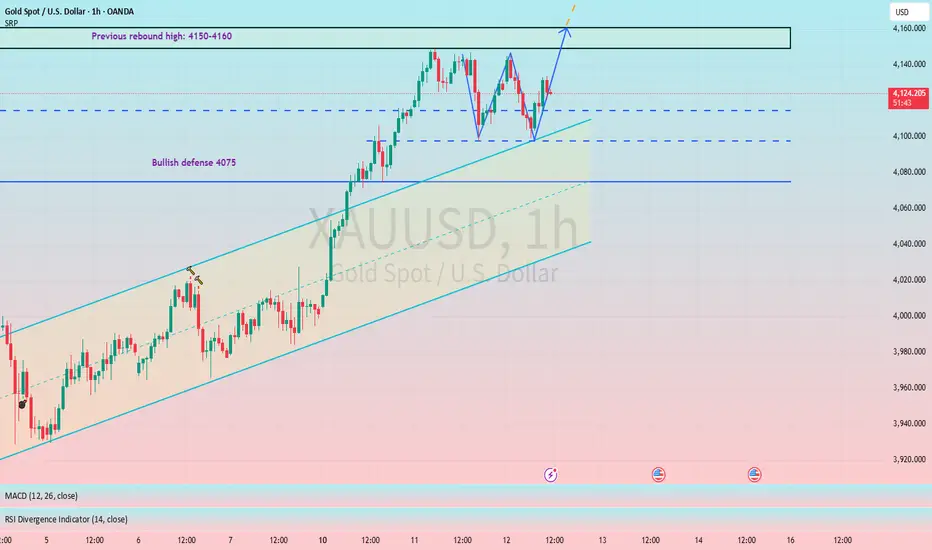
A W-shaped pattern is emerging, indicating a bullish outlook.#XAUUSD TVC:GOLD OANDA:XAUUSD
Gold prices trended downwards during the Asian session, leading many to believe the market has begun to reverse. However, I disagree. As I clearly stated yesterday, as long as the key support level of 4075 is not broken, we will maintain our bullish outlook, and we will continue to follow this strategy today.
From the hourly chart, gold prices are showing signs of forming a W pattern. If the neckline is broken, gold prices will continue to rise, testing the 4150-4160 range. A strong breakout could see prices reach 4180, or even 4200.
Trend Lines
FLOKI : BUY MARKETHello friends
According to the technical analysis carried out, we can say that with the entry of buyers, it is possible to enter into a transaction with risk and capital management and move towards the specified goals.
*Trade safely with us*

BTCUSDT.P : positionHello friends
Given the decline we had, the price has now made a good floor and is supported, but it is still early for confirmation. We must let the resistance break and form a higher ceiling for us.
Everything is clear and transparent. If you have any questions, ask.
Don't forget risk and capital management.
*Trade safely with us*

A massive shockwave crashes against the golden roller coaster.Gold Price Analysis: Yesterday, gold rose but encountered resistance around 4150, then fell back to around 4100 before rebounding and entering a period of consolidation. As of this morning's trading, it failed to break new highs. The first wave of the upward trend since the short-term bottom at 3886 has stalled. 4160 is the starting point of the second wave of the decline after the previous drop from 4380. Short-term pressure and pullback correction are normal. The overall upward trend remains unchanged. The rise from 3886 to around 4150 represents an increase of approximately $265, and the pullback correction is entirely a normal technical adjustment. However, after encountering resistance around 4150, the upward movement will be delayed. After Monday's surge, many people thought that a rally of over $100 in a single day was coming again. But now, the market is generally in a large range of high-level fluctuations, and it's impossible for it to rise by $100 every day. However, the overall daily uptrend remains unchanged. After a short-term correction, a second wave of upward movement will begin. But there is one thing to be aware of: this wave is a rebound correction after the drop from 4380. If it takes too long to break through and fails to rise further, we should be wary of a weakening momentum and subsequent decline. So, if the market fails to break through the resistance of 4150-4160 after this period of consolidation, the bulls should be cautious.
Gold Technical Analysis: After the morning's pullback, the MACD lines turned downwards again, continuing the death cross signal. Gold prices also showed a structure of lower highs, currently under pressure at the $4145 level. However, since the fast and slow lines are still running above the zero axis, if gold prices cannot fall further and cause the fast and slow lines to cross the zero axis, the bulls may launch another counterattack. The failure to break yesterday's high in the morning indicates that the bullish trend has slowed down. However, the failure to break yesterday's low of $4097 during the Asian session suggests that the bears are not strong either. The battle between bulls and bears is intense, and gold prices have entered a new adjustment period. Therefore, today's strategy remains to sell high and buy low. In the second half of the week, gold will continue to focus on testing the support level below. Currently, the moving averages show signs of crossing upwards, increasing the possibility of gold extending its rebound. However, the short-term upward movement was too sudden and the magnitude of the movement was too large, which brings great difficulty and risk to the operation. Therefore, even if the short-term outlook turns bullish, in actual operation, it is still necessary to wait for a pullback before considering going long. Do not blindly follow the bullish trend without considering the price level. In summary, today's gold trading strategy is to mainly buy on dips and sell on rallies as a secondary approach. The key resistance level to watch in the short term is 4145-4160, and the key support level to watch in the short term is 4110-4095. Friends, please keep up with the rhythm.

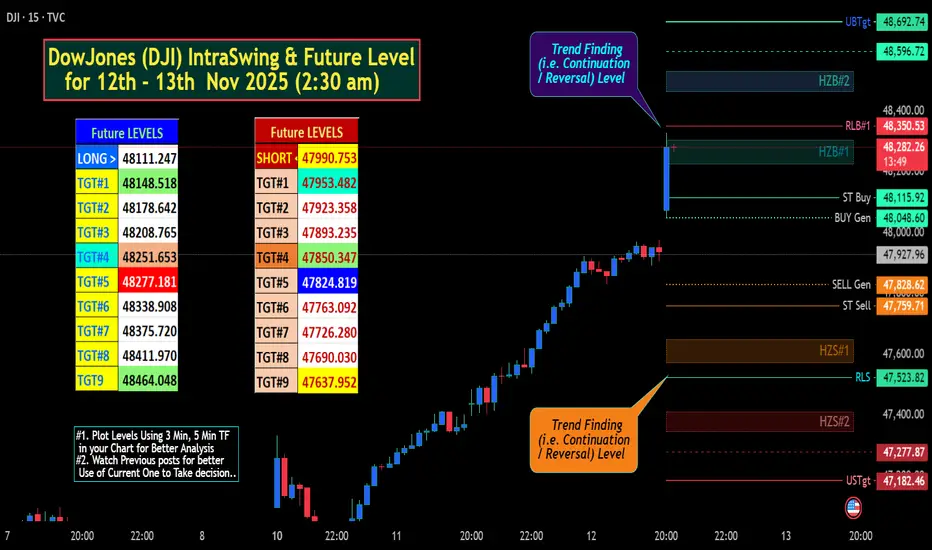
DowJones (DJI) IntraSwing & Fut Level for 12th - 13th Nov 2025 DowJones (DJI) IntraSwing & Fut Level for 12th - 13th Nov 2025 (2:30 am)
b]✍🏼️ "Future IntraSwing Levels" mentioned in BOX format.
Useful to Tally / Recognize for Next day Trade Plan.
Level description:
L#1: If the candle crossed & stays above the “Buy Gen”, it is treated / considered as Bullish bias.
L#2: Possibility / Probability of REVERSAL near RLB#1 & UBTgt
L#3: If the candle stays above “Sell Gen” but below “Buy Gen”, it is treated / considered as Sidewise. Aggressive Traders can take Long position near “Sell Gen” either retesting or crossed from Below & vice-versa i.e. can take Short position near “Buy Gen” either retesting or crossed downward from Above.
L#4: If the candle crossed & stays below the “Sell Gen”, it is treated / considered a Bearish bias.
L#5: Possibility / Probability of REVERSAL near RLS#1 & USTgt
HZB (Buy side) & HZS (Sell side) => Hurdle Zone,
*** Specialty of “HZB#1, HZB#2 HZS#1 & HZS#2” is Sidewise (behaviour in Nature)
Rest Plotted and Mentioned on Chart
Color code Used:
Green =. Positive bias.
Red =. Negative bias.
RED in Between Green means Trend Finder / Momentum Change
/ CYCLE Change and Vice Versa.
Notice One thing: HOW LEVELS are Working.
Use any Momentum Indicator / Oscillator or as you "USED to" to Take entry.
⚠️ DISCLAIMER:
The information, views, and ideas shared here are purely for educational and informational purposes only. They are not intended as investment advice or a recommendation to buy, sell, or hold any financial instruments. I am not a SEBI-registered financial adviser.
Trading and investing in the stock market involves risk, and you should do your own research and analysis. You are solely responsible for any decisions made based on this research.
"As HARD EARNED MONEY IS YOUR's, So DECISION SHOULD HAVE TO BE YOUR's".
Do comment if Helpful .
In depth Analysis will be added later (If time Permits)
WESTLIFE Chart Study (Educational Only)These levels are only examples to explain chart structure,
not trade recommendations. Viewers should do their own-analysis
or consult a SEBI-registered advisor before trading.

Based on SMC Concepts The Next Target is expected to be DownwarThe Market is expected to be Moving downwards if there is a Bearish Price Action There is a Support
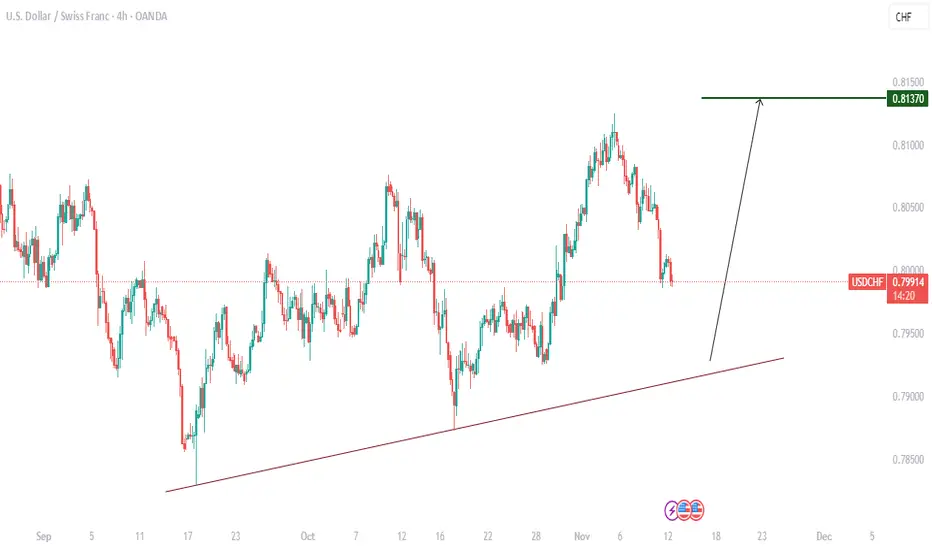
USDCHF: Price Gradually Heading Down To The Next Support.Hello everyone,
USDCHF have been moving downward for this past few days, trending on a momentum channel of support and resistance. the pair aims towards 0.7930 as the next trendline support, in respect of the structure.
Possible outline;
Hold on the sell position with target at 0.7930, meanwhile a confirmed reversal above the support would trigger upward rise, eyeing 0.8137 as the next partial resistance.
Lets see how it plays out...
Thanks for reading.
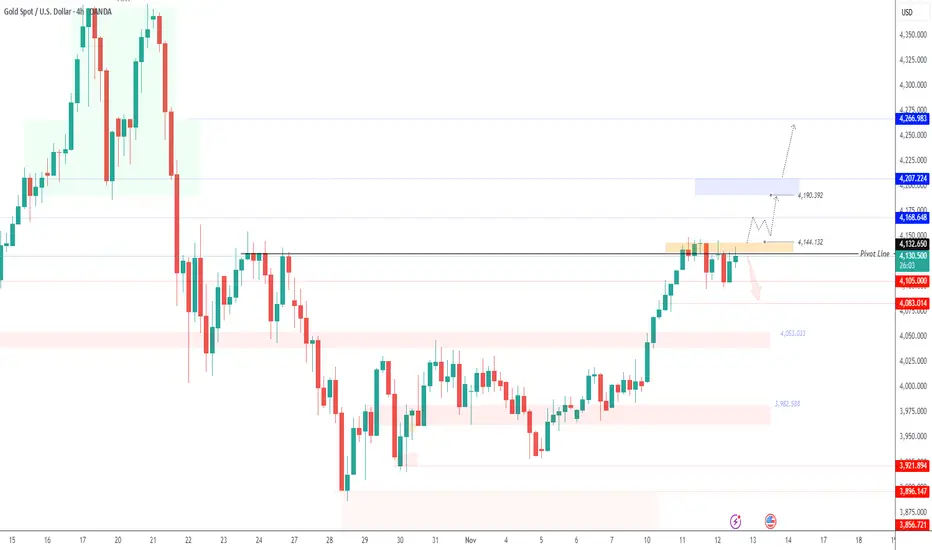
Shutdown Deal in Focus | Gold Prices Pause Before Key VoteGOLD | Overview
Gold steady ahead of U.S. House vote on government reopening.
Gold prices remained steady on Wednesday as investors awaited a U.S. House of Representatives vote on a deal to reopen the federal government, an outcome that could restore economic data visibility and shape expectations for future Federal Reserve rate cuts.
Technically:
Gold maintains a bearish bias while trading below the 4132–4144 pivot zone, with downside potential toward 4104, and a break below this level could extend losses to 4083 and 4053.
However, a 1H close above 4145 would shift sentiment to bullish, targeting 4168 and 4190, with further extension possible toward 4207.
Pivot Zone: 4132 – 4144
Resistance: 4168 · 4190 · 4207
Support: 4104 · 4083 · 4053
Dow Jones Rises on Shutdown Optimism | Bulls Eye 48500 ZoneUS30 | Overview
The price pushed up sharply ahead of the expected end of the U.S. government shutdown, reflecting renewed optimism across equity markets.
This momentum suggests a continuation of the bullish trend, with buyers maintaining control as long as the price trades above 48020.
As long as price action holds above this pivot level, the index is likely to advance toward 48210, and a break above that zone could extend gains toward 48500.
However, if the price drops below 47850, a bearish correction may develop, targeting 47450.
Pivot Line: 48020
Resistance: 48210 · 48500
Support: 47850 · 47710 · 47460

AUDCAD | Bullish SetupPrice looking hot here with multiple patterns in one.
Looking for a long term swing with some day trades in between.
Overall target 🎯0.93555

GBPUSD: Very Bearish Outlook 🇬🇧🇺🇸
Intraday price action on GBPUSD looks very bearish after a recent
test of a significant daily resistance that we discussed earlier.
The occurrence of a bearish imbalance indicates a highly probable
down movement.
I anticipate a fall at least to 1.3064
❤️Please, support my work with like, thank you!❤️
I am part of Trade Nation's Influencer program and receive a monthly fee for using their TradingView charts in my analysis.

Samvardhana Motherson International Ltd – Trendline BreakoutSamvardhana Motherson International Ltd – Trendline Breakout on Radar
NSE:MOTHERSON
📈 Pattern & Setup:
Samvardhana Motherson is showing signs of strength after a long consolidation phase. The stock has been forming a **descending trendline** since its 2024 peak and is now gradually tightening just below it.
This structure reflects **accumulation under resistance**, where price volatility is contracting, and demand is slowly absorbing available supply. The recent green candles on rising volume further indicate institutional interest building up quietly.
A decisive close above **107–108** would confirm a **weekly trendline breakout**, potentially opening the door for a move toward 140–145.
📝 Trade Plan:
✍Entry: Above 108 (weekly close confirmation)
🚩Stop-Loss: 98 (below recent higher low)
🎯Targets:
Target 1 → 125
Target 2 → 144 (approx. 35% potential move)
💡 Pyramiding Strategy:
1. Initiate 60% position above 108 with breakout confirmation
2. Add remaining 40% above 115 once volume expansion confirms momentum
3. Trail stop-loss to 103 after stock sustains above 120
🧠 Logic Behind the Setup:
This setup represents a **base breakout from a long-term downtrend**, where sellers are exhausted, and buyers are taking control. The contracting structure with a breakout attempt on the weekly timeframe makes it a strong candidate for a medium-term uptrend move.
Keep Learning. Keep Earning.
Let’s grow together 📚🎯
🔴Disclaimer:
This analysis is for educational purposes only. Not a buy/sell recommendation. Please do your own research or consult your financial advisor before trading.

US30 Approaches 47,200 Support as Seasonality Favors Bulls!Hey Traders,
In today’s session, we’re monitoring US30 for a buying opportunity around the 47,200 zone. The Dow Jones remains in a broader uptrend and is currently in a correction phase, approaching a key support and resistance area at 47,200.
We’d also like to highlight the strong seasonal tendency for equities during this period — historically, November has often provided a tailwind for the Dow as market sentiment improves ahead of year-end.
Watching closely for a potential bullish trigger at support.
Trade safe,
Joe.

Oil - Expecting Bullish Continuation In The Short TermH1 - Downtrend line breakout.
Higher highs.
No opposite signs.
Until the two strong support zones hold I expect the price to move higher further.
If you enjoy this idea, don’t forget to LIKE 👍, FOLLOW ✅, SHARE 🙌, and COMMENT ✍! Drop your thoughts and charts below to keep the discussion going. Your support helps keep this content free and reach more people! 🚀
--------------------------------------------------------------------------------------------------------------------

Nasdaq Holds Firm After Support Rebound| Focus on 25820 BreakoutUSNAS100 | Overview
The price retested our support at 25430 and bounced perfectly, just as outlined in the previous analysis.
After reaching the resistance zone, the index is now consolidating between 25700 and 25820, awaiting a decisive breakout.
A 1H close above 25820 would confirm bullish continuation, targeting 25960 and 26170.
However, a 4H close below 25700 would indicate the start of a bearish correction, with downside potential toward 25570 and 25430.
Pivot Line: 25700
Resistance: 25820 · 25960 · 26170
Support: 25570 · 25430 · 25230
Outlook:
USNAS100 remains bullish while above 25700, with upside targets at 25960–26170.
A confirmed 4H close below 25700 would shift the short-term tone to a bearish correction toward 25570–25430.

Congress Set to End Shutdown | SPX500 Holds Strong Above 6877SPX500 | Overview
U.S. Congress Poised to Get Back to Work
The U.S. government is on the verge of reopening, potentially restoring pay to federal workers and reviving key economic data releases that have been halted for weeks — leaving the Federal Reserve operating with limited visibility.
Renewed optimism over a resolution in Washington has boosted investor sentiment, supporting further upside in U.S. equities.
Technically:
The SPX500 has pushed higher and is now stabilized above the pivot level at 6877, indicating continuation of the bullish trend toward 6918 and 6941, with potential to reach new all-time highs (ATH) if momentum persists.
However, if the price closes a 1H candle below 6866, it would signal short-term weakness, leading to a bearish correction toward 6844 and 6814.
Pivot Line: 6877
Resistance: 6918 · 6941 · 6991
Support: 6845 · 6814 · 6797

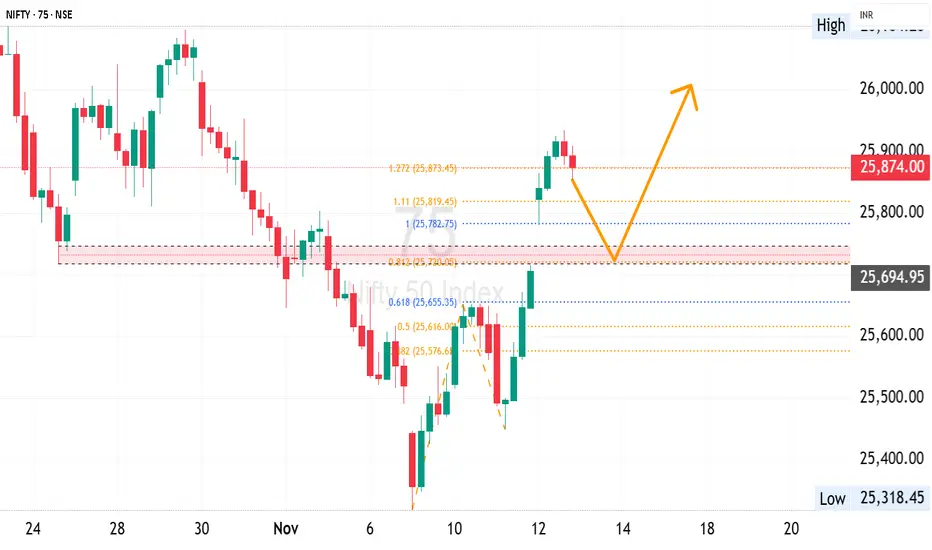
Nifty Gap up 100 Pts and sustained Can we expect Bullish ?Welcome to The Chart Talk by M Dhanushkumar
Nifty Gap up and sustained made small correction and slow bullish momentum so Can expect Bullish on Tomorrow ?

XAU Mid Buying ModelHello everyone, Welcome to the XAU-SYNDICATE...
This is my entry model for buying. so I'll wait for my zone, as soon as the price reaches my zone I'll look for a INT.IDM hunt or M15 single bullish candle close above 3916 second confirmation and plan my trade accordingly.
#XAU-SYNDICATE

US CRUDE OIL (WTI): Classic Trend-Following Setup I spotted a very classic bullish model on 📈USOIL.
Following a strong bullish wave, the market started to correct within a bullish flag pattern.
The resistance breakout of this pattern consistently provides a reliable confirmation to consider a buy.
I anticipate a rise to 62.50 at this time.

EURUSD Retests Buyer Zone — Bullish Momentum Aiming for 1.1600Hello traders! I’d like to share my view on EURUSD. After an extended bearish trend inside a descending channel, the pair finally found strong buying interest around the 1.15300–1.15400 Buyer Zone, where price reacted multiple times in the past. This area aligns with both the horizontal Support Level and the ascending Support Line, which together form a solid base for potential bullish continuation. Recently, EURUSD broke above the descending resistance line, confirming a possible short-term trend reversal. The price is now retesting the breakout area, showing signs of accumulation above support. As long as price remains above 1.15300, the bullish structure stays valid. The immediate upside target (TP1) is seen around the 1.16000–1.16100 zone, which coincides with the previous consolidation and minor resistance area. A breakout and confirmed close above this zone could open the way toward the 1.16600 Resistance Level. However, a clear bearish rejection pattern near 1.16000–1.16100 might lead to another corrective pullback back into the Buyer Zone before further continuation. Please share this idea with your friends and click Boost 🚀

EURNZD: Major Demand Zone Ahead 🇪🇺🇳🇿
EURNZD has recently set a new higher high higher close on a daily
breaking a significant horizontal resistance cluster.
We see a retracement now.
The price is entering an important demand zone that is based
on a strong rising trend line and a broken structure.
With a high probability, the price will grow from that
and reach 2.07 level.
❤️Please, support my work with like, thank you!❤️
I am part of Trade Nation's Influencer program and receive a monthly fee for using their TradingView charts in my analysis.

GOLD → The bullish trend continues its movement FX:XAUUSD is testing the $4,150 level, hitting a three-month high amid expectations of a resumption of US government operations and weak economic data. The weekly gain exceeded 3%.
Expectations of Fed easing - 64% probability of a rate cut in December, Consumer Sentiment Index (50.3) - lowest in 3.5 years.
Layoffs rose 183.1% in October.
The end of the shutdown will allow the release of missed data (NFP, CPI), which may confirm the need for a rate cut. All of this provides support for the metal.
Today, it is worth paying attention to ADP employment data (4-week average) — an assessment of the labor market.
Fundamentally, gold remains bullish thanks to a combination of monetary expectations and macro risks.
Resistance levels: 4150, 4160
Support levels: 4125, 4085
The trend is bullish and quite aggressive, with the market not allowing for deep pullbacks. Ahead lies resistance at 4150-4160, a fairly dense pool of liquidity that is likely to halt the current movement and trigger a small correction before continuing to rise to 4200-4250.
Best regards, R. Linda!
