Gold is Ready For Bull From Triangle PatternHello Traders
In This Chart GOLD HOURLY Forex Forecast By FOREX PLANET
today Gold analysis 👆
🟢This Chart includes_ (GOLD market update)
🟢What is The Next Opportunity on GOLD Market
🟢how to Enter to the Valid Entry With Assurance Profit
This CHART is For Trader's that Want to Improve Their Technical Analysis Skills and Their Trading By Understanding How To Analyze The Market Using Multiple Timeframes and Understanding The Bigger Picture on the Charts
Trend Lines
Bitcoin 100K$ support zone hold strong But not bullish YETAs observed on the chart, the $100,000 support zone is demonstrating significant strength by holding the price. However, the primary focus is now on the major resistance cluster near $108,000. This level is a critical technical juncture for three key reasons:
1. Role Reversal: This level represents a previous significant support zone that, once broken, has now transformed into a formidable resistance barrier according to the principle of role reversal.
2. Dynamic Trendline Resistance: The price is currently contending with a descending trendline resistance, which has historically capped bullish advances.
3. Retest of a Broken Structure : The prior bullish (green) trendline, which was decisively broken to the downside, may now act as a resistance level upon a retest from below.
Conclusion: The market structure will only turn decisively bullish upon a confirmed and sustained breakout above this critical $108,000 resistance confluence. Such a breakout would signal a shift in market dynamics, invalidating the current bearish pressure and opening the path for a significant upward move toward higher targets.
DISCLAIMER: ((trade based on your own decision))
<<press like👍 if you enjoy💚

ETHUSDT the supports are holding strong to pump it upAs observed on the ETHUSDT chart, the previously identified support zone near $3,100 has demonstrated expected resilience, validating our technical assessment. The price is now undergoing a corrective phase as it tests a significant trendline resistance around $3,700. We anticipate a potential breakout above this resistance level, which would signal renewed bullish momentum and establish a projected trajectory toward initial targets at $4,000, followed by a secondary objective at $5,000.
DISCLAIMER: ((trade based on your own decision))
<<press like👍 if you enjoy💚

NZDJPY the buy signal is still open now tp can hitAs observed, the price retraced from our entry zone near 86.30, testing our stop-loss level around 85.80. However, this area aligns with a historically significant support cluster for NZDJPY, as previously outlined in our analysis. We anticipate that the defense of this support level could catalyze a robust bullish reversal, providing the necessary momentum to drive the price toward our initial profit target.
DISCLAIMER: ((trade based on your own decision))
<<press like👍 if you enjoy💚

Continue to buy gold after the correction!Gold opened on Monday and immediately began its upward trend, relying on the short-term moving average. It broke through two key resistance levels in succession, soaring once again. The daily chart showed a large bullish candle, breaking through the 4100 psychological level again, forming a strong upward spike and raising expectations for further gains. The weekly chart also broke through the short-term moving average again. Judging from the current pattern, the strength formed after the continuous upward movement is likely to continue strongly. Although there was a slight pullback during the US session, it ultimately continued its rapid upward climb. For now, we remain bullish on the gold market. The key resistance level remains around 4150, which will be the first target in the near term. The support level remains around 4110-4100, which is also one of the first pullback correction points for the bulls in the short term. If gold pulls back to around 4115-4100 during the day, we suggest going long on gold, with a target of around 4130-4150.

The bull market has returned. Am I bullish at this price level?#XAUUSD TVC:GOLD OANDA:XAUUSD
Gold prices performed strongly yesterday, closing with a large bullish candle on the daily chart and stabilizing above the daily MA5, officially signaling the return of bulls to the market.
Gold strengthened further today, and from a technical perspective, the bullish trend remains intact. Therefore, continuing to go long on gold is clearly safer. The bullish signal given last night regarding a pullback to the 4075 support level remains valid. However, with the passage of time and the continued strength of gold, a direct pullback to this level in the short term is somewhat difficult. But as a point of multiple pullbacks on smaller timeframes and near the daily MA20, the 4075 support remains reliable. Therefore, we can consider it a defensive level for the short-term bulls. As long as gold prices remain above this level, the bullish momentum will not change.
Currently, looking at the hourly chart, the 4125-4110 range is the support zone for the short term. If the price retraces to this level during the European session, it would be a good entry point, and we can continue to go long on gold within this range.

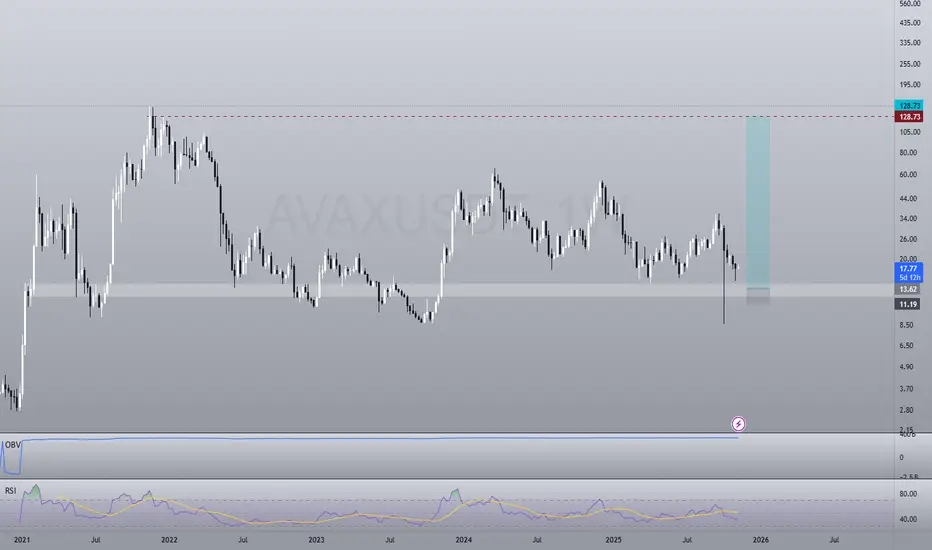
Hello $Avax, glad your in buying zone againYeah, it's coming. The weekly zone to add or buy. Big wicks below, stopping all prev longs. But retest of the area sounds solid.
Swing long, no leverage (too wide stop). DCA between 16 & 13 , depending on your preferences.
Gold Steadies Near 2-Week Highs | Traders Watch 4168 Breakout GOLD | Overview
Gold’s outlook remains positive in the near term, as the precious metal extended its rally this week amid optimism over an imminent end to the U.S. government shutdown and expectations of continued monetary easing from the Federal Reserve.
Technically:
Gold has stabilized above 4130, indicating solid bullish momentum, with potential to reach 4155 and 4168.
A sustained move above 4168 would further strengthen the uptrend, targeting 4190 – 4207.
However, if the price closes a 1H candle below 4130, it would suggest a shift to bearish momentum, exposing downside targets at 4105 and 4085.
Pivot Line: 4130
Resistance: 4155 · 4168 · 4207
Support: 4105 · 4085 · 4055
Outlook:
Gold remains bullish while above 4130, with momentum favoring a move toward 4155–4168 and potential extension to 4207.
A confirmed 1H close below 4130 would signal the start of a bearish correction toward 4105–4085

XAUUSD: Buyers Defend $4,040 — Targeting $4,140 ResistanceHello everyone, here is my breakdown of the current Gold setup.
Market Analysis
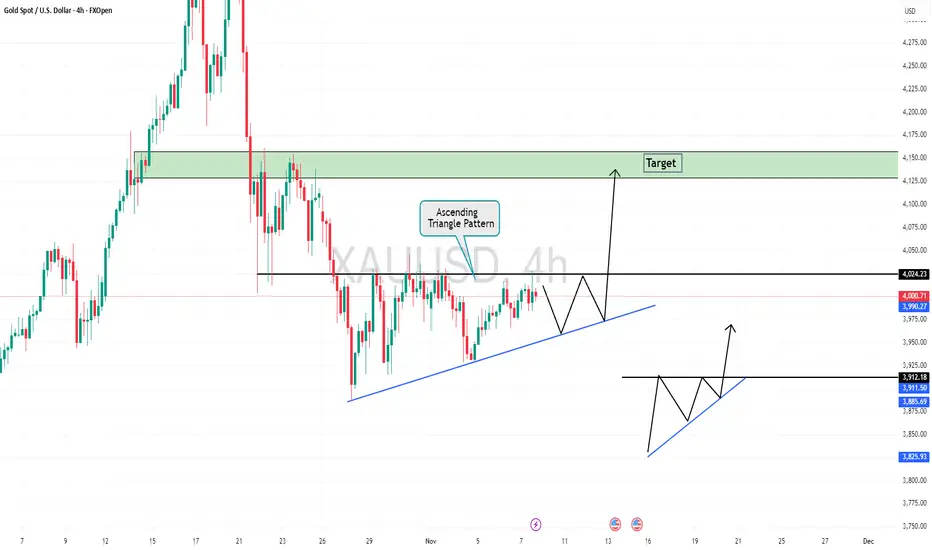
XAUUSD has recently confirmed a bullish structure after bouncing strongly from the $4,000–$4,040 Support Zone, an area that coincides with the ascending Trend Line visible on the chart.
This level has repeatedly acted as a Buyer Zone, where multiple fake breakouts occurred — signaling liquidity sweeps and failure of sellers to maintain downward momentum. Each test of this support has been followed by a sharp bullish reaction, confirming strong demand and accumulation activity in this zone.
Currently, Gold is showing a controlled recovery phase, moving above the $4,040 Support and gradually approaching the $4,120–$4,160 Resistance Zone, which also aligns with the Trend Line extension and previous consolidation area. This zone represents the next critical reaction level for price. A confirmed breakout above it could open the way toward further continuation, while a rejection may lead to a corrective pullback back toward the $4,040 support. The recent price behavior — including several fake breakouts followed by strong recoveries — suggests that large buyers remain active, defending the bullish structure. As long as price holds above $4,040, the overall sentiment stays constructive and favors a gradual continuation toward the upper resistance levels.
My Scenario & Strategy
As long as XAUUSD remains above the $4,000–$4,040 Support Zone, the bullish bias remains valid.The next upside objective is located around $4,140–$4,160, where sellers may reappear based on past reactions. I expect the market to potentially form a small pullback before resuming its move higher. A sustained breakout and close above $4,160 would confirm a continuation toward $4,200 and possibly higher in the medium term.
However, if Gold breaks below $4,000, this bullish setup becomes invalid, and the price may return toward deeper support levels near $3,960–$3,940 before any new buying interest develops.For now, the structure supports buying pullbacks while the price stays above key support.
That's the setup I'm tracking. Thank you for your attention, and always manage your risk.

Wall Street Tech Rally Resumes | USNAS100 Holds Firm Above 25440USNAS100 – MARKET OUTLOOK | Bullish Bias Above 25440
The Nasdaq continues to trade with bullish momentum after stabilizing above 25440, supported by strength in tech stocks and improving market sentiment.
Above 25440: Bullish continuation toward 25700 → 25820 → 26170 (ATH).
Below 25430: Bearish correction possible toward 25230 → 25000 → 24760.
Pivot: 25440
Support: 25230 · 25000 · 24760
Resistance: 25570 · 25700 · 25820
USNAS100 remains bullish while above 25440, but a confirmed 1H close below 25430 could trigger a short-term bearish correction toward 25230–25000.

US30 – Buyers Defend Pivot | Holding 47080 Keeps Trend IntactUS30 – MARKET OUTLOOK | Bullish Bias Above 47080
US30 continues to trade with a bullish tone while holding above 47080, supported by stronger sentiment across U.S. equities.
Above 47080: Bullish continuation toward 47300 → 47460 → 47760.
Below 47080: Bearish correction possible toward 46910 → 46600.
Pivot: 47100
Support: 46910 · 46610 · 46450
Resistance: 47310 · 47460 · 47760
US30 remains bullish while above 47080, but a confirmed 1H close below this level could trigger a short-term bearish correction toward 46910–46600.

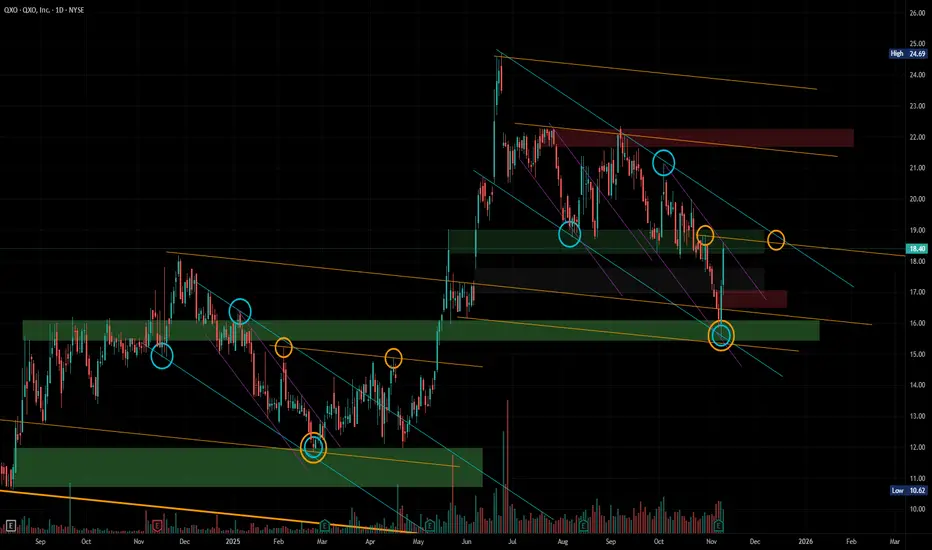
QXO - Power of the Algorithms - Exact Replica of last 100% move This is a post version of the analysis video I posted about QXO last night - highly recommend watching that over this. But for those who don't watch videos (you're missing out because that's where you will start to really understand the algorithms of every chart), here's a simplified version.
I’ve talked before about the fundamentals here and the broader business potential. The analyst coverage is strong - 12 Buy ratings (100% Buy) with an average price target of $32 (range: $27 to $50). And there’s plenty of great content online if you want to go deeper - interviews and podcasts featuring Brad and the leadership team.
Operationally, they're executing extremely well. Their first major acquisition - Beacon Roofing Supply - is performing, and the company has stated very clearly that they expect to make multiple more acquisitions over the next few years. Their long-term goal? To build this into a $50B revenue business within the decade. Ambitious, yes. But realistic if you know Brad’s track record.
But you probably already know that part. You're here for the technical analysis.
So let’s talk about the story of this chart.
The video I posted yesterday walks through this in detail, but the key takeaway is this: we’re currently seeing the exact same liquidity build that formed during the previous breakout from $12 → $24. The same behavior. The same algorithmic demand building. The same storytelling structure in price.
As you see, the bullish nature of this chart is to prove the orange tapered selling algorithm. This is a bullish liquidity building algorithm that leads to further upside breakouts. Our goal is to disprove stronger selling teal buy proving orange. When we do this at a HTF demand/liquidity zone (like we just tapped into), we are given a powerful confirmation of bullish intent. All that's left is to prove the sell-side (top) of the orange algorithm in order to subsequently breakout. See the exact process happen previously in early 2025 - It is a mirror image to what we are seeing happen now.
This is where trading gets interesting - because if we are able to tell the chart's story and structure our plan across short-term, mid-term, and long-term targets, we give ourselves a real edge.
Hope you enjoy the breakdown!
Happy Trading :)
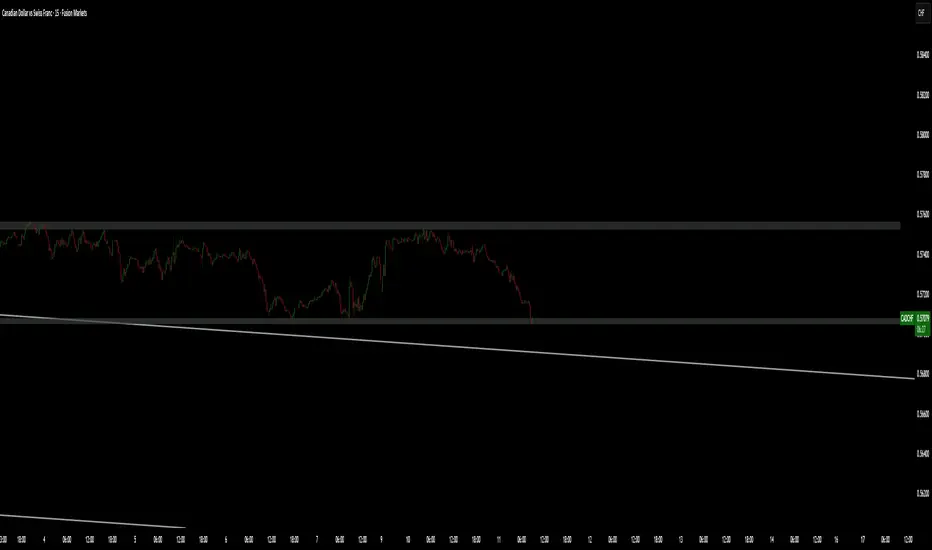
EUR/CAD: Rejection at Trendline Keeps Downtrend IntactEUR/CAD was rejected near the 1.6300 descending trendline after an impulsive bounce, confirming resistance within a bearish structure. Price remains inside a downward channel, with lower highs reinforcing seller control.
As long as price stays below 1.6250, a drop toward the 1.6135–1.6100 support zone is likely, in line with the ongoing correction phase from October’s highs.
❗️ Risks:
– Break above 1.6250 could shift short-term bias bullish.
– Strong Eurozone inflation data may lift the euro.
– Weak Canadian jobs data could limit CAD strength.

USD/JPY - Key Resistance Test with Dual Scenario SetupBias: Neutral – Awaiting Reaction at Key Resistance Zone
Structure: Price is currently in a short-term bullish structure, supported by an ascending trendline while approaching a key resistance area.
Technical Overview
Resistance Zone: Price is approaching a significant resistance level marked by previous liquidity and supply, where a weak high was formed.
Trendline Support: The market has respected the rising trendline, indicating consistent bullish pressure from lower levels.
Session Structure: Tokyo and London sessions show multiple CHoCH and BOS events, highlighting active liquidity grabs before directional continuation.
Strong Low: A strong structural low remains protected, confirming current bullish order flow.
Current Setup
Price is moving toward the resistance zone. Two potential scenarios exist:
Bullish Continuation: A clean breakout above resistance could target higher liquidity levels near 154.800–155.000.
Bearish Rejection: If price fails to break the resistance and shows a CHoCH to the downside, a retracement toward the trendline support or 154.000 could occur.
Wait for confirmation before entering—either a breakout retest for longs or bearish structure break for shorts.
Targets
Upside Target: 154.800–155.000 (liquidity above weak high).
Downside Target: 154.000 (liquidity below recent lows).
Invalidation
Bullish scenario invalidated: If price breaks below the trendline support and closes under 154.000.
Bearish scenario invalidated: If price closes decisively above 155.000.
Summary
USD/JPY is testing a key resistance zone while holding bullish structure from the trendline. The next reaction around this zone will determine whether price continues upward or corrects back toward lower liquidity areas. Traders should wait for a clear structural confirmation before committing to either direction.

XAU/USD: Rally Tests 4,155 as Pullback Risk BuildsXAU/USD extended its rally after breaking out of the range zone, now testing a confluence area near 4,155 within resistance. The structure forms a steep upward channel, with signs of short-term exhaustion near the upper boundary.
If price fails to hold above 4,150, a pullback toward 4,065–4,000 may follow. While the broader trend remains bullish, momentum appears stretched, hinting at a pause before continuation.
❗️ Risks:
– Break above 4,150 could extend gains to 4,220.
– Soft U.S. inflation may weaken USD and lift gold.
– Geopolitical tension could boost safe-haven flows, limiting downside.

GBPUSD Potential UpsidesHey Traders, in today's trading session we are monitoring GBPUSD for a buying opportunity around 1.31400 zone, GBPUSD is trading in an uptrend and currently is in a correction phase in which it is approaching the trend at 1.31400 support and resistance area.
Trade safe, Joe.

Right now, I've discovered another market opportunity.We publicly pointed out that we should pay close attention to the resistance in the 4100-4120 range. After encountering resistance, a pullback was expected. The market trend was largely in line with our expectations, with the lowest point reaching around 4074. We were very satisfied with the substantial profit we achieved.
There was indeed some upward movement during the day. This week, we need to focus on the news: Although the market continued its strong performance at the beginning of the week, it was easy to create the illusion that a "sharp rise was about to happen". However, the government shutdown is now in its final countdown, so we need to be wary of potential risks. Once the shutdown ends, the market may see a significant pullback. Since relevant news has already released signals, we should remain rational about the recent rise and not blindly follow the trend. There is always something fishy going on, so it is better to be cautious. For more detailed instructions, please refer to the notification at the bottom.
From a technical perspective, gold has repeatedly faced resistance near 4110 after breaking through 4100. It is severely overbought in the short term and shows signs of a potential top. I personally do not recommend continuing to buy at this high level to avoid a sharp drop, which is a common market shakeout pattern. Therefore, my strategy remains to prioritize short-term shorting. From the current structure, 4100 has not truly stabilized. Do not blindly and aggressively chase the upward trend. Focus on short-term adjustments and seize opportunities to trade within the time frame. Short positions can be initiated in the 4100-4120 range, with a target of 10-40 USD. The key support level to watch is 4050-4030, which can be considered as a range for buying on dips and medium- to long-term positions. It is best to remain on the sidelines and not participate in positions in the middle range. The 4100-4120 range remains a key focus for short-term bears. Market trends don't only rise or only fall. If you grasp the opportunities well, every phase can be a chance. Generally speaking, don't blindly chase the rise when you're bullish. Flexibly manage the rhythm of primarily long positions and secondarily short positions, and follow the trend to achieve steady success.

GBPUSD overexhausted.GBPUSD pulled down after news for liquidation. A possible overexahaustion candle has occured and ready for a pull back UP.

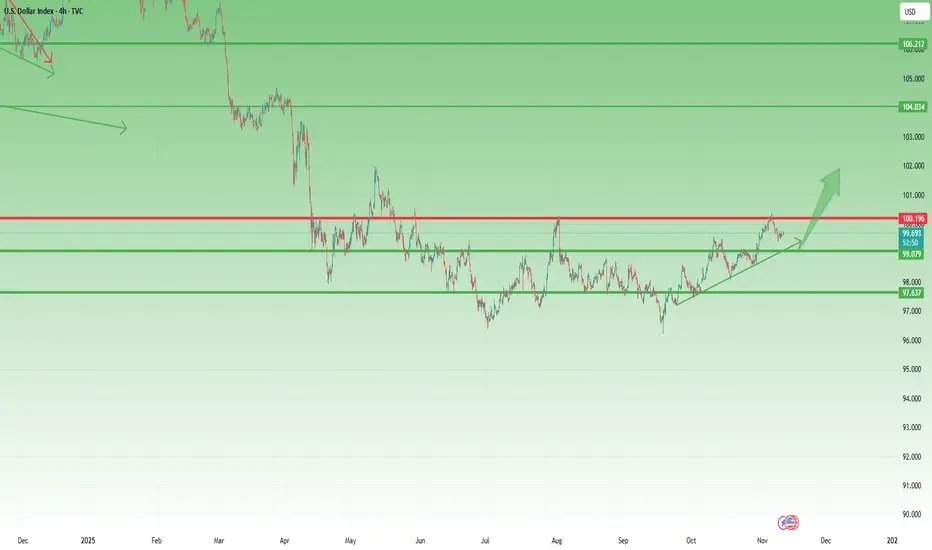
DXY Pulls Back from 100 – A Healthy Correction, Not a Reversal1. What Happened Since Last Week
In last week’s DXY analysis, I warned that although the U.S. Dollar Index remains in a broader uptrend, the 100.00 level represents both a strong technical and psychological resistance that could trigger a short-term retracement.
That scenario played out almost perfectly — after a brief spike above 100, DXY rolled over and is now trading near 99.70.
2. Market Context
The pullback so far looks orderly, not impulsive, suggesting that this move is a correction within an ongoing bullish structure, rather than the start of a major reversal. The market is simply digesting gains after a move higher.
3. Technical Outlook
The area between 99.00 and 99.20 stands out as a key confluence support zone, combining horizontal structure with the up trend line. This is where I expect buyers to reemerge if the index continues to drift lower.
4. Trading Plan
If DXY dips into 99.00–99.20, I’ll look for signs of USD strength resuming — specifically by considering short setups on GBP/USD and EUR/USD.
5. Conclusion
The dollar remains in an uptrend, and this pullback appears to be healthy, not bearish. As long as DXY holds above 99.00, the broader bullish bias remains intact, and traders should prepare for a possible rebound in the next sessions. 💵
GBPJPY IDEA FOR OCT, 11TH 2025.The price is breaking new highs, which signals bullish momentum. If the price holds its current zone of resistance, that signals expectations of short-term selling power. Before it continues upwards, the price is still overall bullish.
As usual, my calls or analysis are based on what I see, the current Bias, and from a probability standpoint, meaning that this projection may be or may not be validated, so tread carefully. This is not financial advice; trade responsibly.

OUTLOOK FOR TODAY XAUUSD 1H Analysis (11th November 2025)Hey Guys, This is just a trade idea and not a financial advise.
BUY/SELL SCENARIOS:
BUYS:
1) Retest the 1h Bullish OB at the 4 114.52 level.
2) Create a 3/5m Bullish CHOCH with a body candle close (with a FVG).
3) Retest the 3/5m Bullish CHOCH level to capitalise on BUYS towards the 4161.40 level.
SELLS:
1) Body candle close below the 4106.83 level.
2) Retest the failed 1H Bullish OB at the 4106.83 level.
3) Create a 3/5m Bearish Engulfing Candle Level to capitalize on SELLS towards the 4071.60 level.
Trade smart, trade according to your trade plan!

One line to rule them allNYSE:AA with a trendline that briefly tells a story.
Acts both as support and resistance
