Bajaj Finserv Potential BuyNifty Service Sector is in our favour (following W pattern).
Bajaj Finserv seems to be bouncing off from 50 EMA and following the W pattern of Nifty Service Sector.
It also seems to give breakout from the apparent ascending triangle.
Trend Lines

LINK - Approaching Breakout From Descending TrendlineChainlink (LINK/USDT) is currently trading near a key support zone around $15.00–$15.20, where price has shown multiple bounces. The chart also shows a descending trendline acting as resistance. Price is beginning to push up from support and is approaching this trendline again.
A breakout above the descending trendline could signal a shift in momentum, potentially leading to a bullish move toward the next resistance levels around $15.60 and then the projected target zone near $16.20–$16.40.
Overall, the chart suggests a possible trend reversal scenario, but confirmation would come from a clean breakout and retest of the descending trendline.

BTC soon to rally?In the 4h chart, BTC is showing a bullish divergence, which can lead to a good bullish rally IF the 4h candle closes above the 104k mark.

This is next Few Months | TradeWithMKY |Hello everyone
in 2027 and also 2026 we are expecting to reach our targets in total market cap
China and USA trade War make this situation
its important that we can expect much more if price wont lose this channel ♥
#TradeWithMky

Bitcoin Just Broke Out! Is $117K Next? (MA50 + Fibo 161% Confirm🚨 MAJOR BTC MOVE!
After weeks of consolidation, Bitcoin has officially broken the downtrend and showed a strong bounce from the MA50, turning previous resistance into support.
📈 Setup Breakdown:
✅ Downtrend breakout confirmed
✅ Clean reaction from MA50
✅ Long entry triggered with upside targets
🎯 Target 1: $112,644 (161% Fibo)
🎯 Target 2: $117,351
📊 This could be the beginning of a new leg up. Watch price behavior at key levels and manage risk accordingly.
💬 What’s your take? Are we heading to $120K or is this a bull trap? Drop your thoughts below 👇
🔁 Like & Share if you caught this move!
📺 Follow for more real-time setups @ TradeWithMky 🧠📉
—
“TradeWithMky – where altcoins speak louder than Bitcoin!”

PNUT/USDT – Bullish Rebound from Channel Support | Long SetupPNUT/USDT is currently respecting the ascending parallel channel on the 4H timeframe. Price bounced off the lower boundary of the channel, showing signs of a potential bullish continuation. A long position is entered near support, with a target toward the upper range of the channel and a tight stop loss just below the structure.
🔹 Entry: ~0.2218
🔹 Stop Loss: ~0.2140 (below channel support)
🔹 Take Profit: ~0.2521 (upper channel resistance)
🔹 Risk-to-Reward: ~4.2R
The trade aligns with the trend structure and offers a favorable R:R setup. Break of the channel may invalidate the setup.

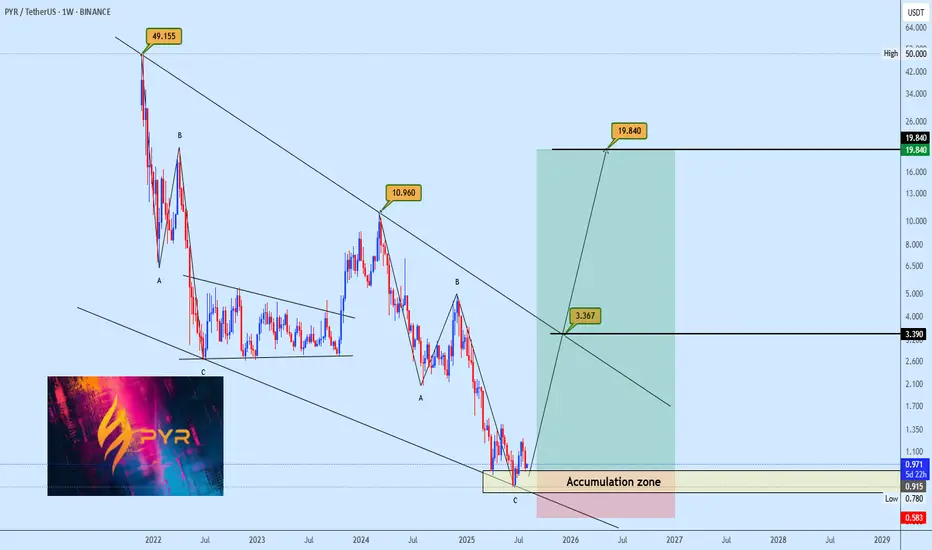
PYR Falling Wedge OpportunityPYR is currently forming a potential falling wedge, with price recently bouncing off the bottom support zone. The plan is to accumulate within the lower region of the wedge and anticipate a move toward the upper boundary. Profit targets are highlighted on the chart for clearer decision making. Keep your risk management in check and let us know your view.
Your feedback is always welcome
Trade idea for monday1. Bullish Scenario (Breakout Play)
Entry: Wait for a confirmed breakout and 30-min candle close above 4,020–4,030.
Retest Entry: Enter on retest of 4,010–4,020 zone.
Targets:
TP1: 4,060 (first resistance)
TP2: 4,100
TP3: 4,160
Stop-Loss: Below 3,980 (below breakout candle or wedge support)
R:R: ~1:2.5 to 1:3 depending on target.
2. Bearish Scenario (Rejection Play)
Entry: If price rejects 4,020–4,030 and closes below 3,995.
Targets:
TP1: 3,960
TP2: 3,945 demand zone
Stop-Loss: Above 4,030
R:R: ~1:2 potential

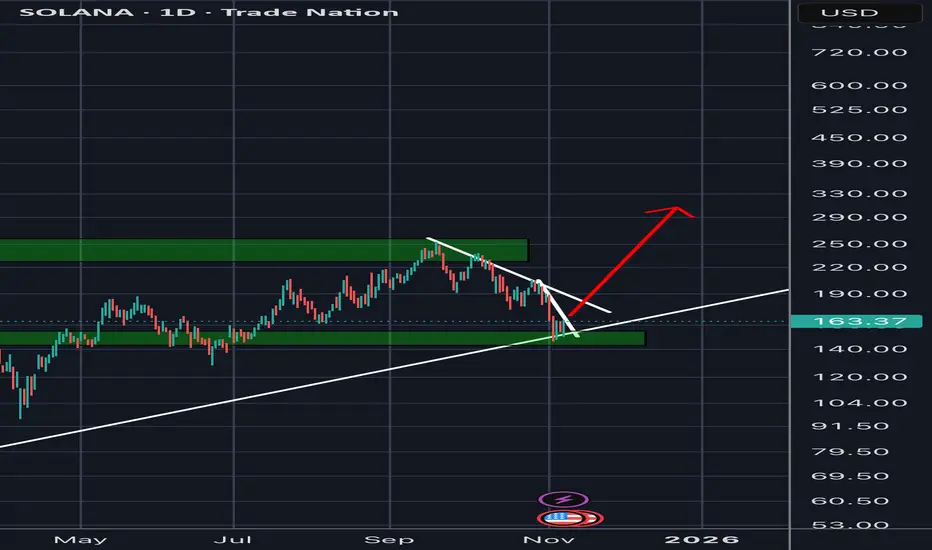
(SOL) Spot Long 10-08-2025SOL /We have Government Shutdown Ending, ETF's, Clarity Act, Trump Tariffs Blocked, New Chair of the Federal Reserve, QE, & Maybe Stimulus Checks for the USA Taxpayers all Incoming Soon!
Plus,
Fear = Oversold = I Buy = $
SOL will RISE!
:)

Litecoin Rainbow Chart + Elliott Waves TheoryThis is what I believe will happen to Litecoin in the next years
Litecoin Rainbow Chart indicator (Power Law), combined with the most probable EW counting seems to be simply perfect.
This trade will retire my bloodline
Thank you for your support
Łama

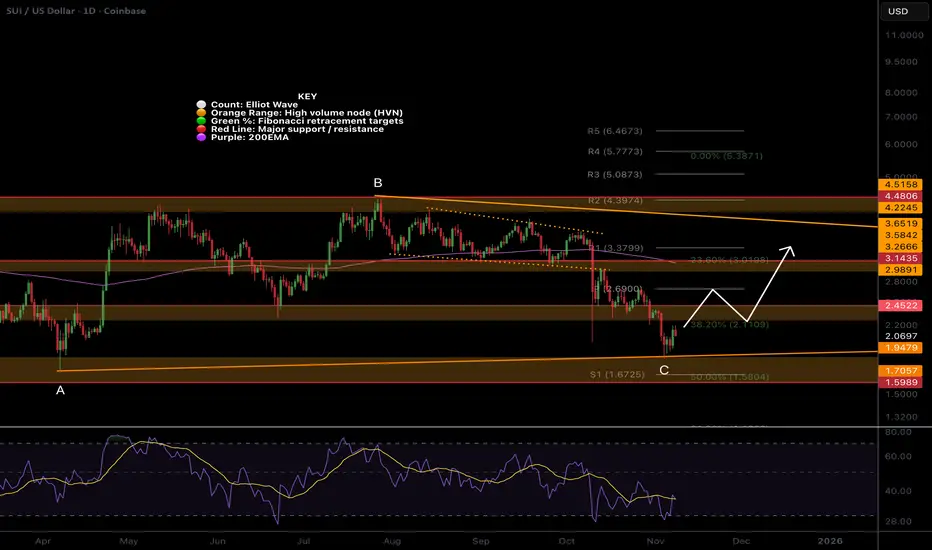
SUI remains in a shallow Fib triangleCRYPTOCAP:SUI Price remains in a downtrend, falling below a major High Volume Node support, tapping the macro triangle lower boundary.
Wave C of the triangle appears complete. If this count is correct, we should accelerate to the upper boundary around $3.6 over the next month or so, with some difficulty at the daily 200EMA and pivot as resistance.
📈 Daily RSI printed bullish divergence from oversold
👉 Continued downside loses the triangle pattern, and the next target is $1.6
Safe trading
SOL holds up wellCRYPTOCAP:SOL Price continues lower in the channel, a textbook ABC correction so far.
Wave 1 ended with a wedge throw-over. Price has found support above the Fibonacci golden pocket and High Volume Node at the channel's lower boundary. The probability is a continuation to the downside with a target of $140.
📈 Daily RSI tapped oversold with no divergence to suggest a bottom
👉 Continued downside brings up the $112 target, a great buy opportunity
Safe trading

HBAR back in the channel!CRYPTOCAP:HBAR Price is back in the descending range after dropping below during the flash crash, which can be viewed as an anomaly.
Wave 2 appears complete at the golden pocket Fibonacci retracement. Price was rejected at the daily 200EMA and channel upper boundary and has lost the daily pivot and High Volume Node, suggesting further downside is to come.
📈 Daily RSI reached oversold and has printed hidden bullish divergence, which is bullish
👉 Continued downside has a target of the $0.13 High Volume Node
Safe trading

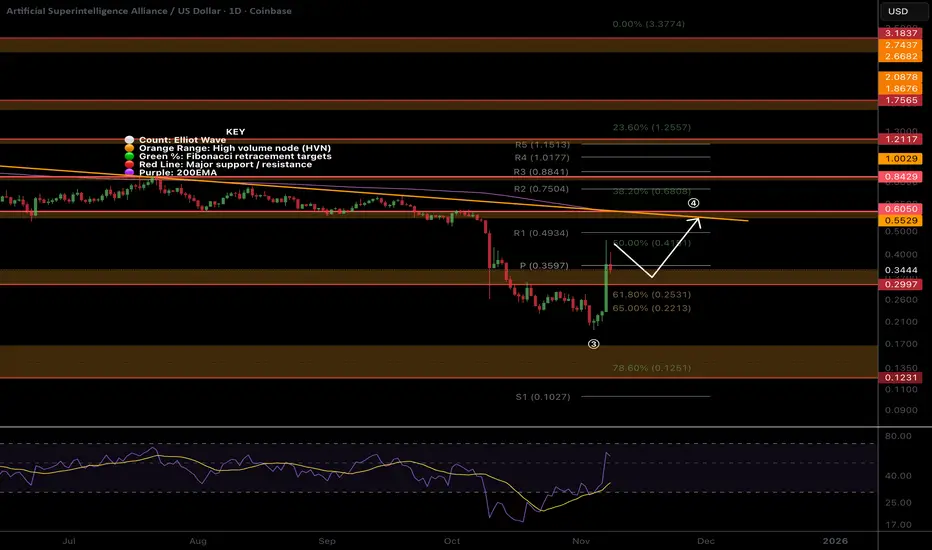
FET, Pump and dump?NYSE:FET Price bounced with a one day candle of 70% recovering the High Volume Node resistance and daily pivot from the golden pocket Fibonacci retracement.
Chasing candles higher is what’s on the cards of naive investors now. Greed and FOMO immediately took over socials with much gloating. This is a recipe for lower, humbling them.
📈 Daily RSI went too high, too fast, and now has bearish divergence in a bear market, a strong signal.
👉 Continued upside has a target of the daily 200EMA and High Volume Node resistance at $0.6.
Safe trading
ETH at critical level around 200SMALast time ETH hovered around it, it acted as a resistance to the price action. after ETH broke up from it they were far apart until now, if ETH hold around and above it, it is going back to the 4K USD in no time. Also it looks like ETH respects the 50% Fibonacci level. Im buying BMNR!


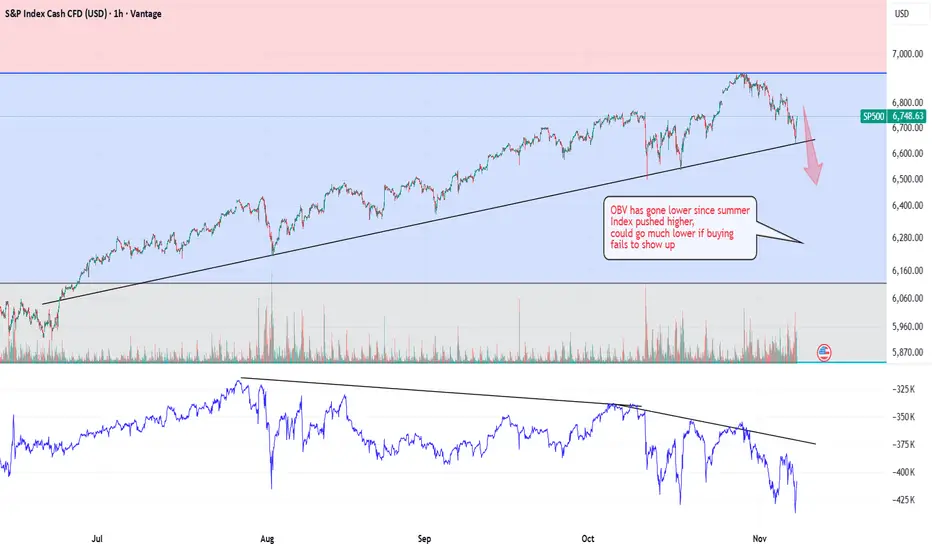
SP500 is weak about to drop through trend line Fib 1.618 madeBearish set up, (following on from my other post where the price at the top of the market hit a fix 1.618 extension of the prior recent down move almost to the tick, which I told people about before it happened as a great potential inflection point) Yes I am short.
The trendline must hold for the bulls,
The OBV on balance volume suggests weakness in the index
Suggesting the trend line will not hold for long, unless buying comes in
Next stop back will be lower, most likely with bear market rallies
I think we will test 4800 again between now and end of next year.
If a sell off starts it could be extreme, the market is weak.
There are hardly any bears left, mutual funds have minimal cash on side lines left to buy.
Government shutdown in USA has woken people up to having not everything in the markets and need cash on hand to pay bills if they dont get paid by Government.
We are only down 4% from a potential top, imagine selling the top within 4% in a few years time that will be acceptable for most traders. Even as a hedge and to bank some of those gains.
If it turns out to be a top, just sell a few contacts each few until you build up a nice sized position. Watch out for bear market rallies. Ifs a bear they will be super sharp upside, and then you can sell them at size. Look back historically to see how much these bear market rallies rise,
I notice that you can draw a nice downside trend line in a bear market and just sell every time the price hits that trend line to be very well off if it turns out to be a bear. not advice only fictional trading, of those that work hard at trading to make theirs and others dreams come true. Be grateful that you saw this now and took the time to understand the risks and potential gains because it could change your life
USDJPY Eyes 153.000 Support as Hawkish Fed Keeps Dollar Bid!Hey Traders,
In the coming week, we’re monitoring USDJPY for a buying opportunity around the 153.000 zone. The pair remains in a clear uptrend and is currently in a correction phase, approaching a key support and resistance area at 153.000.
Fundamentally, the Fed’s recent hawkish tone emphasizing stronger than expected labor data and pushing back against December rate cut bets continues to support USD strength, keeping upward pressure on the pair.
A sustained reaction at 153.000 could signal the next leg higher.
Trade safe,
Joe.

AUDUSD Potential DownsidesHey Traders, in today's trading session we are monitoring AUDUSD for a selling opportunity around 0.65100 zone, AUDUSD is trading in a downtrend and currently is in a correction phase in which it is approaching the trend at 0.65100 support and resistance area.
Trade safe, Joe.

ESPR 1W: cholesterol therapy for patients and investors alikeEsperion Therapeutics (ESPR) has broken its long descending trendline and retested the $2.4–$2.6 support area, forming a solid triple bottom with rising volume. The stock is now holding above key moving averages, signaling accumulation. While above $2.5, the technical setup points to a move toward $6.4, aligning with major resistance and the 200-week MA.
Fundamentally, the company enters one of its strongest phases in years. Following earlier liquidity struggles, Esperion has stabilized its operations and regained investor confidence. The core growth driver is Nexletol (bempedoic acid), a non-statin cholesterol-lowering therapy for patients intolerant to statins. In 2025, combined Nexletol and Nexlizet sales jumped over 45% year-on-year, surpassing $170 million for the first nine months. Recent safety data were positive, leading to new approvals across Europe and Japan - expanding partnerships and licensing revenues. Cash position strengthened via milestone payments from Daiichi Sankyo and Viatris, reducing debt and supporting R&D without new dilution. Challenges remain: profitability is still out of reach, as marketing and development expenses stay high, though liquidity provides breathing room. The broader biotech sector’s rebound amid rate-cut expectations adds tailwind to revenue-backed small caps like Esperion.
Tactically, holding above $2.5 keeps the bullish trajectory intact toward $6.4. A weekly close below $2.3 would negate the setup and re-test lower support, though current accumulation favors the upside.
Esperion helps reduce cholesterol - ironic that its chart still raises investors’ heart rate.

SOL aint looking that goodYes, the market structure isn't really broken and it hasn't lost any major support
Yes, it can go higher, a lot higher,
and yes it's been one of the best performers of this cycle .
Which makes it rather risky to short it. But it doesn't change the fact that it:
- Failed to beat critical levels
- By being one of the best performers, retail is loving it.
- Everyone is too comfy in longs.
The level i had for SOL back in last year happened to be the exact bottom, so I'm being cautious here.

Nasdaq Short: Peak Confirmed; Bear Market ConfirmedIt is now clear that the bull market ended on 30th Oct and that we have already seen the first completed wave down for Nasdaq that unfolded in clear 5-wave structure. The sub-waves also showed clear 5-wave structure themselves.
We are currently in a wave 2 retracement that is facing the first real support-turned-resistance. However, take note that wave 2 can technically go all the way up to the start of wave 1 without invalidating the idea. So look out for reversal signal or confirmation before you short.