Right now, I've discovered another market opportunity.We publicly pointed out that we should pay close attention to the resistance in the 4100-4120 range. After encountering resistance, a pullback was expected. The market trend was largely in line with our expectations, with the lowest point reaching around 4074. We were very satisfied with the substantial profit we achieved.
There was indeed some upward movement during the day. This week, we need to focus on the news: Although the market continued its strong performance at the beginning of the week, it was easy to create the illusion that a "sharp rise was about to happen". However, the government shutdown is now in its final countdown, so we need to be wary of potential risks. Once the shutdown ends, the market may see a significant pullback. Since relevant news has already released signals, we should remain rational about the recent rise and not blindly follow the trend. There is always something fishy going on, so it is better to be cautious. For more detailed instructions, please refer to the notification at the bottom.
From a technical perspective, gold has repeatedly faced resistance near 4110 after breaking through 4100. It is severely overbought in the short term and shows signs of a potential top. I personally do not recommend continuing to buy at this high level to avoid a sharp drop, which is a common market shakeout pattern. Therefore, my strategy remains to prioritize short-term shorting. From the current structure, 4100 has not truly stabilized. Do not blindly and aggressively chase the upward trend. Focus on short-term adjustments and seize opportunities to trade within the time frame. Short positions can be initiated in the 4100-4120 range, with a target of 10-40 USD. The key support level to watch is 4050-4030, which can be considered as a range for buying on dips and medium- to long-term positions. It is best to remain on the sidelines and not participate in positions in the middle range. The 4100-4120 range remains a key focus for short-term bears. Market trends don't only rise or only fall. If you grasp the opportunities well, every phase can be a chance. Generally speaking, don't blindly chase the rise when you're bullish. Flexibly manage the rhythm of primarily long positions and secondarily short positions, and follow the trend to achieve steady success.
Trend Lines

GBPUSD overexhausted.GBPUSD pulled down after news for liquidation. A possible overexahaustion candle has occured and ready for a pull back UP.

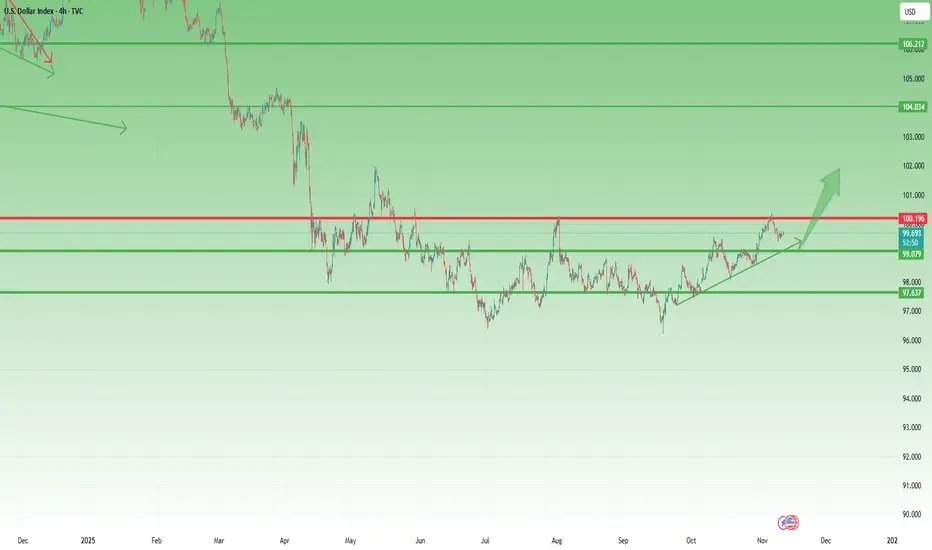
DXY Pulls Back from 100 – A Healthy Correction, Not a Reversal1. What Happened Since Last Week
In last week’s DXY analysis, I warned that although the U.S. Dollar Index remains in a broader uptrend, the 100.00 level represents both a strong technical and psychological resistance that could trigger a short-term retracement.
That scenario played out almost perfectly — after a brief spike above 100, DXY rolled over and is now trading near 99.70.
2. Market Context
The pullback so far looks orderly, not impulsive, suggesting that this move is a correction within an ongoing bullish structure, rather than the start of a major reversal. The market is simply digesting gains after a move higher.
3. Technical Outlook
The area between 99.00 and 99.20 stands out as a key confluence support zone, combining horizontal structure with the up trend line. This is where I expect buyers to reemerge if the index continues to drift lower.
4. Trading Plan
If DXY dips into 99.00–99.20, I’ll look for signs of USD strength resuming — specifically by considering short setups on GBP/USD and EUR/USD.
5. Conclusion
The dollar remains in an uptrend, and this pullback appears to be healthy, not bearish. As long as DXY holds above 99.00, the broader bullish bias remains intact, and traders should prepare for a possible rebound in the next sessions. 💵
GBPJPY IDEA FOR OCT, 11TH 2025.The price is breaking new highs, which signals bullish momentum. If the price holds its current zone of resistance, that signals expectations of short-term selling power. Before it continues upwards, the price is still overall bullish.
As usual, my calls or analysis are based on what I see, the current Bias, and from a probability standpoint, meaning that this projection may be or may not be validated, so tread carefully. This is not financial advice; trade responsibly.

OUTLOOK FOR TODAY XAUUSD 1H Analysis (11th November 2025)Hey Guys, This is just a trade idea and not a financial advise.
BUY/SELL SCENARIOS:
BUYS:
1) Retest the 1h Bullish OB at the 4 114.52 level.
2) Create a 3/5m Bullish CHOCH with a body candle close (with a FVG).
3) Retest the 3/5m Bullish CHOCH level to capitalise on BUYS towards the 4161.40 level.
SELLS:
1) Body candle close below the 4106.83 level.
2) Retest the failed 1H Bullish OB at the 4106.83 level.
3) Create a 3/5m Bearish Engulfing Candle Level to capitalize on SELLS towards the 4071.60 level.
Trade smart, trade according to your trade plan!

One line to rule them allNYSE:AA with a trendline that briefly tells a story.
Acts both as support and resistance

The bullish trend in gold has begun to continue.
News:
Gold prices broke through resistance again in early US trading on Monday (November 10), resulting in a volatile rebound in the market. Spot gold opened at its lowest point of the day and then rose steadily throughout the day, currently trading around $4090, up 1.91%.
With the government shutdown nearing its end, the Federal Reserve may be poised to shift its policy. "The Fed currently lacks comprehensive data support... but it is already sensing weakness in the labor market." In the absence of reliable data anchoring, policy decisions will face significant challenges.
Technical aspects:
The combination of technical and fundamental factors has strengthened the short-term upward momentum for gold, with support around 4050 and the Bollinger Band middle line at 4030 acting as lower support. Resistance is located at 4120.00.
If the yield tests the upper Bollinger Band at 4.146%, gold may face opportunity cost pressure and retrace to the middle line; however, the MACD golden cross indicates solid lower support. If the price holds above the short-term support at 4050, it may further test 4120.00.
Trading strategy:
Buy:4050-4045, SL: 4040, TP: 4080-4120

QXO. It doesn't get better than this. Not IF but WHEN!I want to start by saying upfront - even though this video has a confident title, nobody truly knows what the market is going to do next. All any of us can do is interpret the story the chart is telling and share our perspective. So this is not financial advice — please do your own research, especially with a company like this, which has a unique history and is led by one of the most impressive American operators in Brad Jacobs.
I’ve talked before about the fundamentals here and the broader business potential. The analyst coverage is strong - 12 Buy ratings (100% Buy) with an average price target of $32 (range: $27 to $50) . And there’s plenty of great content online if you want to go deeper - interviews and podcasts featuring Brad and the leadership team.
Operationally, they're executing extremely well. Their first major acquisition - Beacon Roofing Supply - is performing, and the company has stated very clearly that they expect to make multiple acquisitions over the next few years. Their long-term goal? To build this into a $50B revenue business within the decade. Ambitious, yes. But realistic if you know Brad’s track record.
But you probably already know that part. You're here for the technicals.
So let’s talk about the story of this chart.
The video walks through this in detail, but the key takeaway is this: we’re currently seeing the exact same liquidity build that formed during the previous breakout from $12 → $24. The same behavior. The same algorithmic demand building. The same storytelling structure in price.
This is where trading gets interesting - because if we structure our plan across short-term, mid-term, and long-term targets, we give ourselves a real edge.
Hope you enjoy the breakdown. I genuinely had fun putting it together.
Happy Trading All!

USD/CAD Reversal from Channel Resistance ContinuesUSD/CAD rates are continuing their reversal lower within their multi-month uptrend following last week’s Canadian jobs figures. Stronger than expected jobs growth in Canada has helped tamp down Bank of Canada (BoC) rate cut odds through the end of the year, while the prospect of Trump’s tariffs being struck down by the Supreme Court have likewise emboldened the Loonie. In the options market, Canadian Dollar futures are currently in the 48th percentile for volatility over the past year, highest among major USD-pairs.
In the above chart, USD/CAD rates have backed away from rising channel resistance, marked by the February 2025 swing low near 1.4151. The reversal in recent sessions is pushing the pair back into the area between the 20-day exponential moving average (EMA) and 50-day EMA, which proved itself as support at the end of October. A drop below the 100-day EMA would produce a break of the rising channel in motion since mid-June. At first blush, dip buyers may be in play closer to 1.3900 on a continued pullback.


Long on Silver FuturesThis is an update on the long-term bull trend in silver as reflected in the futures market. First, the uptrend channel was reentered after a short breakout. This correction is good. It is strong as the heart line has not been broken and is seeking higher levels to break back out of the channel for the parabolic run. I am looking at a 49.80 USD marker to signal a true run back into price discovery.

USD/CAD Rally Stalls into Trend Resistance at Seven-Month HighsThe Canadian Dollar is getting reprieve today with USD/CAD snapping a six-day rally to seven-month highs. Stronger-than-expected Canadian employment figures amplified today’s decline with a reversal off uptrend resistance now threatening a deeper correction within the July uptrend. The immediate focus is on this pullback in the days ahead with the November opening-range taking shape above the median-line.
Initial support rests with the October high close at 1.4055 and is backed by the monthly open / May high at 1.4011/17- note that the medina-line converges on this threshold next week. Ultimately a break / close below the 2022 high / 61.8% retracement of the recent advance at 1.3977/85 is needed to suggest a more significant high is in place / a larger reversal is underway. Subsequent support rests with the 200-day moving average at (currently at 1.3940) with broader bearish invalidation steady at 1.3881/99- a region defined by the 2022 high-close and the 2023 swing high.
Initial resistance now eyed with the monthly high-close at 1.4115 and is backed by the 50% retracement of the yearly range / November high at 1.4167/78. A breach / close above this threshold would threaten another accelerated advance with subsequent top-side objectives eyed at the March low at 1.4235 and the 61.8% retracement at 1.4315.
Bottom line: USD/CAD has responded to uptrend resistance and the risk now rises for a deeper pullback within the broader July advance. From a trading standpoint, losses would need to be limited to 1.3978 IF price is heading higher on this stretch with a close above 1.4178 needed to fuel the next major leg of the rally.
-MB

Euro Testing September Downtrend- Breakout to Offer GuidanceEuro is responding to downtrend resistance at the upper parallel of the descending pitchfork we have been tracking off the yearly high. The monthly opening-range is taking shape just below and the focus is on a potential breakout over the next few days. Initial support rests at the October swing low and the monthly open at 1.1537/42. A break / close below the 75% parallel is ultimately needed to mark downtrend resumption with subsequent support objectives seen at the 1.15-handle and the monthly low at 1.1469- look for a larger reaction there IF reached.
Initial resistance remains with the upper parallel and is backed by the Fed-day reversal close at 1.1601. Ultimately a breach / close above 1.1641/45 is needed to suggest a more significant low is in place / a larger reversal is underway.
Bottom line: Euro is responding to downtrend resistance with the weekly / monthly opening-range taking shape just below. From a trading standpoint, rallies should be limited to 1.16 IF price is heading lower on this stretch with a close below 1.1469 needed to fuel the next leg of this decline.
-MB

DOGEUSDT weekly support hold strong wait for more pumpAs observed on the chart, the major weekly support for DOGEUSDT at $0.15 has demonstrated significant resilience, establishing a robust foundation for the asset. The subsequent bullish momentum we anticipated has indeed commenced, indicating a potential shift in market structure.
The critical technical level to monitor is the primary descending trendline resistance. A decisive and high-volume breakout above this resistance would serve as a strong confirmation of bullish strength, potentially invalidating the prior downtrend. Such a validated breakout could initiate a new bullish phase, with the potential to challenge previous cycle highs and establish new all-time highs on the chart.
DISCLAIMER: ((trade based on your own decision))
<<press like👍 if you enjoy💚

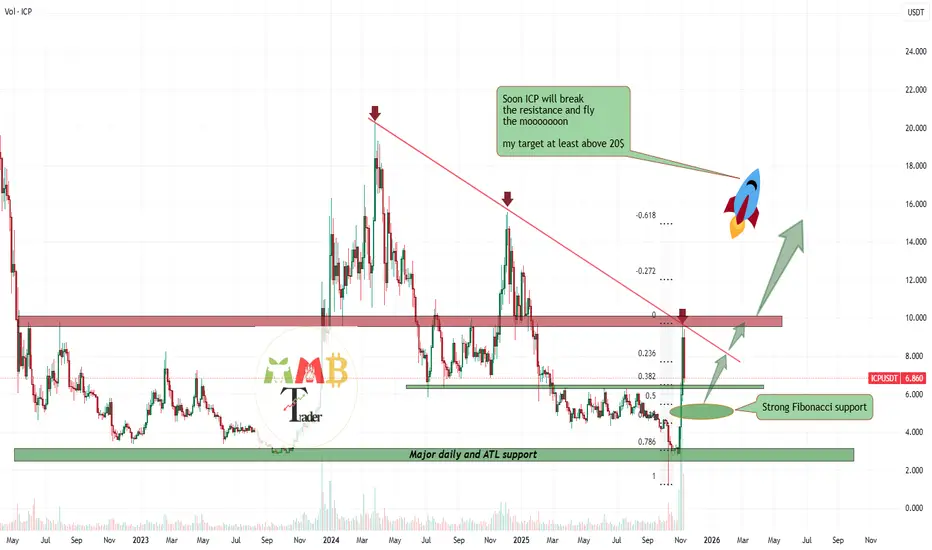
ICPUSDT targeting 20$ at least!!!!After an extended period of consolidation and underperformance following its all-time high, ICPUSDT has established a significant base and is demonstrating a strong recovery from its historic lows. The price is currently encountering a primary test at the key descending trendline resistance on the daily chart.
The technical structure suggests that the asset is accumulating strength for a potential breakout. A decisive and sustained move above this trendline could signify a major shift in market structure, potentially initiating a powerful bullish impulse. Based on the scale of the prior accumulation phase, such a breakout could project an initial upward move toward the $20.00 level, representing a potential appreciation of several hundred percent from current levels and even more pump after that may happen.
DISCLAIMER: ((trade based on your own decision))
<<press like👍 if you enjoy💚
SHIBUSDT soon two major resistance will break and then pump As observed on the SHIBUSDT chart, the price is undergoing a significant correction, consistently facing rejection at two distinct descending trendline resistance levels. Each test of these dynamic resistances has resulted in a sell-off.
However, the current technical structure suggests a potential for an upside breakout. The primary scenario is a decisive break above the first, more immediate trendline. This initial breakout would project a move toward the second, higher trendline as the initial technical target. Following a potential consolidation period, a subsequent breakout above the second trendline would signal a much stronger bullish trend activation, potentially initiating a sustained and significant upward movement.
DISCLAIMER: ((trade based on your own decision))
<<press like👍 if you enjoy💚

BTC/USDT: Lower Highs Hold as Price Stalls Below 109K ResistBTC/USDT fulfilled the prior move and is now struggling below the 109,000 resistance after rebounding from 99,000. Price remains in a descending channel, approaching a key confluence zone near 109,200 where upward and downward trendlines intersect.
If this level holds, a decline toward 102,250 support remains likely. The bearish bias stays intact as long as the lower high structure persists.
❗️ Risks:
– Break above 109,800 may trigger short covering.
– Dovish Fed or soft inflation data could lift sentiment.
– ETF inflows may drive renewed spot demand.

EUR/USD: Rebounding Off 1.15 as Buyers Eye Short-Term RecoveryEUR/USD is bouncing from the 1.15 psychological support after a fake breakdown of October’s low. Price is forming a short-term reversal inside a rising channel, hinting at a corrective bullish move.
If the pair holds above 1.1530, a push toward 1.1620 resistance is likely. Momentum supports a short-term bullish bias before the broader downtrend resumes.
❗️ Risks:
– A strong U.S. CPI print could trigger a sharp USD rally.
– Dovish ECB commentary may cap euro strength.
– Falling below 1.1520 invalidates the recovery setup.

GBPCHF: Wait For Breakthrough Then Swing BuyGBPCHF has been accumulating and currently all time low, we can see price distributing in soon time, however, before it does we need a stronger confirmation in form of breakthrough of the trend line. Once price has breached the trend line we can enter when price does the reconfirmation, this will give us enough confidence to enter swing buy position with strict risk management. If you like the idea then do consider liking and commenting our ideas.
good luck and trade safe!
Team Setupsfx_❤️🚀

DPZ - The market is setting up for something...The formations of "Cup & handles" as well as "Head & shoulders" are just visual ways to describe what the market is doing to be efficient.
The market's efficiency of course runs on the basic concept of supply & demand - but in order for that to happen efficiently, we need to constantly fight it out on multiple time frames to remove a certain side and then replenish at lower and higher levels.
In DPZ's case, we are looking to shake off buyers (built up at the $400 support level) in order to re-introduce newer and larger buyers at lower levels - subsequently replenishing buyers while also 'trapping' sellers.
This constant game of cat and mouse happens throughout all time frames - and is a big reason why most traders feel like they are constantly losing and that the market is against them - because it is!
Enough of the lesson - my thesis here is the market is intentionally building a large support base in order to break through, lose buyers (stopped out), trap sellers, and give the opportunity to big money to enter positions at attractive prices.
Target Entry: $380
Target Exit (Short term): $450
Target Exit (Long Term): $530
Happy Trading :)

The gold price trend is clear; opportunities lie in the timing!At the start of the week, the gold price chose a clear upward direction, breaking through key resistance levels at 4030 and 4050, reaching a high near 4095. From the overall trend structure, the bullish momentum remains strong, and the short-term trend is still robust. However, the upside potential is gradually being limited. The biggest mistake in trend trading is chasing emotions. I personally prefer to focus on resistance signals in the 4100-4120 area. If signs of resistance appear, consider shorting at higher levels. If the price retraces to the 4050-4030 area and stabilizes, that would be a more stable entry point for long positions. After the breakout, the pace accelerates. The key now lies in entry points and execution. Avoid chasing highs and blindly shorting; steadily follow the rhythm and wait for market confirmation. True stability lies not in prediction, but in the unity of execution and rhythm.

Double top after ascending triangle: 163$ will be retestedDouble top occurred at COINBASE:BTCUSD and at $COINBASE:SOLUSD. 163$ will be retested. I think we will see a bounce from there.

Nokia:Inverted Head and Shoulders Structure + Retest of BreakoutOn the weekly chart of Nokia, a classic Inverted Head and Shoulders reversal pattern has formed. The breakout above the neckline occurred with increased volume, confirming the strength of the move. Currently, the price is undergoing a standard technical retest of the neckline from above — a typical phase before a potential continuation higher.
The structure remains active: the projected height (H) points to an initial target at $5.48, based on the distance from the neckline to the head. If momentum continues, Fibonacci extension targets are located at $6.18 (1.272), $6.55 (1.414), and $7.08 (1.618).
Technical view: the retest of the neckline is happening on declining volume, strengthening the probability of a bullish reversal. EMA 50/100/200 are beginning to align in a bullish crossover. The ascending channel structure also supports the upward movement.
Fundamentals: Nokia is progressing with its strategic programs in 5G and upcoming 6G network technologies, reinforcing its long-term growth prospects. Improved financial performance and the recovery in demand for telecommunications infrastructure amid global digitalization trends continue to support investor interest in the stock.
The Inverted Head and Shoulders pattern is confirmed by the breakout and current retest. As long as the price holds above the neckline, the bullish scenario toward $5.48 and beyond remains intact. This is a medium-term trend reversal structure — strong setups like this form the foundation for major moves. Don’t miss them.
