DXY BULLSDXY is currently sitting on a third touch of the trendline and we have a possible Fibonacci, consolidation,200 sma indicating bullish a breakout would take us to 104
Trend Lines

How to correctly grasp the gold trading opportunitiesGold is still maintaining a bullish rhythm, the daily structure is stable, and the bullish trend has not been destroyed. Although it is slightly tired after the continuous rise, there is no obvious peaking signal yet. The hourly chart is still an oscillating upward structure. There is buying every time it falls back, indicating that the bullish force in the market is still dominant. From the four-hour cycle, the moving average system maintains a bullish arrangement, and the price runs above the moving average of each cycle. Although the RSI has entered the overbought range and there is a need for a short-term correction, the overall trend is still strong. The upper 4050-4060 area is the key pressure zone. If it can effectively break through and stand firm, the upper space will be further opened. We recommend that you continue to prioritize buying on pullbacks. Short-term support is in the 4020-4010 area, with stronger defense near the 4000 mark. As long as it stabilizes, there is still an opportunity for bulls. However, we should also be aware that after the continuous rise in gold, there is a possibility of a short-term correction. Aggressive investors can continue to consider shorting with a light position near 4060, with the initial target of 4030-4020-4010. Be sure to control risks, and shorting is only a supplementary strategy. Next, focus on US fiscal dynamics and Federal Reserve policy signals. These news factors will directly affect the short-term fluctuation rhythm of gold. Conservative investors should wait for support confirmation before entering the market, while aggressive investors should gamble with a light position and respond flexibly.

Retractable Technologies | RVP | Long at $0.76Retractable Technologies AMEX:RVP is a cyclical OTC stock that may be in a consolidation / accumulation phase for a major rise in the next 1-2 years. The reason this stock got my initial attention is the CEO bought $800,000 worth of shares over the last two years, with his buy range between $0.60 and $1.28. Pulling up the chart, my historical simple moving average (SMA) line seems to predict (quite well for this ticker) the sudden rise in price (i.e., as the SMA lines get closer to the price, there is a jump in price). The stock only has a 13.1 million float.
Between 2017 and 2019, the stock price consolidated near the levels seen during the last two years. Then, once my selected historical SMA reached the price, it jumped, consolidated further and rose to over $21.00... Now, I don't necessarily think the price will rise that high. There are currently two open price gaps on the daily chart (highest near $6.00) that may get closed.
I may be very early, on time, or the stock could go to zero. But if the CEO is going to risk that much for a current penny-play, I will dabble in the risk and simply be patient until SMA connects with the price.
Nothing to discuss regarding the fundamentals of this one (not great)... it's purely a technical analysis play.
Target #1 = $1.00
Target #2 = $1.25
Target #3 = $1.50
If it soars...
Target #4 = $4.18
Target #5 = $5.90

Gold Holds 3,900 Support Amid Dollar Slowdown and Global TensionHey Traders, in today’s session we’re closely monitoring XAUUSD for a potential buying opportunity around the 3,900 zone. Gold continues to trade within a strong uptrend, and the current pullback appears to be a healthy correction approaching key trend support.
Structure: The broader trend remains bullish, with price consolidating after its recent highs. The 3,900 level stands out as a technical pivot where buyers could regain control.
Macro context: The US Dollar Index is approaching major daily resistance around 98.300, suggesting potential exhaustion in the current USD rebound. Meanwhile, political and fiscal developments in Japan where a notably dovish administration has just taken power could further support demand for safe-haven assets like Gold.
Market sentiment: A combination of fiscal expansion abroad and rising uncertainty surrounding the ongoing US government shutdown is fueling risk aversion. If these pressures persist, Gold could retest the 4,000 zone sooner than expected.
Key focus: Watching how price reacts around 3,900 for potential bullish continuation in line with the broader trend.
Trade safe,
Joe.

Can NASDAQ Hold 24,600 and Push to New Highs?Hey Traders, in tomorrow’s trading session we are monitoring NAS100 for a potential buying opportunity around the 24,600 zone. NASDAQ remains in an uptrend and is currently in a correction phase, with price approaching a key support/resistance level at 24,600.
Structure: The broader trend is bullish, with price moving within an ascending channel.
Key level in focus: 24,600 — a critical support area aligning with the lower boundary of the channel.
Next move: Holding above this level could set the stage for a rebound toward 25,100, which represents the channel’s upper resistance and potential higher high formation.
Trade safe,
Joe.

NZDUSD Eyes 0.5730 Rebound as Dollar Weakens Near DXY ResistanceHey Traders,
In today's trading session, we are monitoring NZDUSD for a buying opportunity around the 0.57300 zone. The pair has been moving within a descending channel and is now approaching the lower boundary, suggesting potential for a technical rebound from channel support.
From a macro perspective, the bearish bias on the U.S. Dollar—driven by the ongoing government shutdown and sustained pressure near the 98.800 resistance on DXY—could further support upside momentum in NZDUSD.
Trade safe,
Joe.

SUSDT.P - Sonic / FTM / Fantom trading planBINANCE:SUSDT.P Sonic/FTM/Fantom
This looks very delicious. If it doesn't fly from here I expect pullback to 8H FVG below and taking a nice swing breakout from there.
I don't see any other inefficiensies in the past chart than that FVG.

Golden opportunity has arrivedGold has continued its strong upward momentum since breaking through the 4000 mark, reaching a high of around 4049. The market has hardly made any decent corrections, market sentiment has continued to be high, and bullish confidence has been infinitely magnified. However, the more emotional the stage is, the more we need to remain calm and rational. Structurally, gold has entered the end of an accelerated upward trend, and short-term indicators are obviously overbought. Although prices have hit new highs, momentum has not increased simultaneously, and there are signs of slight divergence, indicating that the upper space is gradually narrowing. Combined with the 4-hour structure, the 4050-4060 area is a period of strong pressure, and it may face a technical correction in the short term. In terms of operational thinking, you can consider shorting with a light position in the 4050-4060 area, and first target the 4020-4000 area. Conservative people can wait for the confirmation of the pullback before participating, and do not blindly chase the long position. Although gold is strong at present, it is not a mindless rise stage. The larger the bullish space, the deeper the adjustment will often be. At this time, risk control should be the core and planning should be the basis. Short-term short positions should only participate in structural corrections, and should not make impulsive trades that blindly fight against the trend. Steady execution, position control, and maintaining rhythm are the key to remaining invincible in extreme markets.If your recent operations are not ideal, or you are confused about how to grasp the rhythm, you are welcome to communicate with me at any time. I hope I can help you avoid detours and steadily improve your trading thinking and execution.

Gold’s Swings Offer Bears a Profitable EdgeGold has currently reached a high of around 4050, but after reaching this area, the upward trend has been suppressed, and the upward momentum has weakened. Gold needs to retreat in the short term. Gold is currently under pressure in the 4050-4060 area. If gold shows obvious signs of stagflation in this area, then gold may usher in a good pullback at any time.
However, because gold is currently in a strong upward trend, its structure and form are in an obvious bullish trend. Therefore, even if the gold market pulls back, the pullback is not expected to be too large in the short term. We should first focus on the support area below, 4000-3990.
Therefore, in volatile markets, even if gold is in a strong bullish trend, gold shorts still have good profit opportunities due to volatility. So in the short term, we can consider trying to short gold in the 4050-4060 area, first aiming at the target area: 4010-4000 area.
If you're short gold like me, we must be among the first to reap the benefits of a market correction. If you'd like to continue following my trading strategies and signals, be sure to follow me!

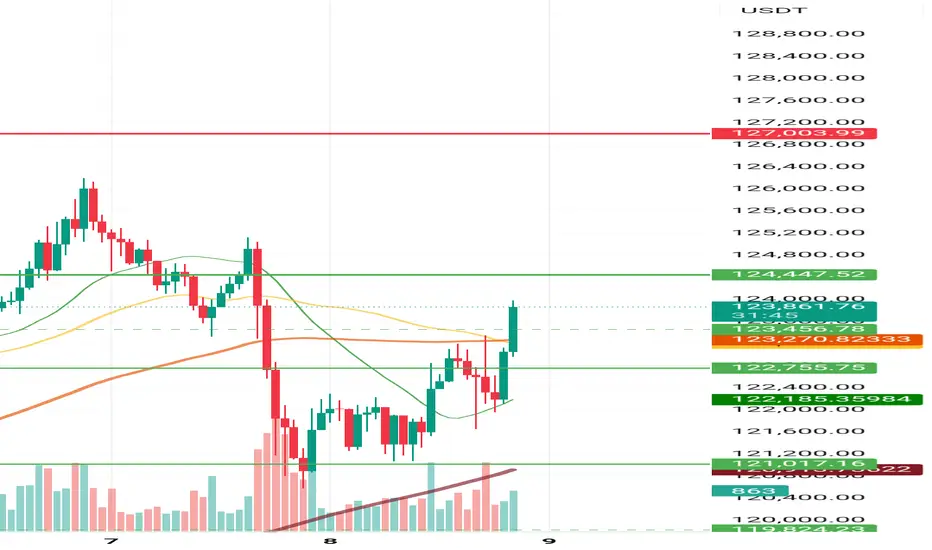
Bitcoin Breaks Through Key Resistance – Eyes on 127K and Beyond
📈 Bitcoin Technical Analysis – Breakout Above Key Resistance Zone
After a healthy correction, Bitcoin found strong support around the 121,000 USDT level, where it formed a solid base and initiated a bullish reversal. This support zone has historically acted as a pivotal level, and the recent reaction confirms its continued relevance.
The price successfully broke through the 122,755–123,000 USDT resistance range, which had previously taken over 34 hours to breach. This time, the breakout was more decisive, backed by a surge in volume and reinforced by the 50-hour and 100-hour moving averages, both converging near the resistance zone and adding to its significance.
🔍 Key Observations:
- Volume Spike: A noticeable increase in trading volume accompanied the breakout, suggesting strong buying interest.
- Trend Line Support: The ascending maroon trend line continues to hold, indicating sustained bullish momentum.
- Moving Averages: The alignment of short- and medium-term MAs below the price adds further confirmation to the breakout.
- Historical Context: The previous struggle to break this resistance highlights the strength of the current move.
🚀 Outlook: With this resistance now flipped into support, we anticipate a more aggressive rally in the coming sessions. The next potential targets lie at 127,000 USDT and 136,000 USDT, which align with previous swing highs and psychological levels.
Traders should watch for consolidation above the breakout zone and monitor volume for signs of continuation. A retest of the 123K level could offer a secondary entry opportunity for those waiting on confirmation.
ETHUSD – 1H | Bullish Reversal from Demand ZoneBITSTAMP:ETHUSD
Structure | Trend | Key Reaction Zones
Market retested the 4,440–4,465 strong demand zone, respecting structure after a deep liquidity sweep.
Overall structure remains bullish, with previous accumulation and breakout zones aligning with channel support.
Market Overview
ETH completed a sharp correction after facing rejection near 4,758 resistance, tapping into the demand base where buyers previously stepped in. With liquidity cleared and demand reaction visible, a bullish continuation is likely if price holds above 4,465.
Key Scenarios
✅ Bullish Case 🚀 →
🎯 Target 1: 4,535
🎯 Target 2: 4,621
🎯 Target 3: 4,672 (major resistance retest)
❌ Bearish Case 📉 →
Invalidation below 4,413 (break of demand zone).
Current Levels to Watch
Resistance 🔴: 4,621 / 4,672
Support 🟢: 4,465 / 4,413
⚠️ Disclaimer: This analysis is for educational purposes only. Not financial advice.

EURUSD 4H: Critical Support Under Fire - Channel at Risk!EURUSD 4H: Critical Support Under Fire - Channel at Risk!
EURUSD has been trading within a well-defined uptrend channel since March but is now experiencing strong bearish pressure, testing critical support.
The pair is currently battling at the "Immediate Daily Support" zone of 1.1500 to 1.1600, a key area that also aligns with the lower boundary of its multi-month channel.
A decisive push greater than 1.1800 is required to re-establish bullish momentum and negate the recent downside.
A sustained break below this immediate support would likely trigger further declines towards 1.1400 and eventually the strong support at 1.1100.
Disclaimer:
The information provided in this chart is for educational and informational purposes only and should not be considered as investment advice. Trading and investing involve substantial risk and are not suitable for every investor. You should carefully consider your financial situation and consult with a financial advisor before making any investment decisions. The creator of this chart does not guarantee any specific outcome or profit and is not responsible for any losses incurred as a result of using this information. Past performance is not indicative of future results. Use this information at your own risk. This chart has been created for my own improvement in Trading and Investment Analysis. Please do your own analysis before any investments.

Very rare diamond patternThis very rare pattern usually indicates a change of trend. Is doing it in the weekly timeframe and setting up for a massive breakout of the descending channel. Also, oil is setting up an inverse HS and many of the big oil companies show bullish patterns. SL and TP are shown on the charts.
Good luck.

ETH: 4500 - The Crucial Flip
ETH: 4500 - The Crucial Flip
Ethereum (ETHUSD) on the 4-hour timeframe is currently undergoing a retracement from recent highs, testing the crucial "4500 Flip Zone" and the dynamic ascending trendline, with price at ap-proximately 4,476.
Bullish Scenario: A successful defense of the "4500 Flip Zone" and the trendline, leading to a bounce, would indicate a continuation of the upward trend, targeting the 4650 resistance and subsequently the "4800 to 4900 Sell Order Block."
Bearish Scenario (Immediate): Conversely, a confirmed breach and sustained trading below the "4500 Flip Zone" and the trendline would signal a weakening of the bullish structure, likely leading to a retest of the "4200 to 4300 Key Level."
Bearish Scenario (Deeper): Should the "4200 to 4300 Key Level" fail to hold, deeper support levels at "4000" would become the next significant areas to watch for potential buying interest.
Disclaimer:
The information provided in this chart is for educational and informational purposes only and should not be considered as investment advice. Trading and investing involve substantial risk and are not suitable for every investor. You should carefully consider your financial situation and consult with a financial advisor before making any investment decisions. The creator of this chart does not guarantee any specific outcome or profit and is not responsible for any losses incurred as a result of using this information. Past performance is not indicative of future results. Use this information at your own risk. This chart has been created for my own improvement in Trading and Investment Analysis. Please do your own analysis before any investments.

BTCUSD: Navigating the 123K ZoneBTCUSD: Navigating the 123K Zone
Bitcoin (BTCUSD) on the 4-hour timeframe has experienced a recent pullback, currently trading around 122K, and is encountering resistance at the "123K" zone within its ascending channel.
Renewed bullish momentum is contingent on a decisive breakout and sustained trading above the "123K" resistance, targeting the "126.5K ATH" with close monitoring of price action near "125K."
Immediate downside protection is provided by the "120K-121K Immediate Support" area, which is vital for maintaining the short-term uptrend and preventing deeper corrections within the channel.
Should immediate support fail, the "118K to 119K - Previous Breakout" level is anticipated to offer robust support, with "115K Good Support" and the "112K-113K Important Level" underlying the broader bullish structure.
Disclaimer:
The information provided in this chart is for educational and informational purposes only and should not be considered as investment advice. Trading and investing involve substantial risk and are not suitable for every investor. You should carefully consider your financial situation and consult with a financial advisor before making any investment decisions. The creator of this chart does not guarantee any specific outcome or profit and is not responsible for any losses incurred as a result of using this information. Past performance is not indicative of future results. Use this information at your own risk. This chart has been created for my own improvement in Trading and Investment Analysis. Please do your own analysis before any investments.

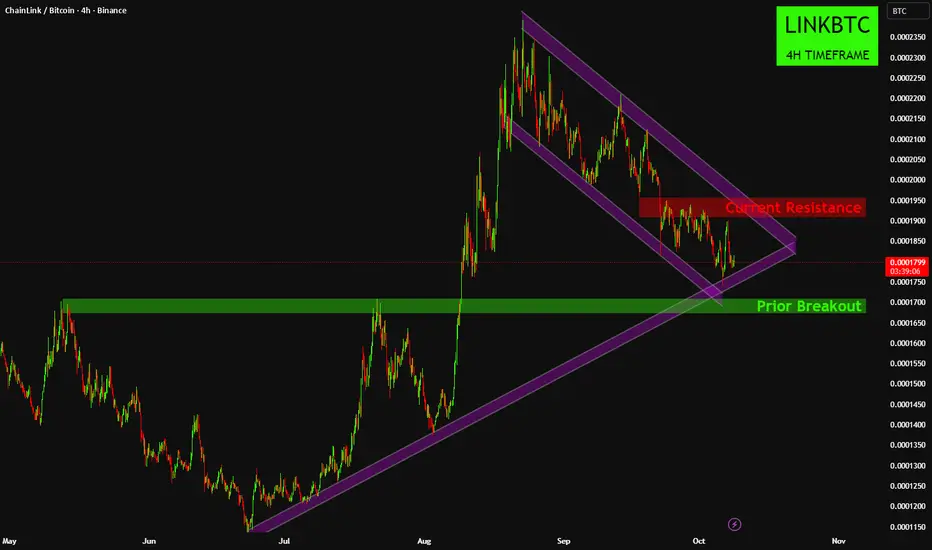
LINKBTC: Support or Bust?LINKBTC: Support or Bust?
ChainLink (LINKBTC) on the Daily timeframe is currently undergoing consolidation within a "Descending Channel" after a significant "Prior Breakout," with the price at approximately 0.0001802.
Bullish Scenario: The price is currently testing a crucial confluence of support, including the lower trendline of the "Descending Channel" and a longer-term ascending trendline, aligning with the "Prior Breakout" zone; a successful defense here could lead to a retest of the "Current Resistance" around 0.0001900-0.0001950.
Bearish Scenario (Immediate): Conversely, a confirmed breach and sustained trading below the converging support of the "Descending Channel's" lower trendline and the underlying long-term ascending trendline would signal a significant weakening of the bullish structure.
Bearish Scenario (Deeper): Should the "Prior Breakout" zone (green area) fail to hold as support after such a breakdown, it would imply a deeper retracement and a potential reversal of the prior uptrend, negating the bullish momentum from the earlier breakout.
Disclaimer:
The information provided in this chart is for educational and informational purposes only and should not be considered as investment advice. Trading and investing involve substantial risk and are not suitable for every investor. You should carefully consider your financial situation and consult with a financial advisor before making any investment decisions. The creator of this chart does not guarantee any specific outcome or profit and is not responsible for any losses incurred as a result of using this information. Past performance is not indicative of future results. Use this information at your own risk. This chart has been created for my own improvement in Trading and Investment Analysis. Please do your own analysis before any investments.
4050-4030 oscillation, bullish trend remains the main trendGold is currently still in a bullish upward trend. Our core trading strategy remains unchanged, and the key points I reminded you of earlier this morning must be carefully considered. Judging from the trend, gold in the US market is basically oscillating back and forth in the range of 4050-4030. I mentioned before that gold has repeatedly tested 4030. Once it falls below, gold may test the support range of 4020-4010 below in the US market. This has been marked in the chart. I believe brothers can see it very clearly. At the same time, we should still take precautions on the upside. As time goes by, we can pay moderate attention to the short-term channel pressure around 4065. Once gold stabilizes above 4050, it will definitely touch around 4065. On the downside, we continue to monitor a break of 4030. If, while waiting for gold to fall back to the support range, it first rises and hits the channel resistance, you can retest gold shorts based on market trends. If you have any questions, you can leave me a message for help. If you think Allen's analysis is helpful to you, you can give it some encouragement by clicking the like button.

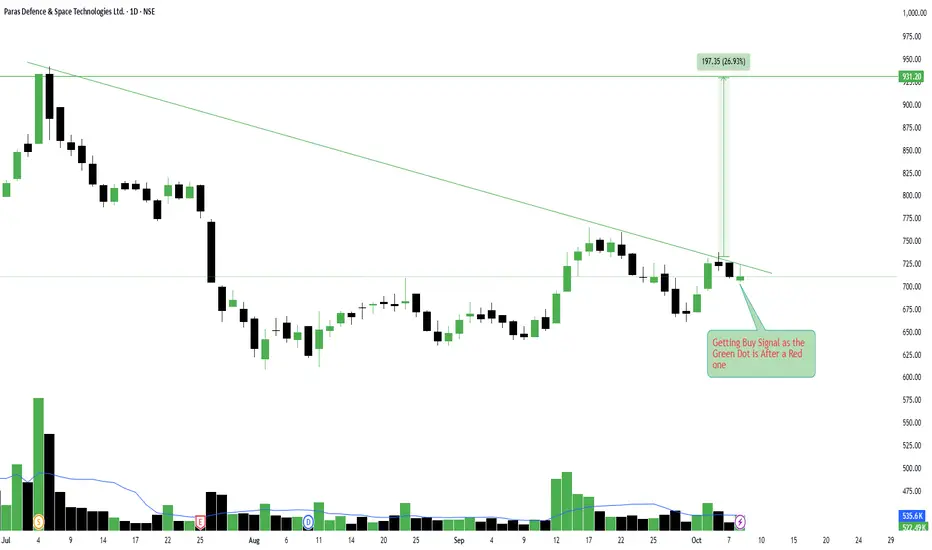
Paras Defence & Space Technologies – Early Buy Signal AppearsParas Defence & Space Technologies – Early Buy Signal Appears
#PARASDEFENCE
📈Pattern & Setup:
Paras Defence is flashing an early buy signal as the green dot (buy confirmation) appears right after a red one (sell exhaustion), suggesting momentum reversal might be starting.
Price has been consolidating tightly near the descending trendline, and now buyers seem to be stepping in around the 700 zone. This structure is forming a potential descending trendline breakout setup with bullish volume starting to reappear.
Once the stock manages to sustain above 725–730, we can expect strong follow-through buying that could drive prices toward 900+ levels in the coming weeks.
📝 Trade Plan:
Entry: Above 725 on breakout confirmation.
🚩Stop-Loss: 680 (below the recent swing low).
🎯Targets:
Target 1 → 810 (short-term).
Target 2 → 930 (measured move target, ~27% potential).
💡Pyramiding Strategy:
1. Enter partial position near 725 breakout level.
2. Add on strength once price sustains above 750 with rising volume.
3. Trail stop-loss to 705 once price crosses 770.
🧠Logic Behind Selecting this Trade:
The buy signal right after a red exhaustion dot usually indicates a shift in sentiment. Combined with the descending trendline resistance being tested again and a pickup in volume, this looks like a low-risk early entry before breakout confirmation.
Keep Learning. Keep Earning.
Let’s grow together 📚🎯
🔴Disclaimer:
This analysis is for educational purposes only. Not a buy/sell recommendation. Please consult your financial advisor before trading.
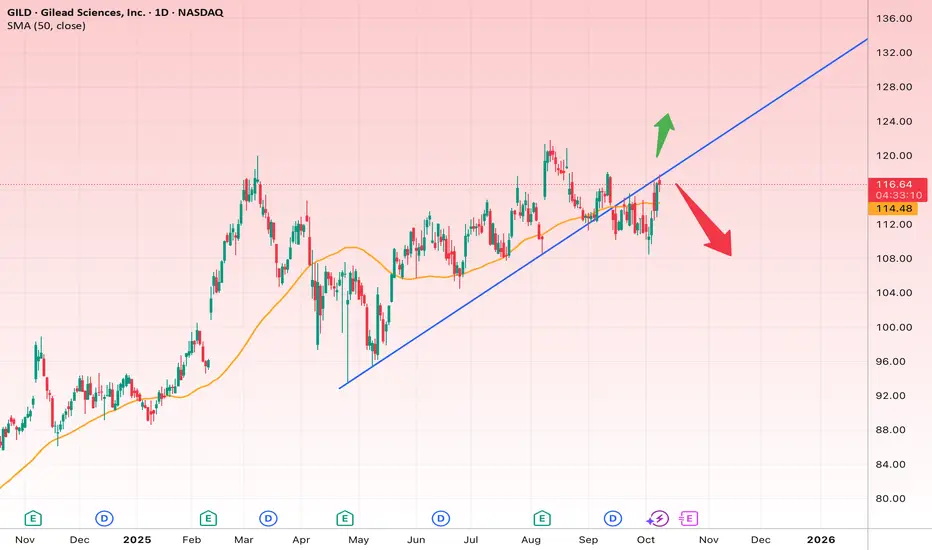
Gilead’s Critical Battle at the Uptrend Line!
Analysis:
The daily chart of Gilead Sciences (GILD) shows that the stock, after a short-term correction, is once again approaching its main uptrend line (blue). The 50-day moving average (orange) around $114.50 acts as a key support level, and the current price is trading slightly above it.
At this stage, the stock sits at a decisive point — it could either reclaim its bullish momentum by breaking above resistance or enter a deeper corrective phase if support fails.
Short-term outlook (2–4 weeks):
If the price manages to hold above $118, the next upside targets are in the $119.80–$124.80 range. This area represents the short-term bullish objective.
A reasonable stop loss for this scenario is just below $114.
Long-term outlook (2–3 months):
If the stock breaks decisively above $125 and maintains that momentum, the next major targets would be in the $130–$134 range, which also aligns with the previous highs.
However, if the blue uptrend line breaks down and a daily candle closes below $113, a bearish move toward the $106–$108 range becomes likely. In that bearish scenario, the stop loss should be placed above $113.
Overall, GILD is at a decision point. As long as it trades above $114, the bullish outlook remains valid — but losing that support could shift the balance in favor of the bears.
Bitcoin 119K & 116K will pump it above $130000As we can see price is still bounded with range zone and previous breakout was fake and still 126K$ and 125K$ holding strong but soon from the mentioned support we can expect heavy pump and new ATH above 127K$ or 132K$.
DISCLAIMER: ((trade based on your own decision))
<<press like👍 if you enjoy💚

ETH Second retest completed soon above 5.5KThe major resistance which was red trendline broke successfully and now price did complete retest there and soon we can expect more gain and rise here to the 5500$ at least and even 7000$.
DISCLAIMER: ((trade based on your own decision))
<<press like👍 if you enjoy💚

BABYDOGE 100% gain coomingsoon we can expect some gain and pump at least like green arrows after a while that we had dead market and dump here and our first target is at least +100% gain.
DISCLAIMER: ((trade based on your own decision))
<<press like👍 if you enjoy💚

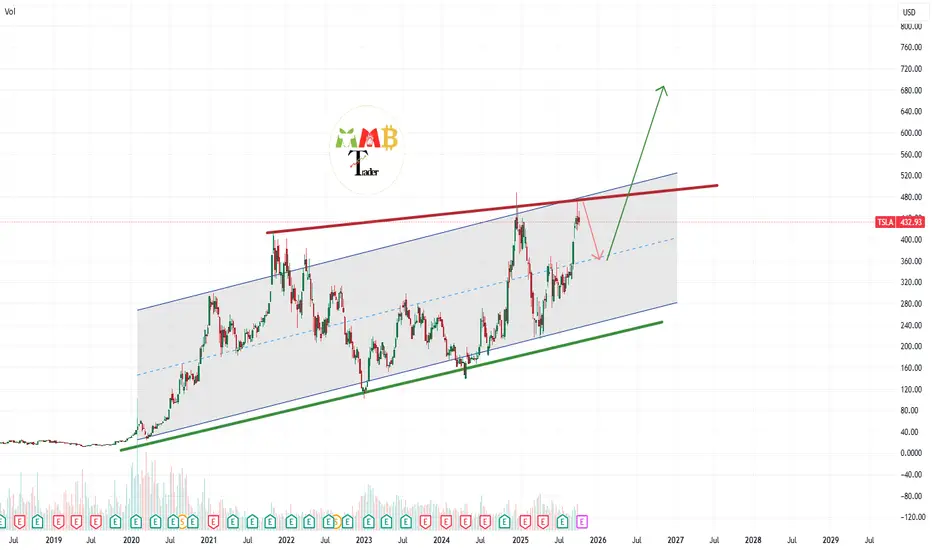
TSLA maybe retest support near 360$ but target is 700$Price is near channel resistance and red trendline sell pressure zone so we can expect short-term fall here like the red arrow but soon after that short-term fall we can expect heavy gain here like the green arrow on chart and targets like 600$ and more also if the red trendline break valid to the upside without that correction target can hit.
DISCLAIMER: ((trade based on your own decision))
<<press like👍 if you enjoy💚