100k Gann Box0-100K, 100k-200k, 200k-300k etc...
Both the red and blue highlighters are expected minimums for a completed ABC corrective wave, leaving an anticipated 5 wave move higher to follow.
Dashed lines are simple trend lines from the waves (placed from waves 0-2 and 1-3).
Trend Lines

SHIBUSDT the massive pump is ahead SHIBUSDT is currently testing a critical weekly support level. A strong defense of this zone could potentially catalyze a technical rebound. The subsequent price trajectory would depend on consecutive breakouts above two significant descending trendlines that have contained previous rallies. Each confirmed breakout would represent a key technical milestone, potentially unlocking further upward targets as market structure progressively strengthens.
DISCLAIMER: ((trade based on your own decision))
<<press like👍 if you enjoy💚

GOLD dump is just started Gold has decisively broken below its key bullish trendline on the daily timeframe and has now completed a retest of this level as new resistance. This technical development suggests a potential shift in momentum, indicating that a corrective phase may be underway. Should this bearish structure hold, we could see a downward move toward initial technical targets around the $3,700 level, which represents the next significant support zone.
DISCLAIMER: ((trade based on your own decision))
<<press like👍 if you enjoy💚
Long term channel of channelsIt's worth a reminder of the fact that Bitcoin has not had a weekly close below this channel since March 2013.
What to make of that? Interpretations abound, but my own take leans towards maybe an attempt to get back in before rejection, or simply a continuation of the decline that could conceivably reach the mid $20k range, with the $54k range another potential floor for the beginning of a new accumulation stage.
If it does make an attempt to get back above the trendline, that will be the area to watch for resistance.

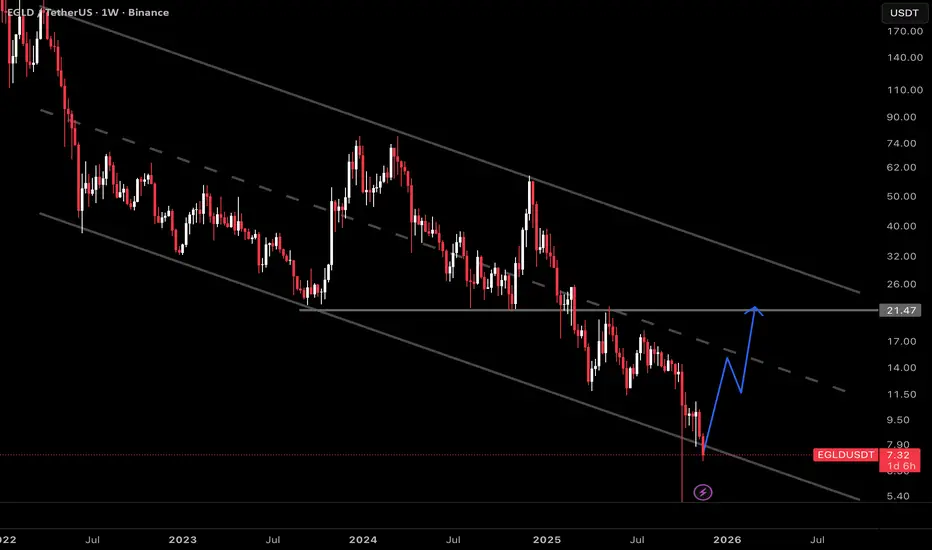
EGLD Descending ChannelThe price action for EGLD is in a well-defined descending channel since early 2022, mapping out lower highs and lower lows as the asset retraced from its previous bull market peak.
Whenever EGLD reached the lower part of its descending channel, price has historically tended to reverse upward, offering short-lived relief rallies.
This setup remains highly speculative and should be approached with caution. The downtrend has repeatedly disappointed, with many previous bounces failing to deliver sustained upside or meaningful trend changes. For this reason, any trades initiated at the channel lows are best sized conservatively, allocate only a small portion of capital.
The $21 level represents a significant resistance for EGLD, if price approaches $21 during a reversal, taking profit will be a good idea.
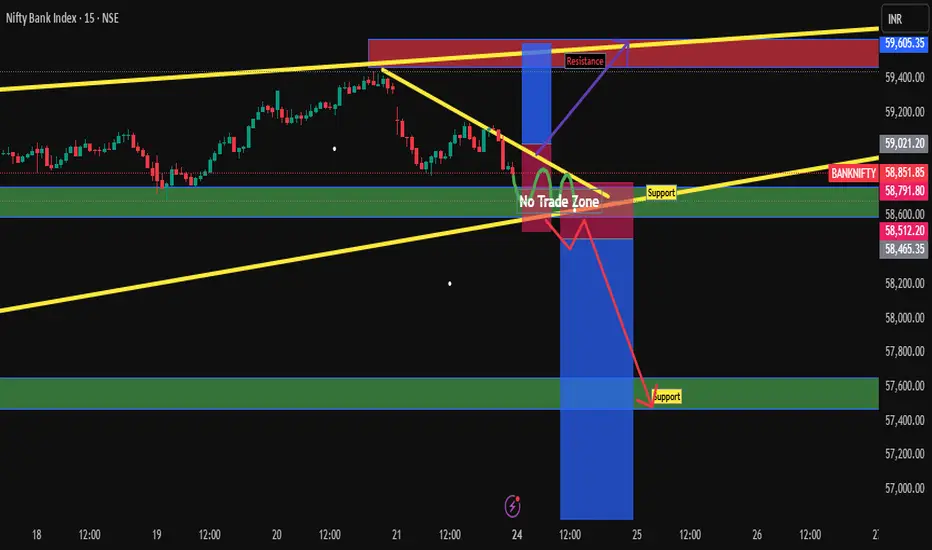
Banknifty Intraday Levels : 24-Nov-25Banknifty closed near the support level of trendline and Support Zone sustain above the zone upside move and if break will expect downfall
Bearish < 58500
Bullish > 59000
Wait for Proper Rejection/Pattern :
Support : Bullish
Resistance : Bearish
Use Sl Trailing to reduce Risk
*All views for educational purpose only
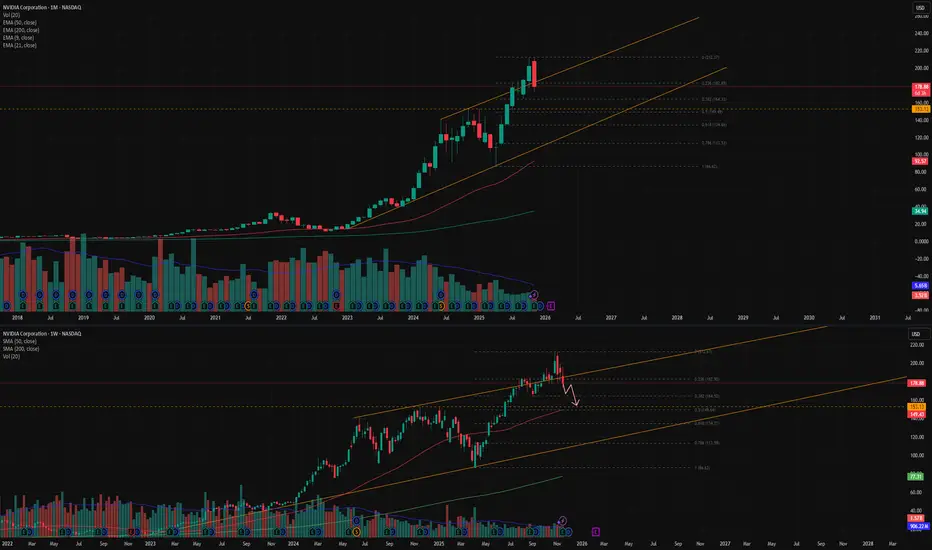
NVDA ALERT: Critical Drop AheadNvidia remains in a broader uptrend, but the chart shows a clear trendline breakout followed by the beginning of a pullback.
Using Fibonacci, a correction typically starts after a red candle forms following a sequence of green candles. In most cases, the pullback continues toward the 0.5 retracement level. In this setup, the 0.5 level aligns with a major key support, increasing its importance.
On the weekly timeframe, the 50 EMA is also converging at the same zone, which often acts like a magnet for price. This creates multiple confirmations pointing toward a potential move downward.
The weekly chart has printed a bearish engulfing , followed by three consecutive red candles, adding another strong confirmation for a continued correction.
Both MACD and RSI are sloping downward, supporting the bearish momentum.
If price reaches the expected zone, monitoring the reaction will be critical. A deeper decline into the global trendline is possible only if the key level is broken, though this scenario appears less likely.
Overall, NVDA shows several aligned signals indicating a move toward the correction zone before any potential recovery.
Why 90% of Traders Blow Their Account?-And How to NEVER Be One!What is Risk Management? ⚠️
In trading, it means evaluating, measuring, and reducing potential losses , while capital management focuses on preserving and growing your capital. The main goal is to ensure that even if several trades turn out to be losers, your entire account doesn't get wiped out. For example, always ask yourself before entering a trade: "How much am I willing to lose?" ❓ This helps maintain your trading psychology 🧠 and prevents emotional decisions 🚫.
Practical Risk Management Techniques:
Using Stop-Loss and Take-Profit : Always set a stop-loss 🛑 so the trade closes automatically if the market moves against you. Also, use trailing stops to adjust the stop as the market moves in your favor and lock in more profits 💹.
Position Sizing : Never risk more than 1-2% of your total capital on a single trade. For example, if your account is $10,000, risk a maximum of $100-200 💸. This is called the "2% rule" and helps keep your capital safe even after several consecutive losses 🔄.
Risk-Reward Ratio : Always aim for at least 1:2 – meaning for every 1 unit of risk, target 2 units of potential reward. For example, if you risk $100, aim for at least $200 in profit. This way, even if only 50% of your trades win 🏆, you'll still come out profitable overall.
Diversification : Spread your capital across different markets (like forex, crypto, and stocks) to ensure that risk in one market doesn't impact everything else. For example, allocate 30% to stocks 📊, 40% to forex 💱, and 30% to crypto 🪙.
⚠️This post is for educational purposes only.⚠️
What’s YOUR biggest risk management rule? Drop it in the comments!👇

Nifty Intraday Levels : 24-Nov-25Nifty closed near the support level of trendline and Support Zone sustain above the zone upside move and if break will expect downfall
Bearish < 26020
Bullish > 26130
Wait for Proper Rejection/Pattern :
Support : Bullish
Resistance : Bearish
Use Sl Trailing to reduce Risk
*All views for educational purpose only

BTCUSDT Market Analysis UpdateHi everyone, I hope you are doing well and I have put my opinion in Bitcoin price on the chart for you. and hope this helps you! Simple, concise, useful
BTC is still trading within a clear bullish market structure, supported by strong HL formations and trendline confluence. At the moment, my main focus is on the Fair Value Gap (FVG) below current price. I expect BTC to revisit this imbalance before continuing the move upward.
The liquidity pool around 82,490 is also important. Personally, I don’t expect price to sweep that level immediately. However, if it does get taken, in my view it would likely serve as the final liquidity grab before resuming the broader uptrend. This makes 82,490 a key level to watch — either it remains untouched while we push higher, or if price sweeps it, the move could act as fuel for the next bullish leg.
From a higher timeframe perspective, the market remains bullish. The structure is intact, RSI is holding mid-range without major bearish divergence, and trendline support has not been broken. Volume also supports this idea — it’s decreasing and showing divergence, but this doesn’t signal a reversal, only a healthy consolidation while holding the bullish trend.
In summary:
Main target: fill the nearby FVG before continuation.
Key liquidity zone: 82,490 (less likely to be taken now, but if it happens, I consider it the last liquidity grab).
Bias: still bullish, expecting higher levels once short-term imbalances are resolved.
Weekly:
As long as BTC holds its HLs and respect the FVG zone, I continue to look for upside continuation — potentially well beyond current levels.
That’s my current view on BTC. Let me know your opinion below 👇
Best regards

TAO - Bearish structure GETTEX:TAO - update:
Im also bearish here 📉 - Bearish channel
Support looks weak, buy pressure is absent.
Monthly view looks pretty scary, and lower Key demand zone might be visited again 📉
Medium term: 210$ - 205$ support likely 🎯
Key resistances :
295 - 310 - 340 - 460 - 510

USDJPY Potential DownsidesHey Traders, in today's trading session we are monitoring USDJPY for a selling opportunity around 156.700 zone, USDJPY is trading in a downtrend and currently is in a correction phase in which it is approaching the trend at 156.700 support and resistance area.
Trade safe, Joe.

GBPUSD: Important Supply Zone Ahead 🇬🇧🇺🇸
There is a high probability that GBPUSD will drop
from the underlined supply zones based on a recently
broken daily support and a falling trend line.
Expect a down movement at least to 1.3024
❤️Please, support my work with like, thank you!❤️
I am part of Trade Nation's Influencer program and receive a monthly fee for using their TradingView charts in my analysis.

Don't Trade These Trend Lines. Forex Gold Trading Basics
A lot of traders apply trend lines for trading and making predictions on different financial markets.
Trend line can also be an important element of price action patterns.
However, only few knows that some trend lines are better to be avoided .
In this article, I will share with you the types of trend lines that you should avoid and not rely on for making trading decisions.
Invalidated Trend Line
Even the strongest trend lines may lose their significance with time.
Before you take a trade from a trend line, make sure that it still remains valid.
If the trend line is not respected by the buyers and then by the sellers,
or by the sellers and then by the buyers, we say that such a trend line lost its significance, and it is better to not trade it.
Have a look at that rising trend line on USDCAD.
We see strong bullish reactions to that, and we may expect a bullish movement from that, once it is tested.
However, it was violated and after a breakout it should turn into a vertical resistance.
Retesting that, the price easily went through the broken trend line.
The trend line lost its significance, and it is better to not trade that in the future.
2 Touches Based Trend Line
When you are looking for a strong trend line to trade, remember that the trend line should be confirmed by at least 3 touches and 3 consequent bullish / bearish reactions to that.
Above is the example of a valid and reliable trend line.
However, quite often, newbie trade 2 touches based trend lines.
Most of the time, such trend lines are neglected by the market.
Moreover, relying on 2-touches-based trend lines, your chart will look like a complete mess .
Simply because there are too many trend line meeting that criteria.
Receding trend line
There are the trend lines that go against your trade with time while remaining valid.
Have a look at a major falling trend line on NZDCHF on a daily time frame.
You may open a swing long position from that on a daily or a day trade on intraday time frames like an hourly.
You can see that the market may easily go against your predictions for a long time, while perfectly respecting a trend line.
The price was sliding on that trend line for 6 consequent days before it finally started to grow.
Such trend lines are better to be avoided .
Make sure that a trend line and your trade have the same direction.
Trend lines can provide very safe points for trading entries. However, the trend lines are not equal and while some of them can be very profitable, some of them can lead to substantial losses.
❤️Please, support my work with like, thank you!❤️
I am part of Trade Nation's Influencer program and receive a monthly fee for using their TradingView charts in my analysis.

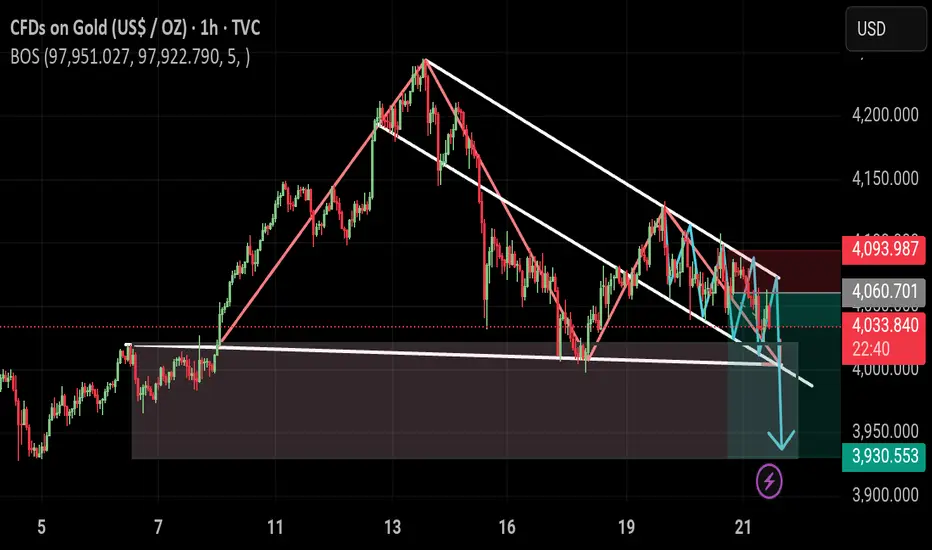
TECHNICAL ANALYSIS OF GOLD FOR SHORT OPPORTUNITY
📈 Gold Technical Analysis (1h Chart)
The chart shows a distinct price pattern and a potential trading setup following a significant rally.
Key Observations
Prior Movement: The price made a sharp upward move, peaking around $4,200 (on November 13th), followed by a clear downtrend.
Correction/Pattern: Since the peak, the price action has formed a Descending Channel (or potential Bear Flag) indicated by the two parallel white trendlines. This suggests a corrective phase after the initial rally.
Support Zone: There is a significant Horizontal Support Zone highlighted by the shaded brown rectangle, roughly between $3,950 and $4,000, which corresponds to a previous area of consolidation/resistance (around November 7th-9th) that was broken to the upside. The price has recently tested the upper boundary of this zone.
Recent Action: The price is currently near the lower boundary of the descending channel and appears to be testing both the channel support and the upper boundary of the horizontal support zone.
Trading Setup
The chart features an active Short (Sell) setup, indicating a bearish bias:
Entry Price: $4,060.701 (The price is currently $4,035.592, suggesting the entry was taken earlier or the current price is the market price).
Stop Loss (Red Area): Set at $4,093.987. This is placed just above the recent swing high within the descending channel, protecting against a bullish breakout.
Take Profit (Green/Teal Area): Set at $3,930.553. This target aims for a move that breaks below the horizontal support zone and potentially reaches the prior consolidation lows.
Risk/Reward Ratio: The size of the red box (risk) versus the size of the teal box (reward) suggests a favorable risk/reward ratio for this trade.
Conclusion
The overall pattern suggests that Gold is undergoing a healthy correction within a descending channel. The active trade is betting on a breakout below the channel and the key horizontal support zone ($3,950 - $4,000) to confirm a deeper correction. If the price fails to break lower and instead breaks above the descending channel, the short position would be stopped out, potentially signaling a continuation of the prior uptrend.
Would you like a summary of the next most likely price movements based on this pattern?
BTCUSDT DAILY VOLUME ANALYSISLet’s get straight to discussing BTCUSDT, which is once again being talked about a lot — where is BTCUSDT heading?
My assumption: it’s still BULLISH.
Why? It’s still above the green trendline I drew, and buyers are still dominating.
Also, I’ve drawn many green and red circles — Green = Bullish Volume, Red = Bearish Volume.
Take a look!
That’s all for my explanation. Right now, BTCUSDT seems to be getting ready to reach a new ATH (All-Time High).
By the way, only 2 months left in 2025!! Keep up the spirit!
Remember: crypto — do your own research
and money management first

BTCUSDT DAILY ANALYSIS📌 1. Main Condition of BTCUSD Daily
From the chart, it is clear that:
➤ BTC is currently in a strong corrective phase (strong downtrend).
The daily resistance trendline (red) is very dominant.
The weekly support trendline (purple) has already broken → a clear signal of structural weakness.
Price is now sitting right inside the Demand OB + High Volume Support zone (green area).
This is a logical zone for a buy reaction or relief bounce.
📌 2. Current Price Action
➤ Yesterday’s volume was extremely high.
High volume occurring as price hits a demand zone typically indicates one of two possibilities:
Seller absorption by large buyers → potential reversal/bounce.
Capitulation → final sell-off before sideways or reversal.
Based on the candlestick:
Yesterday’s candle shows a long lower wick, indicating buyers reacted strongly to demand.
But the candle closed red → buyers are not fully in control yet.
So, there is a reaction — but not yet a valid signal for a mid-term reversal.
📌 3. Should You Wait for a Bullish Engulfing?
I recommend:
✅ Yes — wait for a Bullish Engulfing or Strong Reversal Candle.
Because:
Market structure is still bearish (lower low – lower high).
A bullish engulfing inside a demand zone confirms buyers have taken over.
Volume is present → we only need a confirmation candle.
Bullish engulfing inside demand + strong volume = high-probability entry.
📌 4. Will BTC Consolidate?
After such a sharp decline, BTC often:
➤ Consolidates inside the demand zone before deciding the next direction.
This is supported by:
Long lower wick
Extreme volume spike
Price already far from the resistance trendline
Price sitting in major demand OB
Most likely scenario:
BTC will enter a ranging / sideways phase for a few days before breaking up or down.
📌 5. Key Levels
Major Support
$82,000 – $78,000 = demand + high-volume node
If this breaks → next target $73,500, or even $68,000 (long green trendline below).
Closest Resistance
$90,000 – $92,000 = supply retest + broken structure
If price breaks above → potential move toward $96,000.

From Shutdown Relief to AI Anxiety — Two Narratives Driving ESMarket Theme
The week began on a strong footing, driven by a bullish Sunday reopen in ES after news broke that the 43-day government shutdown was set to end, following the Senate’s late-night support for a potential agreement on November 9th. This relief catalyst created early upside momentum, pushing the index toward all-time highs (ATHs).
However, the tone shifted mid-week. The rally lost steam as markets refocused on a growing concern: the sustainability of current Tech and AI valuations. Investors are becoming more sensitive to the possibility of overstretched AI-related capital expenditure and an emerging bubble narrative, especially with heavyweight earnings and forward-guidance looming. This led to a rotation out of high-beta tech and into safer or less-extended sectors.
On the macro front, Fed speakers adopted a more cautious—if not outright hawkish—tone, emphasizing that a December rate cut is far from assured. The recent government shutdown created a backlog in key economic data releases, leaving policymakers and traders alike without clear visibility into the true state of the economy. The lack of data has amplified uncertainty and reduced the market’s conviction around the timing of any potential policy easing.
In short:
The market is caught between two opposing forces:
The optimistic narrative (shutdown resolved, path to ATHs, resilience in U.S. growth), and
The risk narrative (valuation excess, policy uncertainty, narrowing breadth).
This push-pull dynamic has resulted in compression rather than continuation, with a heavy focus on clarity from upcoming data and major earnings.
What is the Market Doing?
Last week formed an inside week, with the entire range trading within the prior week’s range and settling close to the previous week’s close. This signals indecision and balance, as neither buyers nor sellers had the conviction to push the market into expansion.
Current price action shows the market compressing between:
6875 — previous week’s VPOC / 27 Oct weekly VAL
6740— 13 Oct weekly VAH / 10 Nov weekly volume ledge
These levels are well-defined and respected. The upward trendline continues to hold, with multiple strong rejections signaling responsive buyers stepping in to bid prices back up.
The battle is now between buyers attempting to defend 6740 area which is also confluent with the daily trendline support, and sellers leaning on the overhead resistance close to 6875.
What to Expect in the Coming Week
The key line in the sand (LIS) this week:
→ 6755.25 — Previous week's settlement
Bullish Scenario
If 6755 holds as support, expect buyers to attempt a push toward:
6874.50 — previous week's VPOC
6905.5— weekly 1-SD volatility high
Anticipate responsive sellers in this area.
However, if price breaks above 6874.50 with pace and volume and accepts above it, the path opens for a retest of the ATHs as momentum players and trapped shorts fuel continuation.
Bearish Scenario
If the market accepts below 6755 and fails to reclaim it on any pullback:
First downside target: 6660 — 13 Oct weekly VAL
If buyers fail to respond there, expect an acceleration lower from long liquidation toward:
6605— weekly 1-SD volatility low
6504 — previous month's low (deeper target)
This scenario strengthens if the trendline breaks and sellers begin stepping down aggressively.
Neutral / Compression Scenario
If the market remains trapped between 6875 and 6740 with no breakout supported by pace and volume:
Expect two-way rotational trade
Continued compression and balance within the well-defined range
A buildup of energy that may resolve later in the week with data, earnings or fundamental catalysts
Conclusion
As we start the new week, ES remains tightly coiled between well-defined levels, with the market waiting for clarity from data, earnings, and policy signals. Whether we break from compression or continue to balance, the key will be how buyers and sellers respond around 6755 and whether there are new fundamental catalysts.
As always, I’d love to hear your view on the markets and ES this week? — Drop it below — and give it a boost so more of the community can join the conversation.
Glossary Index for all technical terms used:
VAH (Value Area High)
VAL (Value Area Low)
VPOC (Volume Point of Control)
SD (Standard Deviation)

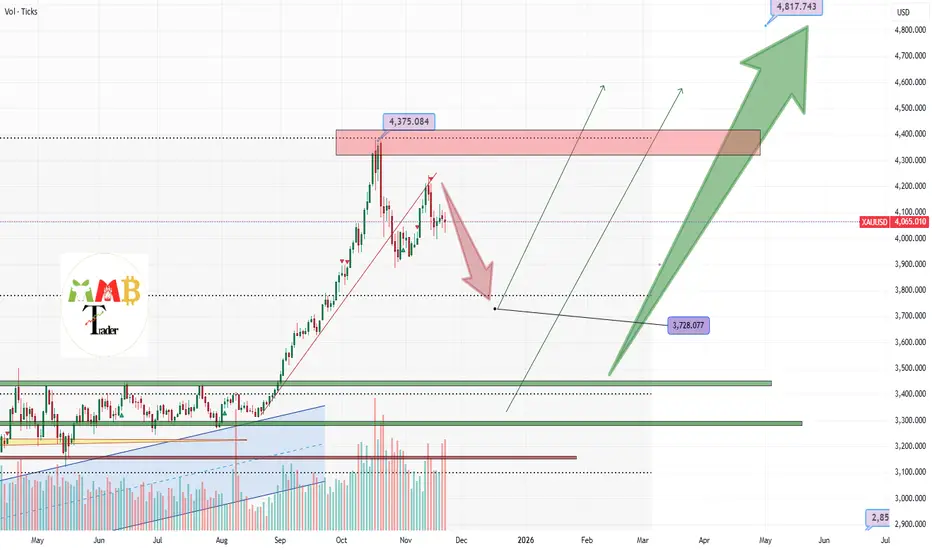
Gold rebound presents an opportunity,Why wait and do nothing?Following the release of supplementary US non-farm payroll data for September, the relatively strong job growth coupled with a resurgence in the unemployment rate has once again created a contradictory situation in the market. This has also led to growing disagreement within the Federal Reserve regarding whether to continue cutting interest rates in December. Judging from the recent tone of Fed officials' speeches, most officials lean towards a conservative and cautious approach, believing that maintaining the current interest rate is appropriate. The recent performance of the US dollar index best illustrates this point, putting significant pressure on gold, which has repeatedly weakened. However, there is clear buying interest at lower levels, with each sell-off followed by a rapid rebound, though the momentum has been weak. Intraday, gold retraced to around 4060, quickly rebounded to around 4080, and then fell back again. During the European session, it broke below the key short-term support around 4040, accelerating its decline and briefly touching around 4022. It then fluctuated before gradually stabilizing around 4030. Currently, the US session has seen another rapid rebound, mirroring yesterday's pattern. The recommended strategy is to look for opportunities to short after rallies. The short-term tone is set, and market sentiment is destined to be weak; at least avoid excessive shorting at lower levels.
Gold Trading Strategy: Sell gold in batches around 4080-4100, with a target of 4060-4030.
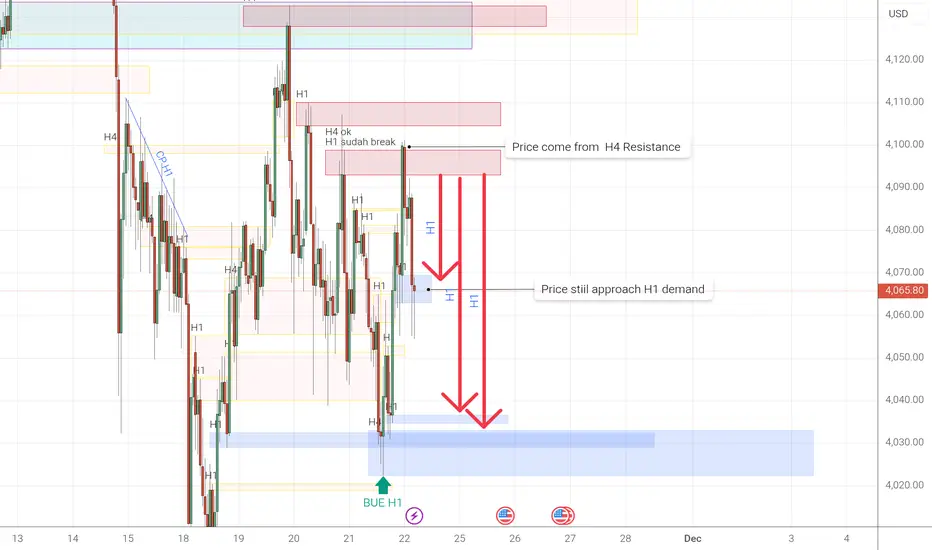
XAUUSD high timeframe November 2025 This analysis come from daily rejection and make demand
From my analyst price will test support and come down
Be careful I can't 💯 right. Just analysis and scratch draw. Only market can right 💯

XAUUSD MOVEMENT in low timeframe November 2025 Week 5This chart for our analysis
Price come from H4 Resistance and will test support H1 my analyst just direction maybe occur during next open market
Trade with klinikfx
Be careful this is just idea. I can't 💯 right, only market just have 💯 right. Like a woman cheers 🍾🥂
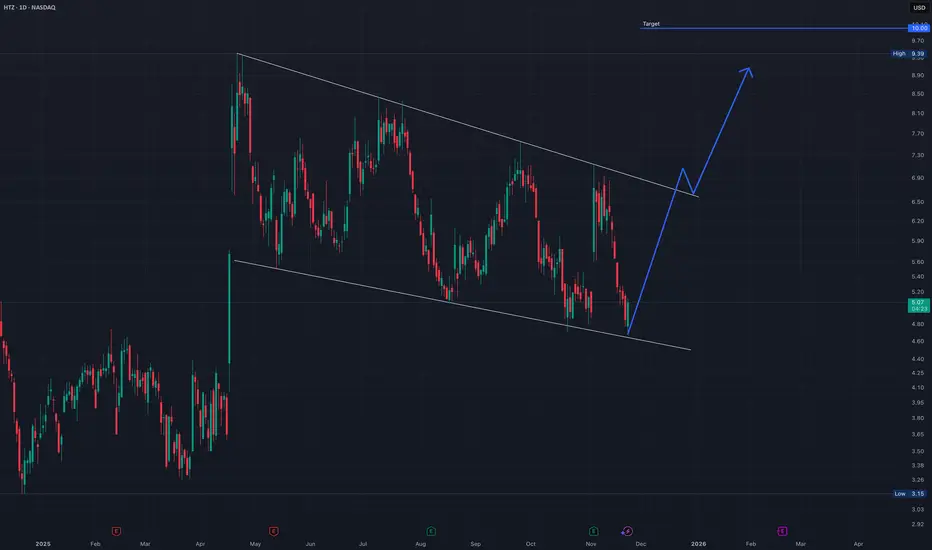
HTZ | Falling Wedge Reversal Setup - Breakout Toward $10Hertz Global Holdings (HTZ) is currently trading at the lower boundary of a well-defined falling wedge pattern, a structure that often signals a potential bullish reversal. The price has once again touched the wedge’s support line, showing early signs of reacting from this level. This repeated defense of support suggests that sellers may be losing momentum as the range continues to narrow.
If HTZ maintains support at this lower trendline and begins to push higher, the next key level to monitor is the upper wedge resistance. A confirmed breakout above that level may trigger a shift in trend, opening room for a measured move toward the $10 target area, which aligns with previous highs and the projected wedge breakout objective.
While the trend is still technically down, the structure of the wedge combined with the current bounce setup provides a constructive environment for a possible reversal. Confirmation and healthy volume on the breakout will be essential to validate the move.
(This idea is for educational purposes only, not financial advice.)
Unpopular Bitcoin Perspective - We Topped $BTCJust following the general cycles here. Rising wedges each time and when they break (which coincides with the cycle), BTC decreases -74% on average. This time is no different.
Pay special attention to the peak-to-peak trendlines along with divergent Price/RSI.
CRYPTOCAP:BTC
BITSTAMP:BTCUSD
