$BRENT technicals in convegence between Fibonacci and TrendlineBLACKBULL:BRENT has been on a downtrend since last Summer...
Now the descending trend line is about to hit the bottom of the Fibonacci Retracement Levels.
This forms a triangle that we know can break either upward or downward - place your entry points and Stop-Loss points accordingly.
While I don't provide Fundamentals analysis, the latest turns of events with USA and Venezuela make me lean towards a break on the downside for more supply of Crude Oil available to the US.
Trendlineanalysis

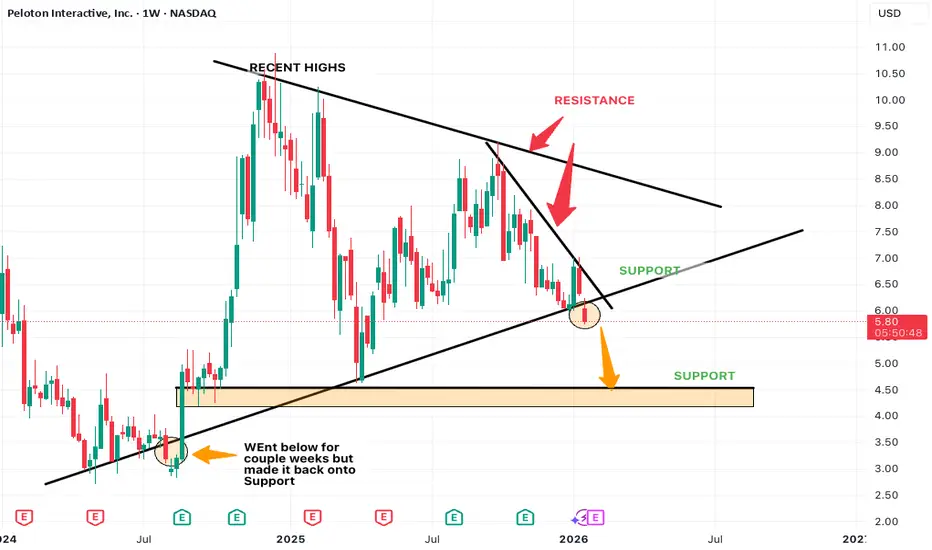
Peloton's test of Major Supportline, macro implicationsPeloton on 1 Week timeframe warrants observation and attention.
Price action after recent declines have reached a critical Support level that dates back to April 2024. This Support trendline has helped with Pelotons move to its recent highs of roughly $10.50.
But Resistance and Selloff has pushed us down to this Support line.
This weeks candle is also breaking out BELOW this support line.
Previous history does showcase a data point where we did print below but was able to make it back onto the Supportline. (Something to consider).
If we make it back onto the Support line and confirm, it would most likely lead to upside.
But playing both sides, if we confirm the breakdown, we can see further declines to the $4.50 - $4.20 zone.
Also put attention to the 2 momentum indicators ive provided.
STOCH RSI is shifting to a shape, im not liking with an increased likelihood of bearish cross
MACD also printing a Deep Red Histobar and mouth of blue/orange lines is widening.
These 2 signals may support the case of further declines especially if we do get a STOCH bearish cross and MACD prints the deep Red histobar at the end of today.
Which could indicate Pelotons attempt to reset further to more Oversold conditions and perhaps better price point.
This development requires attention and observation on Peloton.
I will continue to provide updates as things develop.
USDJPY — No Trade (Regime Invalid) | Permission FirstToday USDJPY produced multiple intraday moves that look tradable at first glance.
My system did nothing.
And that is the correct behavior.
RegimeWorks only trades when higher-timeframe structure grants permission.
Current state:
• 4H regime = invalid
• No expansion
• No clean directional bias
• Mean-reverting chop
• Edge = statistically weak
So every signal is blocked by design.
No overrides.
No discretion.
No “maybe this one works”.
If permission is absent → we stay flat.
Capital protection > trade frequency.
Most losses come from forcing trades in environments like this.
Today the best trade was: No trade.
—
RegimeWorks
Permission → Setup → Execution
Not prediction. Not signals.

Sector Divergence: Technology vs Industrials1. Nature of the Two Sectors
The Technology sector is primarily growth-oriented, driven by innovation, intellectual property, software scalability, and network effects. Revenue growth, margin expansion, and long-term disruption potential are central to valuation. Many technology companies operate with relatively low marginal costs and high operating leverage once scale is achieved.
The Industrials sector, in contrast, is cyclical and asset-heavy, encompassing manufacturing, infrastructure, engineering, capital goods, logistics, and defense. Performance depends heavily on economic growth, government spending, private capital expenditure (capex), and global trade volumes.
This structural difference lays the foundation for divergence.
2. Macro-Economic Sensitivity
Technology tends to outperform during:
Low interest rate environments
High liquidity conditions
Periods of moderate but stable economic growth
Times when productivity-enhancing investments are favored
Lower rates increase the present value of future cash flows, which disproportionately benefits tech stocks due to their long-duration earnings profile.
Industrials outperform during:
Economic expansions or recoveries
Rising capex cycles
Infrastructure booms
Manufacturing upcycles
Industrial earnings are more sensitive to GDP growth, PMI data, and order books. When economies accelerate, industrial revenues and operating leverage rise sharply.
3. Interest Rates and Inflation Impact
Interest rates are a key driver of divergence.
Technology suffers when interest rates rise sharply, as higher discount rates compress valuations. Even strong earnings growth may not offset multiple contraction.
Industrials often perform better in moderate inflation and rising-rate environments, especially when pricing power and order visibility improve.
High inflation with aggressive tightening:
Negative for tech (valuation compression)
Mixed for industrials (input cost pressure vs demand strength)
Controlled inflation with fiscal spending:
Strongly positive for industrials
Neutral to mildly positive for tech
4. Earnings Cycles and Visibility
Technology earnings:
More scalable and margin-rich
Often recurring (subscriptions, SaaS, licensing)
Sensitive to enterprise spending cycles
Vulnerable to sudden demand slowdowns (IT budget cuts)
Industrial earnings:
Order-book driven
Higher revenue visibility over medium term
Sensitive to raw material costs, labor, and logistics
Strong operating leverage during upcycles
This difference means tech can re-rate quickly on expectations, while industrials move more steadily with economic data.
5. Valuation Dynamics
Technology stocks typically trade at:
Higher P/E and EV/EBITDA multiples
Premiums based on growth and innovation
Valuation sensitive to guidance and long-term TAM (Total Addressable Market)
Industrials usually trade at:
Lower multiples
Closer alignment with earnings cycles
Valuation support from tangible assets and cash flows
Divergence often appears when:
Tech valuations expand faster than earnings
Industrials lag despite improving fundamentals
or vice versa during late-cycle slowdowns.
6. Market Cycle Positioning
Early Cycle
Tech outperforms as liquidity returns
Industrials lag until capex recovers
Mid Cycle
Industrials gain leadership
Tech continues performing but with selective stock picking
Late Cycle
Industrials peak as cost pressures rise
Tech leadership becomes narrow and volatile
Recession / Risk-Off
Both decline, but defensiveness within tech (large-cap, cash-rich firms) may outperform cyclical industrials
Understanding the cycle helps explain why divergence can persist for quarters, not just weeks.
7. Policy and Government Spending Influence
Industrials benefit disproportionately from:
Infrastructure spending
Defense budgets
Energy transition projects
Manufacturing incentives
Technology benefits from:
Digitalization policies
AI, cloud, semiconductor incentives
Education and skill development initiatives
When fiscal policy dominates monetary policy, industrials tend to outperform. When liquidity and innovation dominate, technology leads.
8. Global Trade and Supply Chains
Industrials are more exposed to:
Global trade volumes
Supply chain disruptions
Commodity price fluctuations
Geopolitical risks
Technology, while global, is increasingly:
Asset-light
Service-oriented
Less exposed to shipping and logistics disruptions
This difference can cause divergence during geopolitical or supply-chain stress periods.
9. Investor Behavior and Sentiment
Technology attracts:
Momentum investors
Growth funds
Retail participation
Venture and innovation capital
Industrials attract:
Value investors
Income-oriented funds
Long-term institutional capital
During risk-on phases, tech sentiment can turn euphoric quickly. Industrials, however, tend to see more measured inflows based on fundamentals.
10. Trading and Investment Implications
For Traders
Sector rotation strategies can exploit divergence
Relative strength (Tech / Industrials ratio) is a key indicator
Divergence often precedes index-level trend changes
For Long-Term Investors
Balance growth (tech) with cyclicality (industrials)
Adjust weights based on macro signals (rates, PMI, policy)
Avoid over-concentration during extreme divergence
For Risk Management
Tech-heavy portfolios are more duration-sensitive
Industrial-heavy portfolios are more growth-sensitive
11. India-Specific Context (Optional Insight)
In markets like India:
Technology (IT services) is linked to global demand and currency trends
Industrials are closely tied to domestic growth, infrastructure, and government spending
Periods of strong domestic capex often see industrials outperform IT, even when global tech struggles.
Conclusion
Sector divergence between Technology and Industrials is not random—it reflects deeper forces such as interest rates, economic cycles, policy direction, earnings visibility, and investor psychology. Technology thrives on liquidity, innovation, and long-term growth expectations, while Industrials benefit from economic expansion, capex cycles, and fiscal stimulus.
Successful investors and traders monitor this divergence closely, using it as a leading indicator for market regime shifts. Rather than choosing one sector permanently, the key lies in dynamic allocation, recognizing when leadership is changing, and positioning accordingly.

Macro on Netflix - 7 month downtrend + Earnings + NewsI have my eyes on Netflix. A very popular stock globally, very FA strong.
It will be a macro analysis on Netflix with focus on higher timeframes with additions of lower timeframe mentions in an attempt to highlight potential swing trade areas or entry points. I will also discuss indicators, chart patterns, candle stick behavior and more.
I dont normally go into news or FA since its all priced into the charts in my opinion.
But i will say this, big news on Netflix and it hussling to gather cash for the potential Warner Bros acqusition. It shows that they mean business which is good for business and uptrends.
Since most people trade news + FA, it is something to consider. With Earnings today for Q4 and data suggestion positive earnings. This info could be used to predict potential price movement to Upside with an attempt to test or try to get back on the broken Uptrend Support trendline that was propping up its recent Uptrend.
Especially since Netflix has been on a downtrend for past 7 months. We are down roughly 34.00%. Probabilities of an uptrend increase , the longer the decline.
Questions im asking: how long the downtrend will continue? Where is the next Support area?
Is there signs in the lower timeframes of a potential bounce to test the recently broken Uptrend Support trendline.?
Netflix has a strong case for observation and attention at the moment.
Look for more posts and evidence as i continue to monitor Netflix.

XAUUSD (H4) — Bond Selloff, Yields Jump Pullback Opportunity or Rejection at the Top?
Gold is still holding a bullish structure on the H4 chart, but the rebound in global yields can easily trigger sharp swings around key resistance. Today’s approach is simple: trade the zones, not the noise.
I. Executive Summary
Primary trend: H4 uptrend remains intact.
Trading bias: Prefer BUY on pullbacks into demand; consider SELL only with clear rejection at Fibonacci resistance.
Key zones:
Sell: 4774–4778
Buy: 4666–4670
Value Buy: 4620–4625
Rule: Enter only after zone touch + confirmation (rejection / micro-structure shift).
II. Macro & Fundamentals (optimized & concise)
Global bond selloff: Bond selling is spreading globally; Japan’s 40-year JGB yield hitting 4% signals broad, persistent yield pressure.
US yields rebounding: Higher US yields (10Y–30Y) raise the opportunity cost of holding gold → short-term bearish pressure for XAUUSD.
Risk premium still alive: Geopolitical tension and tariff headlines keep markets sensitive, supporting defensive flows and limiting deep downside.
Fundamental takeaway: Rising yields can drive a pullback, but the broader risk backdrop favors a correction within an uptrend, not a full reversal (unless structure breaks).
III. Technical Structure (from your chart)
1) H4 overview
Price is extended after a strong impulse and is now consolidating, while structure still prints Higher Highs / Higher Lows.
The ascending trendline remains supportive → the higher-probability play is buying dips into demand rather than chasing price.
2) Key zones
Fibonacci Sell zone: 4774 – 4778 (major supply / resistance — profit-taking and rejection risk)
Buy zone: 4666 – 4670 (shallow pullback within trend)
VL / Value Buy: 4620 – 4625 (deeper pullback — higher-quality dip if yields spike again)
Lower support zones remain a contingency for a deeper flush.
IV. Trading Plan (Brian style — 2 scenarios)
⭐️ PRIORITY SCENARIO — BUY (trend continuation)
Idea: As long as the H4 uptrend holds, look to buy pullbacks into demand with confirmation.
Option A — Buy pullback: 4666 – 4670
SL: below 4620 (more conservative: below 4616–4610 depending on volatility/spread)
TP: 4716 – 4740 – 4774 – 4800
Option B — Value Buy (if a deeper sweep happens): 4620 – 4625
SL: below the nearest H4 swing low / below 460x (risk preference dependent)
TP: 4666 – 4716 – 4774 – 4800
Confirmation cues (optional):
Strong rejection wick at the buy zone, or
H1 micro-structure break back to the upside, or
Liquidity sweep then close back above the zone.
⭐️ ALTERNATIVE SCENARIO — SELL (rejection at Fibonacci resistance)
Idea: With yields rising, gold may react sharply at the top — treat this as a reaction trade, not a macro trend reversal call.
Sell zone: 4774 – 4778 (SELL only if price rejects clearly)
SL: above 4788 – 4800
TP: 4740 – 4716 – 4670
Important: If H4 closes and holds above 4778 (acceptance), the bias shifts to buying pullbacks instead of forcing shorts.

Structural Compression Phase🔎 Overview
This idea focuses on identifying potential bullish expansion after a multi-day price consolidation inside the EMA 100 High–Low Band.
The structure highlights range compression, swing-based trendline pressure, and rising volume during consolidation, which together can signal a market preparing for directional movement rather than random noise.
────────────────────────────
📘 Core Components
EMA 100 High–Low Band
• The EMA 100 High–Low Band represents fair value and balance.
• Price consolidating inside this band suggests indecision and energy buildup, not trend weakness.
Pivot High–Low Swings
• Pivot Highs and Pivot Lows are used to map internal market structure.
• Two swing-based trendlines are drawn:
• One connecting lower highs
• One connecting higher lows
This creates a structure squeeze within value.
────────────────────────────
🛠 Market Structure Concept
Consolidation & Compression
• Price has remained inside the EMA High–Low Band for multiple sessions.
• Swing highs are compressing downward while swing lows are compressing upward.
• This reflects decreasing volatility and controlled price action, often seen before expansion.
────────────────────────────
📐 Trendline Structure
• Upper trendline connects progressively lower swing highs.
• Lower trendline connects progressively higher swing lows.
• Both trendlines converge, indicating structural pressure.
This is not direction — it is preparation.
────────────────────────────
📊 Volume Behavior
• Volume is above average while price remains in consolidation.
• Rising participation without range expansion suggests absorption, not exhaustion.
• This behavior often precedes directional acceptance, not immediate rejection.
────────────────────────────
📈 Bullish Expansion Context (Structure-Based)
• A clean acceptance above the upper swing trendline
• Followed by price sustaining above recent structure highs
• While remaining supported outside the EMA High–Low Band
This sequence would indicate resolution of compression rather than a false breakout.
────────────────────────────
🧭 Validation, Devalidation & Projection Framework
Validation Line (Strength Confirmation)
• A candle close above the validation line confirms structural acceptance.
• This signals that the compression phase has resolved with strength, not noise.
Devalidation Line (Structure Failure)
• A candle close below the devalidation line invalidates the setup.
• This indicates failure of compression logic and negates the structural thesis.
Target Line (Maximum Structural Projection)
• Once validated, the target line represents the maximum expected structural expansion based on current compression range.
• This is a projection reference, not a prediction.
Devalidation as Protection
• After validation, the Devalidation level acts as a structure protection zone.
• A sustained close below this level signals loss of acceptance and invalidates continuation logic.
────────────────────────────
📝 Summary
• EMA 100 High–Low Band defines balance and value.
• Price consolidates inside the band for multiple sessions.
• Swing-based trendlines show structural compression.
• Volume expands during consolidation, indicating participation.
• Validation and devalidation lines define acceptance and failure zones.
• Target and revalidation levels provide structured projection and protection.
• The idea focuses on structure resolution, not prediction.
• Direction is assessed only after acceptance, not anticipation.
────────────────────────────
⚠️ Disclaimer
📘 For educational purposes only.
🙅 Not SEBI registered.
❌ Not a buy/sell recommendation.
🧠 Purely a learning resource.
📊 Not Financial Advice.

$BNB Bull Run Rapidly & Price Hit $1,515 Q2 in 2026On January 15, 2026, BNB Chain executed its 34th quarterly BNB token burn, permanently removing 1,371,803.77 BNB, valued at approximately $1.277 billion, from circulation.
The event highlights BNB's deflationary model enhancing scarcity, potentially impacting market dynamics and long-term asset valuation amid BNB Chain's ongoing ecosystem growth initiatives.
BNB Chain conducted its 34th quarterly token burn on January 15, 2026, permanently removing 1,371,803.77 BNB. This action aligns with the network's goal of reaching a 100 million BNB supply cap using a deflationary model. The 34th BNB Burn highlights the impact on the ecosystem.
Fermi Hardfork Live on Mainnet
Meanwhile, the Fermi hard fork upgrade is now live on BNB Smart Chain. Developers activated the upgrade on mainnet on Jan. 14, 2026, at 02:30 UTC, supported by the v1.6.4 client release.
Following the Fermi mainnet activation, block time dropped from 0.75 seconds to 0.45 seconds, improving transaction speed and dApp responsiveness.
Fermi also adds more parameter updates, improvements, and bug fixes to the BNB network.
Additionally, Fermi introduces updated voting rules for fast finality through BEP-590 to support frequent block production.
Essentially, Fermi makes the network faster without compromising reliability. It follows other major updates, including Lorentz, Pascal, and Maxwell.
BNB Price Outlook, What to Expect
BNB, the native digital asset of the BNB Chain, is currently showing improvement in its price. Over the past 24 hours, BNB price increased by 0.9% to $938.2, with a market cap of $127.9 billion.
Considering its latest move, BNB now moves closer to hitting the $1,000 mark. BNB closed higher after breaking above the $920 key resistance.
If the move continues, analysts have predicted that the BNB price may head toward the next resistance zone between $1050 and $1080.
The potential launch of a BNB ETF is one key factor that could fuel the move towards $1,000. Just a few hours after Grayscale announced the filing of its incoming spot BNB ETF, the BNB price posted 2% gains.
#Write2Earn #BinanceSquareFamily #Binance #BNB #SUBROOFFICIAL
Disclaimer: This article is for informational purposes only and does not constitute financial advice. Always conduct your own research before making any investment decisions. Digital asset prices are subject to high market risk and price volatility. The value of your investment may go down or up, and you may not get back the amount invested. You are solely responsible for your investment decisions and Binance is not available for any losses you may incur. Past performance is not a reliable predictor of future performance. You should only invest in products you are familiar with and where you understand the risks. You should carefully consider your investment experience, financial situation, investment objectives and risk tolerance and consult an independent financial adviser prior to making any investment.

Chumtrades XAUUSD H2 | Is the Liquidity Sweep Over?On Friday, the market reacted strongly after Trump’s comments regarding Kevin Hassett, when Trump expressed his preference for Hassett to remain in his current role rather than taking a new position.
👉 As a result, gold printed a long wick liquidity sweep back into the prior ATH zone, around 4530–453X, before closing back above 456X.
This brings us to the key question:
Was this sweep enough for the BUY side, or is the market still looking to test lower levels?
Political developments will be a key driver for gold direction in the coming week.
📰 Key Political Factors to Monitor
1. Trump – Greenland
The US has imposed 10% tariffs, with the possibility of increasing them to 25% on countries that do not support the annexation of Greenland
No fixed deadline, tariffs remain until Greenland becomes part of the US
→ This is a supportive factor for gold, especially amid rising geopolitical uncertainty
→ This news may directly impact the market open
→ If price reacts strongly, avoid SELLs near resistance
2. Iran – Protests
Monitor the risk of Trump returning to direct intervention
→ A potential headline-driven volatility trigger
🟢 Key Support Zones to Watch
4530 – 4535
4515 – 4510
4480 – 4482
4462
4410 – 4407
🔴 Key Resistance Zones to Monitor
4618 – 4628
4648 – 4650
4655 – 4660
4698 – 4699
⚠️ Trading Notes
Price levels are zones for observation, not instant entry points
SELL setups around 462X must be evaluated based on news reaction
If momentum accelerates on headlines → stay flat and avoid trading against strength
💬 Question for the New Week
Is the market finishing its liquidity collection on the BUY side,
or was Friday’s sweep the final test before the next leg higher?
📌 Follow www.tradingview.com for proactive market analysis, structured trade planning, and risk management insights.

ETH-The final drop before the cows come home (SHORT TERM SHORT)hello all 👋🙋♂️🙋♀️ Thank you so much for coming today
Let's get right to it💡. Today we are looking at a 4 hour view of ETHEREUM. I have noticed several things about ETH price action and what it could indicate.
⬆️ above on chart 📈📉 you can see I have labeled
major trend line (support line)
We have made contact with this long standing trend line and have seen some bullish pressure after doing so.
🤸🤸♂️
HOWEVER
There has been a Head and shoulders bearish pattern formed on the 4 hour view in which we did go down from but bounced back up to make a bearish flag 🐻🧸
🌊🏄♂️🏄♀️
MORE RECENTLY
We have formed a bearish harmonic pattern, which leads me to believe we will try to continue our head and shoulders pattern (with a drop in price) ⏬🔻But will catch support at our major trend line ~(3800)
🐼This is a Short term short Idea. The cryptocurrency market is extremely volatile.💣
This is not financial advice
🐶
Always have a stop loss ✋🛑💲 set🆗
Any thoughts 💭💡, questions 🙋♀️🙋♂️❓, good 👍, bad👎, happy 😄 or sad 😥, in the comments always welcome.😄
Jazerbay ☯️

Gold Before CPI: Top or Trap?1. STRATEGIC CONTEXT
Primary trend: GOLD remains in an uptrend; the higher-timeframe structure is still intact.
Macro backdrop:
CPI tonight may cause short-term volatility.
However, geopolitics is currently a stronger driver than CPI.
Key geopolitical risks:
Greenland tensions → escalating global strategic rivalry.
Protests in Iran, power and internet cuts → rising Middle East risks.
👉 Strategic implication:
Gold continues to be supported as a safe-haven asset → pullbacks are for buying, not for chasing shorts.
📊 2. CURRENT MARKET STRUCTURE
Price is:
Holding the ascending trendline
Consolidating in a box, compressing ahead of CPI
Market condition:
High probability of false breakouts
Top-catching traps are very likely before the news
📍 3. KEY PRICE LEVELS
🔴 RESISTANCE
4,680 – 4,700
→ Previous high / ATH zone
→ Reactive sells only if clear rejection appears
4,655 – 4,660
→ Intermediate resistance, easily swept pre-CPI
🟣 CONSOLIDATION BOX
4,595 – 4,630
→ Sideways range ahead of CPI
→ No FOMO inside the box
🟢 SUPPORT
4,545 – 4,550 → Major confluence support
4,480 → Medium-term support, trendline retest
4,420 → Deep support, last bullish structure zone
📝 4. IMPORTANT NOTES
Higher CPI:
May trigger a technical pullback
❌ Does NOT automatically mean a top
Lower / in-line CPI:
Gold may consolidate above highs and break ATH
Selling before CPI:
→ Reactive scalps only, no holding
Buying:
→ Only when price reaches key zones with clear reaction
🎯 5. STRATEGIC MINDSET
❌ Don’t force top-catching while geopolitics supports gold
✅ Focus on risk management – wait for zones – wait for confirmation
🧠 Before CPI: survival > profit

EUR/USDPrice on a bearish trend.
Tested 71% on fib. Now expect a move down towards previous lows (liquidity)

GBP/USDPrice moved towards liquidity. (First trade 1:2RR)
Then expect bounce off of liquidity towards 50% fib mark (Second trade)

Role of International Trade1. Promotes Economic Growth
One of the most significant roles of international trade is its contribution to economic growth. By opening access to larger global markets, countries can sell more than they could within their domestic boundaries. This increased demand encourages higher production, leading to better utilization of resources and economies of scale. Export-oriented industries often grow faster, contributing positively to a nation’s Gross Domestic Product (GDP). For developing countries, international trade provides opportunities to accelerate growth by integrating with global value chains.
2. Efficient Allocation of Resources
International trade is based on the principle of comparative advantage, which states that countries should specialize in producing goods and services they can produce most efficiently and at lower opportunity cost. For example, a country rich in natural resources may focus on mining or agriculture, while a technologically advanced country may specialize in manufacturing or services. This specialization leads to efficient allocation of global resources, minimizing waste and maximizing productivity worldwide.
3. Enhances Consumer Choice and Living Standards
Trade allows consumers access to a wide variety of goods and services that may not be available domestically. Products such as electronics, automobiles, medicines, clothing, and food items can be sourced from different parts of the world at competitive prices. Increased competition among producers also leads to better quality and innovation. As a result, consumers enjoy lower prices, improved quality, and greater choices, which significantly enhances living standards.
4. Encourages Industrial Development
International trade supports industrialization, especially in developing and emerging economies. Exposure to global markets encourages industries to improve efficiency, adopt new technologies, and meet international quality standards. Export-led growth strategies have helped many countries transform from agrarian economies into industrial powerhouses. Trade also attracts foreign direct investment (FDI), which brings capital, managerial expertise, and advanced technology.
5. Generates Employment Opportunities
Trade expansion leads to job creation in export-oriented industries such as manufacturing, agriculture, logistics, shipping, finance, and information technology. As companies expand production to meet global demand, they require more labor. Although trade can sometimes lead to job displacement in less competitive sectors, overall it creates better employment opportunities and encourages skill development. Governments can support workforce transition through training and education programs.
6. Facilitates Technology Transfer and Innovation
International trade plays a crucial role in spreading technology and innovation across borders. Imports of advanced machinery, equipment, and software help domestic industries modernize production processes. Multinational companies often share best practices, research methods, and technical knowledge with local firms. This exchange accelerates innovation, increases productivity, and strengthens a country’s technological capabilities.
7. Strengthens International Relations
Trade fosters cooperation and interdependence among nations. Countries engaged in trade are more likely to maintain peaceful relations, as economic ties create mutual benefits. Trade agreements and economic partnerships promote dialogue, trust, and collaboration on broader global issues such as climate change, security, and sustainable development. Thus, international trade also plays a diplomatic role by strengthening global stability.
8. Supports Economic Diversification
For many countries, especially those dependent on a single commodity or sector, international trade encourages diversification. By exploring new export markets and products, economies reduce dependence on limited resources and minimize vulnerability to price fluctuations. Diversification improves economic resilience and helps countries better withstand global economic shocks.
9. Increases Government Revenue
Trade generates significant revenue for governments through customs duties, tariffs, and taxes on imports and exports. These revenues can be used to fund public services such as infrastructure, healthcare, education, and social welfare programs. While many countries are reducing tariffs under free trade agreements, trade-related economic growth still expands the tax base.
10. Promotes Global Economic Integration
International trade is a foundation of globalization. It connects countries into a single economic system where goods, services, and capital flow more freely. This integration helps align production standards, financial systems, and business practices. While globalization presents challenges such as inequality and environmental concerns, its benefits—driven largely by trade—have lifted millions out of poverty worldwide.
11. Challenges and Responsible Trade
Despite its advantages, international trade also presents challenges. Trade imbalances, protectionism, unfair trade practices, environmental degradation, and social inequality are important concerns. Therefore, the role of international trade must be supported by fair trade policies, strong regulations, environmental protection, and inclusive growth strategies. Sustainable and ethical trade ensures that the benefits are widely shared.
Conclusion
The role of international trade in the modern world is multifaceted and indispensable. It drives economic growth, promotes efficiency, enhances consumer welfare, supports industrial and technological advancement, and strengthens global cooperation. While challenges exist, well-managed international trade remains a powerful engine for development and prosperity. In an increasingly interconnected global economy, countries that actively and responsibly engage in international trade are better positioned to achieve long-term economic stability and improved quality of life for their citizens.

IDEAVodafone Idea- Taken multiple support from the orange trendline
breaking it would be bad but till it is above the orange trendline one can take bullish trades with the sl below trendline.
SInce it is upward sloping trendline so your SL would automatically be trailed

XAUUSD H1– Bullish Bias, Waiting for Channel BreakoutXAUUSD H1 – Bullish Bias, Waiting for Channel Breakout
Gold continues to trade inside an ascending channel on H1, and the overall structure still favours upside continuation. At this stage, the priority is not chasing price, but waiting for either a clean channel breakout or a controlled retest of demand before the next impulsive move.
TECHNICAL STRUCTURE
Price is consolidating inside a rising channel after a strong impulsive rally.
Higher lows are still being respected, showing that buyers remain in control.
The current range looks like re-accumulation, preparing for the next expansion leg.
KEY LEVELS TO WATCH
Buy-on-retest zone:
4612 – 4615
This is the most important level in the short term. A successful retest and hold here keeps the bullish structure intact and opens the door for continuation.
Upper resistance / reaction zone:
4688 – 4690
This area may cause short-term reactions or consolidation, but a strong break and acceptance above it would confirm bullish momentum.
Upside target:
4745
This is the next major objective once price breaks out of the channel and absorbs sell-side liquidity above.
Sell-side liquidity below:
The lower boundary of the channel acts as liquidity support. As long as price holds above it, pullbacks are considered corrective.
PRIORITY SCENARIO – BULLISH CONTINUATION
Price retests 4612–4615, holds above the zone, and forms bullish confirmation.
A breakout above 4688–4690 confirms strength.
Momentum accelerates toward 4745 as buy-side liquidity is triggered.
ALTERNATIVE SCENARIO – RANGE EXTENSION
If price fails to break immediately, further consolidation inside the channel is possible.
In this case, patience is key until a clear breakout or a clean retest of demand appears.
SUMMARY VIEW
Bias remains bullish
Focus on buying pullbacks, not chasing highs
A confirmed break of the channel is the signal for the next expansion
4612–4615 defines whether buyers stay in control
The market will show direction once liquidity is taken — wait for confirmation.

MINISO Group Holding (MNSO) - Accumulation Phase After DowntrendMINISO is currently displaying a clear accumulation structure following a prolonged corrective phase. After the prior impulse move higher, price entered a controlled downtrend and has now stabilized back around the long-term mean, where TrendGo Accumulate has been consistently active .
This is an important shift in behavior: instead of acceleration to the downside, price is now moving sideways with reduced volatility , suggesting absorption of supply rather than distribution.
TrendGo System Read
• Accumulate: Multiple accumulation signals have appeared during the base-building phase, historically aligning with areas where downside pressure fades and positioning begins.
• Structure: Price is holding around the long-term reference line, forming a flat, compressed range rather than lower lows.
• Context: Institutional volume remains low, which often characterizes early-stage accumulation rather than late-cycle breakouts.
What matters next
This is not a breakout environment yet - it is a preparatory phase .
For a constructive continuation, we want to see:
• Sustained holding above the accumulation zone
• Gradual expansion in range and participation
• Follow-through rather than single-candle reactions
If price fails to hold the base, the accumulation thesis weakens and the structure resets.
TrendGo perspective
This is how trends are born quietly - compression first, expansion later.
No prediction, no urgency. Context before decisions.
The question is not “ will it go up tomorrow? ”
The real question is whether this base is being respected over time.

Political instability Can gold rebound to the previous ATH?Political instability: Venezuela’s President Maduro arrested – Can gold rebound to the previous ATH?
1️⃣ Market Context
The overall structure remains bullish.
Price is undergoing a short-term correction after a strong volatile move.
The 4300 area is acting as a key support zone.
RSI shows buy–sell convergence; bulls are gradually absorbing bears, keeping downside pressure well controlled.
2️⃣ News & Fundamental Factors
Geopolitical tension: Venezuela attacked by the U.S., President arrested and transferred to the U.S.
Expectation of a gap and bullish move in gold in the upcoming session.
Current news flow continues to support a positive outlook for gold.
3️⃣ Main Scenario
Priority scenario: Price holds above 4300 and resumes the bullish structure.
Key intraday levels to watch:
Support: 4300–431X, 4270–4275
Resistance: 4370–4375, 4402–4404
Focus on shallow pullbacks in line with the main trend.
4️⃣ Trading Strategy (Intraday / Weekly)
Trend-following remains the core approach, while being prepared for minor pullbacks to avoid missing moves.
Closely monitor price reactions at:
4300: Nearest support, currently holding well.
437X: Potential intraday reaction zone.
Always wait for price action confirmation, avoid entries in the middle of the range.
5️⃣ Extensions & Notes
If 4300 breaks decisively:
Deeper correction toward 427X, 425X
Further extension to 417X, a zone worth watching for swing opportunities.
Volatility remains high → risk management is the top priority.
✨ Wishing everyone a profitable new week, green accounts as far as the eye can see

BTCUSD – 1H Chart Analysis📊 BTCUSD – 1H Chart Analysis
Bitcoin remains in a bullish structure after the recent breakout and continuation. Price is currently consolidating above the previous resistance zone, which is now acting as near-term support.
Price Action:
The strong impulsive move created a new higher high, followed by a controlled pullback.
Recent candles show buyers defending dips, indicating acceptance above prior resistance.
No strong bearish rejection is visible yet, suggesting consolidation rather than reversal.
EMA Structure:
EMA 9 & EMA 21 are flattening and starting to curl up, showing short-term stabilization.
EMA 50 (~92,830) remains well below price, confirming the broader bullish trend.
Price holding above EMA 21 keeps the bullish bias intact.
🔎 Key Levels
Resistance: ~94,400–94,600
Support (S1): ~93,500
Support (S2): ~92,800 (EMA 50 zone)
📈 Market Scenarios
Bullish continuation: Holding above S1 with acceptance may allow another push toward higher levels.
Pullback scenario: Loss of S1 could lead to a deeper retrace toward S2, still within bullish structure.
🧠 Short TradingView Minds Version
BTCUSD 1H: Price consolidating above prior resistance after breakout. EMA structure supports bullish bias while holding above ~93.5k. Continuation favored unless key support breaks.
Educational view only.

ETHUSD – 30M Chart Analysis📊 ETHUSD – 30M Chart Analysis
Ethereum is currently trading in a range structure after the recent impulsive bullish move. Price is consolidating between a defined resistance zone near 3,255–3,260 and a support area around 3,215–3,220.
🔑 Key Levels
Resistance: ~3,255 – 3,260
Support (S1): ~3,215 – 3,220
Lower Support: ~3,140 – 3,150
📈 Price Action Reasoning
Price faced selling pressure at resistance, shown by multiple rejections and upper wicks.
Pullbacks are being absorbed near support, indicating buyers are defending this area.
EMA 9 & EMA 21 are acting as short-term dynamic support, keeping price stable.
EMA 50 (~3,212) aligns with horizontal support, strengthening the demand zone.
🔎 Market Outlook
Holding above 3,215 keeps the structure constructive and favors continuation attempts.
A clean break below support may lead to a deeper pullback toward the lower support zone.
Acceptance above resistance could allow continuation toward higher levels.
🧠 Short TradingView Minds Version
ETHUSD 30M: Price consolidating between 3,220 support and 3,260 resistance after impulsive move. EMAs align with support, showing buyers active. Range remains intact until a clear break.
Educational view only.

XAUUSD H1 –Liquidity Reaction After Geopolitical SpikeXAUUSD H1 – Liquidity Reaction After Geopolitical Spike
Gold surged strongly at the start of the week as escalating geopolitical tensions boosted safe-haven demand, while expectations of further Fed rate cuts continued to support the broader bullish narrative. From a technical perspective, price is now reacting around key liquidity and Fibonacci zones rather than trending impulsively.
TECHNICAL OVERVIEW
On H1, gold experienced a sharp sell-off followed by a recovery, forming a V-shaped reaction that suggests aggressive liquidity clearing.
Price is currently trading below prior breakdown zones, indicating that supply remains active at higher levels.
The market structure favours sell-on-rallies in the short term, while deeper pullbacks may attract fresh buyers.
KEY LEVELS & MARKET BEHAVIOUR
Upper sell zones (supply & Fibonacci confluence):
4497 – 4500 (FVG sell zone, premium area)
4431 – 4435 (Fibonacci + former support turned resistance)
These zones represent areas where sellers previously stepped in aggressively, making them important reaction levels if price rebounds.
Lower buy-side liquidity:
4345 – 4350 (Value Low / buy-side liquidity zone)
This area aligns with trendline support and prior accumulation, making it a key level to monitor for a bullish reaction if price rotates lower.
EXPECTED PRICE FLOW
Short term: price may continue to consolidate and rotate between resistance and liquidity below, with choppy price action likely.
A rejection from the upper resistance zones could lead to another leg lower toward buy-side liquidity.
If buy-side liquidity is absorbed and defended, the market may attempt another recovery move.
FUNDAMENTAL CONTEXT
Gold’s strength is underpinned by two major factors:
Rising geopolitical risk, which increases demand for safe-haven assets.
Dovish expectations from the Federal Reserve, as markets continue to price in additional rate cuts, reducing the opportunity cost of holding non-yielding assets like gold.
These fundamentals support gold on higher timeframes, even as short-term technical corrections play out.
BIG PICTURE VIEW
Medium-term bias remains constructive due to macro and geopolitical support.
Short-term price action is driven by liquidity and reaction zones rather than trend continuation.
Patience is key—allow price to interact with major levels before committing to the next directional move.
Let the market show its hand at liquidity.

XAUUSD (H2) – BUY priority today Gold holds above 4,400 on safe-haven flows | Trade liquidity, don’t chase
Quick summary
Gold started the week with strong momentum and pushed above 4,400 during the Asian session as global markets rotated into safe-haven assets. Geopolitical risk is the key driver after reports of US ground strikes in Venezuela and the detention of President Nicolás Maduro and his wife.
With that backdrop, my plan today is simple: prioritise BUY setups at liquidity zones, and avoid FOMO while price is elevated.
1) Macro context: Why gold is supported
When geopolitical risk escalates, capital typically flows into gold.
Headline-driven sessions often bring:
✅ fast pumps, ✅ liquidity sweeps, ✅ larger wicks/spreads.
➡️ The safest execution is waiting for pullbacks into predefined buy zones, not chasing highs.
2) Technical view (based on your chart)
On H2, gold has bounced sharply and your chart highlights clear execution areas:
Key levels for today
✅ Buy zone: 4340 – 4345 (trend/structure pullback zone)
✅ Strong Liquidity: lower support band (marked on chart)
✅ Sell zone: 4436 – 4440 (near-term supply / reaction area)
✅ Sell swing / target: 4515 – 4520 (higher objective / profit-taking zone)
3) Trading plan (Liam style: trade the level)
Scenario A (priority): BUY the pullback into 4340–4345
✅ Buy: 4340 – 4345
SL (guide): below the zone (adjust to spread / lower TF structure)
TP1: 4400 – 4410
TP2: 4436 – 4440
TP3: 4515 – 4520 (if momentum continues with headlines)
Logic: 4340–4345 offers a cleaner R:R than chasing above 4,400.
Scenario B: If price holds above 4,400 and only dips lightly
Look for a buy only on clear holding signals near the closest support/strong liquidity (M15–H1).
Still not recommending FOMO entries in headline volatility.
Scenario C: SELL reaction (scalp) at supply
✅ If price tags 4436–4440 and shows weakness:
Sell scalp: 4436 – 4440
SL: above the zone
TP: back toward 4400–4380
Logic: This is a near-term supply area — good for quick profit-taking, not a long-term reversal call.
4) Notes (avoid getting swept)
Asian session can spike hard on headlines → wait for pullback confirmations.
Reduce size if spreads widen.
Only execute when price hits the level and prints a clear reaction (rejection / engulf / MSS).
What’s your plan today: buying the 4340–4345 pullback, or waiting for price to push into 4515–4520 before reassessing?

EUR/CAD: Bullish Continuation After ConsolidationThe EURCAD pair had been accumulating within a horizontal range on the 4-hour timeframe for over a week.
Today, its resistance was breached with a strong bullish movement.
The price may experience further growth. The nearest resistance level is at 1.6174.
