XAUUSD – Price Channel Rising Towards 4000 USD Next Week
Hello Traders,
Every day I share scenarios for you to reference and build your own strategies. And here is the outlook for next week – as gold is in a sustainable uptrend, approaching the psychological mark of 4000 USD.
Technical Outlook
On the H4 chart, gold continues to move within a clear upward price channel.
Every time the price touches the support trendline, a strong rebound occurs, indicating that buying pressure remains dominant.
This price channel has remained stable for many weeks, providing a basis for us to prioritize buying in line with the trend.
The target of 4000 USD is not far off, especially as the fundamental context continues to support the uptrend.
Fundamental Context
The market is expecting the Fed to continue cutting interest rates in October, providing a boost for gold.
Current U.S. financial and economic news is limited, as the U.S. government remains shut down.
Geopolitical factors have somewhat cooled, but gold still holds its position as an important safe-haven asset.
Trading Scenario
1. Buy (main priority):
Entry: 3860 – 3865 (at the rising trendline).
TP: 3960 – 4000.
SL: manage below the trendline.
2. Sell (backup if the channel breaks):
Condition: 3853 is breached.
At that point, a new trend will form, and the Sell scenario will be activated.
Conclusion
Main trend: Buy in line with the rising channel, aiming towards 4000 USD next week.
Sell should only be considered if there is confirmation of a break below 3853.
The market is in a critical phase, so be patient and wait for a good entry point to trade safely and effectively.
Trend Line Break

XAUUSD Weekly ResultXAUUSD Weekly Result, yes we did very well this week as always trading gold and using advance support and resistance and the simple daily bias system.

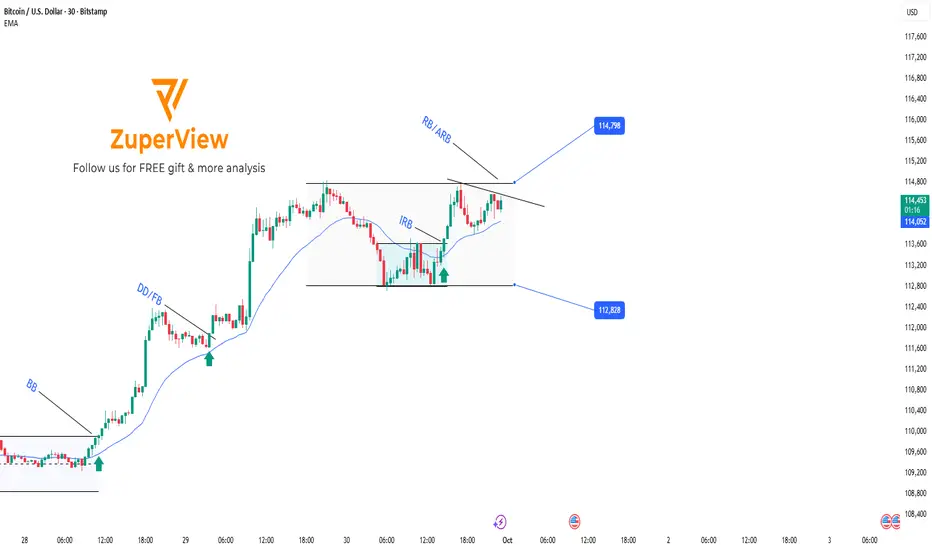
BTC breakout trading setupBITSTAMP:BTCUSD is currently consolidating within the 112,828–114,798 sideway range.
Earlier, the market broke out from a smaller accumulation inside the larger range, generating an IRB (Inside Range Break) signal, pushing price back toward the upper boundary.
Price is now forming a momentum consolidation, indicating potential for another breakout.
2 Possible Scenarios
1. RB (Range Break)
Price compresses further with EMA pressing tightly.
A strong breakout directly above the range top may occur with momentum.
2. ARB (Advance Range Break)
After breaking above the range, instead of continuing higher immediately, price may stall.
A new consolidation forms just above the broken range, with EMA pressing upward.
This setup may signal a continuation of the previous breakout move.
You can refer to my previous analysis here:
Please like and comment below to support our traders. Your reactions motivate us to do more analysis in the future 🙏✨
Daniel Miller @ ZuperView
#GOLD, Focus on the retest supportHello trades
I focus on the consolidation rang of 3863.8-3838
Resistance levels: 3863.8-3900
Support levels:3855-3838-3824
Thank you

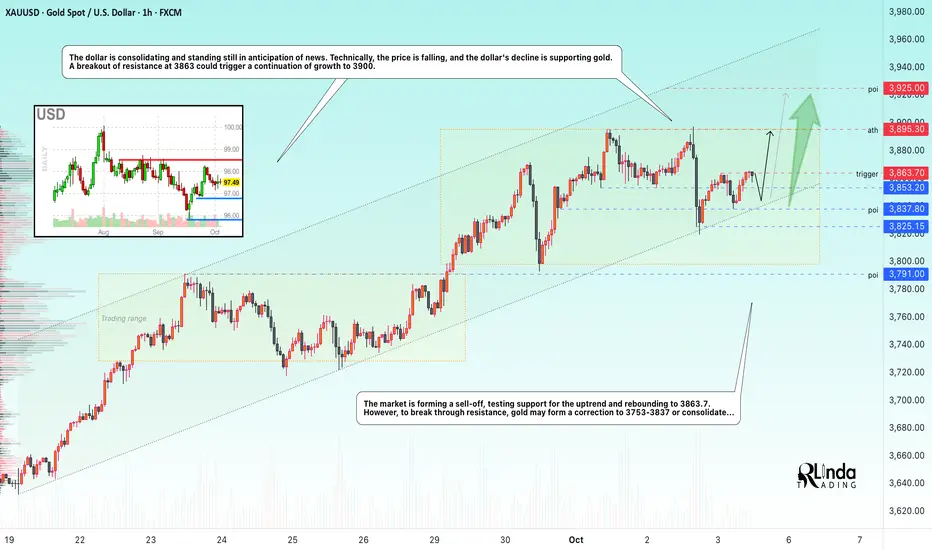
GOLD → Consolidation before continued growth. Trigger 3863FX:XAUUSD is consolidating in the range of 3837.8 - 3863.7, preparing for its seventh consecutive week in positive territory. Despite a correction from a record high of $3897, the metal remains supported by a combination of the Fed's dovish policy and geopolitical risks.
Key supporting factors: Expectations of Fed easing: Dovish sentiment continues to fuel interest in gold. Geopolitical tensions and tougher G7 sanctions against Russia. The ongoing shutdown is delaying the release of US data, increasing uncertainty.
Important: If markets ignore the shutdown, gold may face a correction.
US services data (ISM Services PMI) and Fed speeches: May adjust rate expectations.
Resistance levels: 3863.7, 3900
Support levels: 3853, 3837, 3825
Focus on the current consolidation range of 3863 - 3837. Before attempting a breakout, a retest of support may form within the consolidation. The trend remains bullish, as does the sentiment at the moment.
Best regards, R. Linda!
XAUUSD H4 – WAITING FOR NFP, TRADING WITHIN THE PRICE CHANNEL
Hello trader 👋
Gold continues to hold within the H4 ascending price channel, but buying power has noticeably weakened after yesterday's sharp drop. The price reaction at the lower trendline indicates that selling pressure is not yet strong enough to break the structure, yet the market's hesitation reflects a wait-and-see attitude for the NFP data and a series of important US news tonight.
During the European session, prices may move slowly and frustratingly – typical for a Friday – before exploding in the US session. Therefore, the sensible strategy now is short-term trading within the channel, flexibly following each small wave on M5–M15 frames.
🔑 Key Technical Levels
Resistance: 3,874 – 3,876 (Sell entry)
Near support: 3,794 – 3,795 (Buy scalping zone)
Deep support: 3,760 (Important buy zone)
⚖️ Trading Scenarios
🔴 Short-term Sell Scenario:
Entry: 3,874 – 3,876
SL: 3,885
TP: Expect to break the lower trendline → 3,79x – 3,76x
🟢 Buy Scalping Scenario:
Entry: 3,794
SL: 3,785
TP: 3,820 → 3,835 → 3,855 → 3,876 → 3,890
🟢 Deep Buy Zone Scenario:
Entry: 3,760
SL: 3,750
TP: 3,782 → 3,795 → 3,810 → 3,825
📊 General Outlook
Main trend: Gold maintains an upward channel, but buying power is weakening and the risk of a breakdown is present.
European Session: Slow fluctuations, prone to “whipsaw” → prioritize short-term scalping.
US Session: NFP news may create strong waves, breaking the price channel → traders need to closely monitor reactions around 3,794 and 3,760 to decide the next buy or sell.
📌 Conclusion: Before NFP, gold remains in an upward channel but technical factors indicate a potential correction. Sensible strategy: Short sell at 3,874–3,876, or buy around support 3,794 – 3,760 depending on price action. Manage capital tightly, as the US session will determine the next major direction.
Follow my footsteps on the journey of sharing trading experiences.

LiamTrading – Gold Plan: Wide Range + US Politics Exert Pressure
Gold continues to fluctuate within a wide range as market sentiment is heavily influenced by news from the United States. On October 3rd, the US Senate is expected to vote again on the temporary budget bill. If it fails, the federal government could shut down, extending into the following week. This will undoubtedly have a strong impact on safe-haven flows, making gold increasingly sensitive to key technical resistance levels.
📊 Technical Analysis – H1 Chart
Gold is moving within a wide sideways structure, oscillating around strong resistance – support zones.
Fibonacci Resistance + Psychological level around 3878–3881 → suitable for short-term Sell scalping.
Confluence Support (Retest + Volume) around 3828–3830 → ideal zone to watch for Buy, expecting a recovery wave.
The major trend still leans towards an increase, however, in the short term, the market will experience many liquidity sweeps.
🎯 Trading Scenario
Sell (short-term – prioritize on M15):
Entry: 3878–3881
SL: 3886
TP: 3860 – 3855 – 3840 – 3822 – 3810
Buy (retest support + volume):
Entry: 3828–3830
SL: 3822
TP: 3845 – 3860 – 3877 – 3890
📌 Conclusion
Today's range is quite wide, suitable for scalping according to psychological resistance zones.
Short-term Sell at Fibonacci resistance levels.
Buy when price retests confluence support with volume.
Political news from the US will be a catalyst causing significant gold volatility, so maintaining disciplined capital management is essential.
👉 Stay closely tuned to the scenarios, I will update frequently as the market experiences new fluctuations.

XAUUSD – Prioritize Sell After Breaking Trendline
Hello Traders,
Gold has experienced a strong upward movement for several consecutive days, but now the market is showing significant reversal signals. The upward trendline on H4 has been broken, confirming a weakening buying momentum. In the medium term, the preferred scenario will be selling rather than continuing to chase buys.
Basic Context
The U.S. Treasury has just repurchased an additional $2 billion in bonds, bringing the total repurchase this week to $4.9 billion. This move indicates efforts to stabilize the bond market, but also reflects significant pressure on the USD and the U.S. financial situation.
In the short term, the injection of additional bond liquidity makes gold more unpredictable, and the trendline break at this time is an important warning signal.
Technical Perspective
Breaking the upward trendline → confirms a structural change.
MACD signals weakening, with buyers losing clear momentum.
The 3865 – 3868 zone is a beautiful resistance retest point to Sell.
If the price falls deeply, the support areas around 3830 – 3810 – 3790 will be the next targets.
Today's Trading Scenario
Sell (main priority):
Entry: 3865 – 3868
SL: 3875
TP: 3855 – 3832 – 3810 – 3790
Buy Scalping (counter-trend – high risk):
Entry: 3803 – 3805
SL: 3795
TP: 3822 – 3835 – 3850
Conclusion
Gold has broken the trendline, prioritizing Sell in the short and medium term.
News from the U.S. bond market further emphasizes instability risks, making counter-trend Buy moves only suitable for short-term Scalping.
Follow me for the earliest updates on scenarios as price paths change.

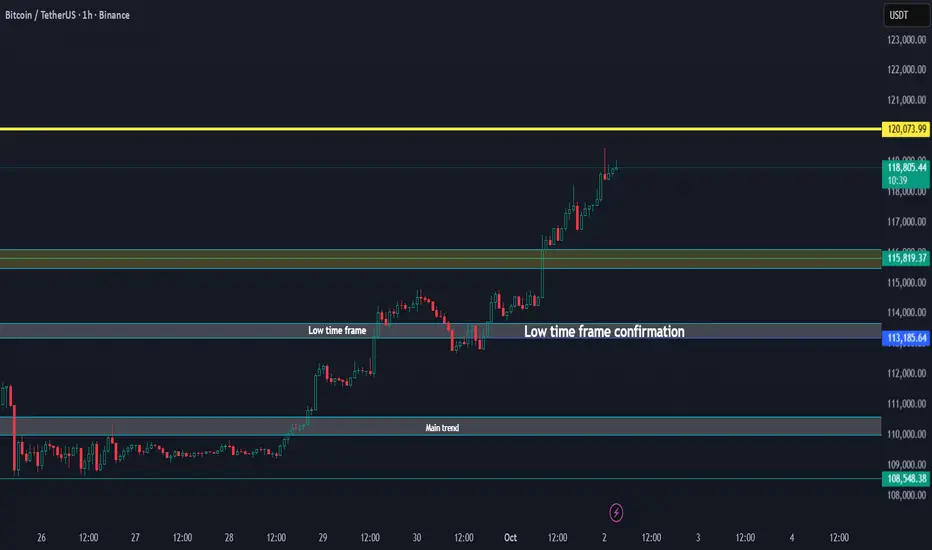
BTC Above All Key Levels, Trend Points Higher Update 02-10-2025🚀 Bitcoin / USDT Update
Bitcoin has broken above all key levels, showing strong momentum.
Main trend has been secured.
Low time frame is confirmed and holding.
Price is currently pushing into new zones with upside pressure.
If this strength continues, BTC could extend toward the 120K region, and a new trend could unlock further upside potential beyond that.
✅ As long as Bitcoin stays above the confirmation zone (~113K support), momentum remains bullish.
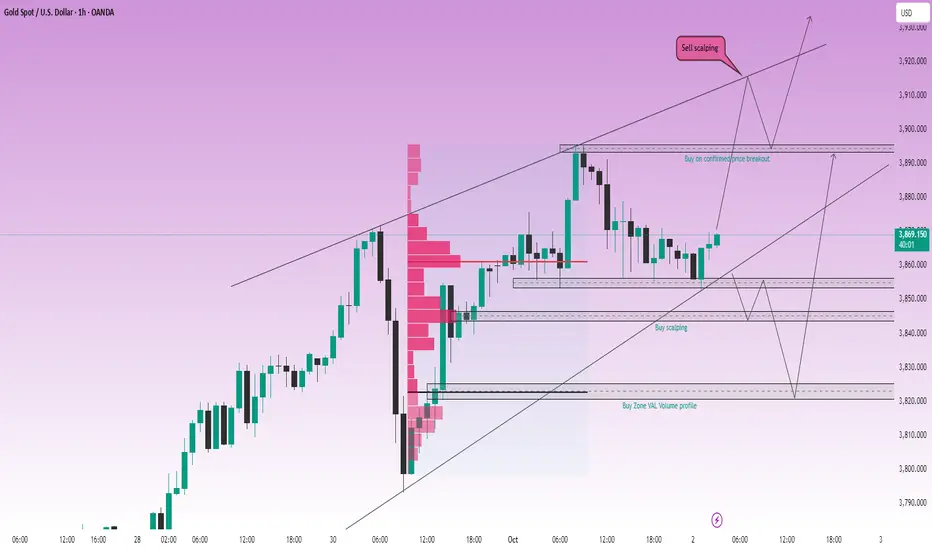
LiamTrading – Intraday Trading Outlook LiamTrading – Intraday Trading Outlook
Looking at the global financial picture, we can see an extraordinary alignment:
Equities – All-Time High (ATH)
Housing Prices – ATH
Bitcoin – ATH
Gold – ATH
Money Supply – ATH
National Debt – ATH
CPI Inflation – averaging 4% annually since 2020, twice the Fed’s “target”
Federal Reserve – continuing to cut interest rates this month
It is clear that cheap money combined with persistent inflationary pressure is a powerful driver behind gold’s move into historic territory. In this context, looking for buying opportunities in line with the trend remains the more rational approach.
📊 Technical Analysis – H1 Chart
Gold is moving within a well-defined upward channel.
Volume Profile indicates the POC around 3840–3850, an important level for potential scalping buys.
The VAL aligns with the rising trendline near 3820–3822, providing strong confluence for medium-term buying.
A confirmed break above 3895 (new ATH) would support further trend-following buys.
Key resistance sits at 3913–3915, suitable for short-term scalping sells.
🎯 Trading Scenarios
Buy scalping: 3845 | SL 3839 | TP 3856 – 3870
Buy zone (main): 3820 – 3822 | SL 3816 | TP 3832 – 3845 – 3860 – 3875 – 3890
Sell scalping: 3915 – 3913 | SL 3920 | TP 3900 – 3885 – 3872 – 3860
Buy breakout: A confirmed move above 3895 → continue buying with targets open towards 3915+
📌 Conclusion
Gold remains in a strong uptrend, supported by both fundamental and technical factors. Short-term corrections are better viewed as opportunities to build on buy positions. That said, it is important to keep an eye on nearby resistance levels to optimise entries.
👉 This is my personal perspective on XAUUSD and not investment advice.
Follow me to stay up to date with daily gold scenarios 🔥
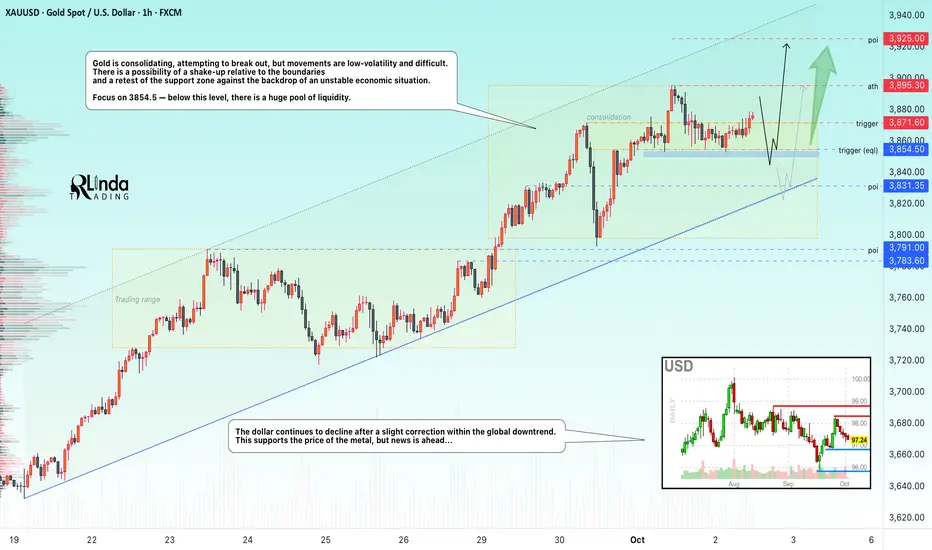
GOLD → Consolidation before growth FX:XAUUSD is correcting from 3895 and forming consolidation with a key support area at 3854, below which lies a huge pool of liquidity. A deep correction is unlikely due to ongoing risks.
The suspension of NFP publication due to the shutdown and inflation creates uncertainty for Fed policy, as does weak employment data...
However, the resumption of government work will allow the publication of data on unemployment claims and factory orders, so increased volatility in the markets is to be expected on Thursday/Friday...
The correction in gold is a temporary pause. As long as US fiscal risks, labor market weakness, and geopolitical tensions remain, the uptrend will remain intact. The $3850 level is the nearest support.
Resistance levels: 3871.6, 3895, 3900
Support levels: 3854.5, 3831.3
The most likely scenario at the moment is a long squeeze in the 3854.5 liquidity zone before continuing to rise beyond 3900...
Best regards, R. Linda!
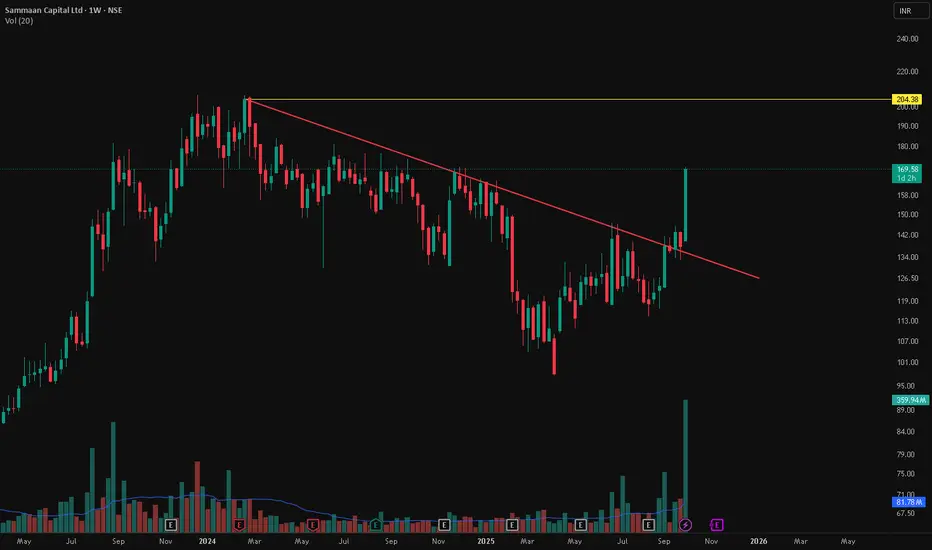
Sammaan Capital Ltd - Weekly Breakout📊 Sammaan Capital Ltd – Major Trendline Breakout with Volume Spike 🚀
📅 Chart Date: October 2, 2025 | Timeframe: Weekly
📍 CMP: ₹169.58 (+23.04%)
📈 Symbol: NSE:SAMMAANCAP
🔍 Technical Analysis
📉 Multi-Month Downtrend Broken
Stock has been consolidating under a falling trendline since late 2023.
This week, price gave a clean breakout above the trendline with a strong bullish candle.
💥 Volume Confirmation
Current Weekly Volume: 359.94M vs Avg 81.78M 🔥
Indicates strong institutional participation.
🟡 Key Resistance
Next major hurdle is ₹204.38 (previous swing high).
Sustained closing above this zone can open doors for higher levels.
📌 Key Levels
Immediate Support (Breakout Retest): ₹142–₹150
Resistance Zone: ₹204.38
Potential Next Targets: ₹220 / ₹250
Stop loss for Swing Trades: ₹135
BTC consolidates after a significant price spikeBITSTAMP:BTCUSD price has had a slight correction after the previous increase.
Yesterday, the price broke the trendline and the EMA approached, creating a momentum accumulation zone before a strong break - as planned to buy.
Currently, BTC is correcting after the increase, just cutting down the EMA, showing that buying power is weakening, the short-term trend may turn down.
There is no clear signal to enter the order. Continue to observe the price reaction around the EMA and wait for a clear setup before taking action.
You can refer to my previous analysis here:
Please like and comment to support our traders. Your feedback motivates us to produce more analysis in the future 🙏✨

XAUUSD – Holding the Primary Uptrend (BUY Bias)
Hello traders,
On the H4 timeframe, gold continues to demonstrate a sustained upward trajectory. After testing the upper trendline, price rebounded and is now consolidating around the 386x region. This suggests the market is in an accumulation phase, awaiting key news.
Fundamental Context
Tomorrow’s release of Nonfarm Payrolls (NFP) data is expected to be a major driver of volatility in gold.
Meanwhile, the uncertainty surrounding a potential US Government shutdown adds to macroeconomic instability, reinforcing gold’s role as a safe-haven asset.
At present, there is little justification for a decline in gold, especially as broader markets are also breaking higher.
Technical Analysis
Price remains within the ascending channel on H4, with buyers still in control.
The MACD indicator is above the zero line, showing no significant weakness.
Price is likely to consolidate within the 3860 – 3870 band before any strong move triggered by news.
Trading Plan
Buy Setup (priority – trend aligned)
Entry: 3829 – 3832
SL: 3825
TP: 3845 – 3862 – 3877 – 3890
Sell Scalping (counter-trend, high risk)
Entry: 3927 – 3930
SL: 3934
TP: 3915 – 3900 – 3882 – 3865
Note: Sell trades should be treated only as short-term scalps, as the dominant bias remains bullish.
Conclusion
Gold continues to respect its bullish structure, with no clear signs of weakness. Against the backdrop of political uncertainty and the forthcoming NFP release, the priority remains buying from favourable support zones. Any sell positions should be viewed purely as short-term reactions.
👉 Follow me for timely updates whenever price structure shifts.

GOLD M30 – SHORT-TERM SETUP (NEW YORK SESSION UPDATE)Hello traders 👋
On the M30 chart, the ascending trendline shows signs of a breakdown. However, the bearish momentum is not yet convincing, as selling volume remains relatively weak. This suggests caution, but also highlights a possible short-term pullback opportunity.
🔎 Key Level to Watch
The 3,855 – 3,860 zone is the critical confirmation area.
A decisive break below this level would strengthen bearish momentum and open the way for deeper downside.
⚖️ Trade Idea
🔴 Short-term Sell Setup:
Entry: 3,880 – 3,878 (on a retest of the broken trendline)
Stop loss: 3,885
Take profit: 3,862 → 3,845 → 3,822
👉 Note: This is a counter-trend trade. Wait for clear rejection candles at the entry zone to improve the win rate.
📊 Market View
The broader trend remains bullish, but short-term weakness on M30 suggests a corrective move may be unfolding.
Sell setups should be treated as scalps, while dip-buying remains the higher-probability strategy in line with the main trend.
📌 Conclusion:
For the New York session, watch for a potential corrective drop. Selling near 3,875 – 3,878 could provide short-term opportunities, but strict risk management is essential as this setup goes against the prevailing trend.

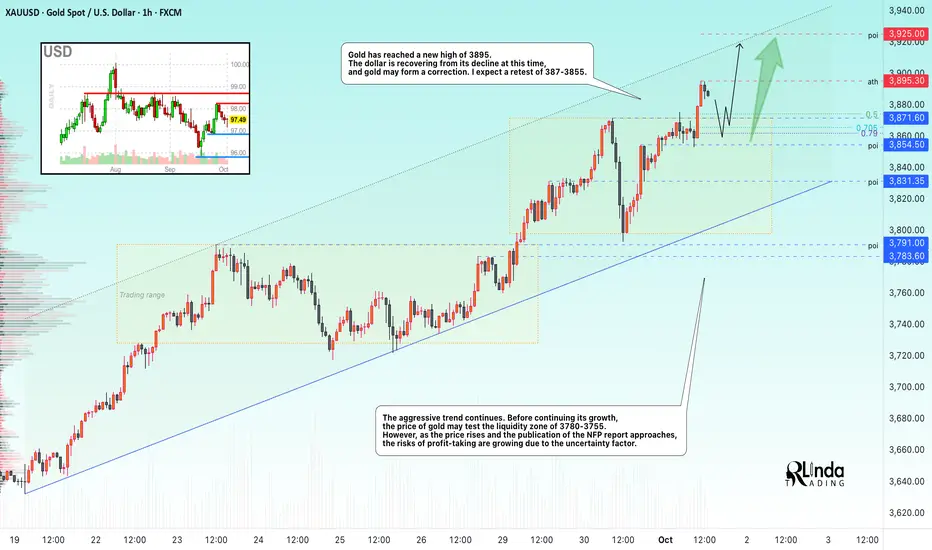
GOLD → Correction before growth and breakthrough of 3900...FX:XAUUSD has reached a new high of 3895. The dollar is recovering from its decline, and gold may form a correction. As prices rise, economic risks associated with NFP and the US government shutdown are increasing
The suspension of NFP publication deprives the Fed and markets of a key benchmark for the labor market, increasing demand for defensive assets. The probability of a rate cut in October is estimated at 100%. Mixed JOLTS data (weak hiring) and fiscal risks are weighing on the USD, which in turn supports gold.
Thus, the shutdown creates ideal conditions for gold to rise — uncertainty about Fed policy, a weaker dollar, and a flight to safety. Breaking through the $3900 level seems a likely scenario.
Resistance levels: 3900, 3925
Support levels: 3871, 3854, 3831
A correction is forming after a small rally in the European session. Before continuing its growth, the market is entering a correction/consolidation phase. I have indicated the key support levels on the chart. If the bulls manage to keep the price above these zones, then we can expect continued growth in the short and medium term
Best regards, R. Linda!
NZDCAD → A false breakthrough will trigger a decline FX:NZDCAD is forming a countertrend correction with the aim of retesting key resistance and the liquidity zone amid a global downtrend.
A reaction to the support zone is forming. The price is recovering, but within the global downtrend. The countertrend movement may end in the resistance zone of 0.811 - 0.8125
The global trend is downward, but we are seeing a rebound within the retest of the channel support. There is a fairly large pool of liquidity ahead, which is capable of stopping the price from rising at a high speed. A false breakout of 0.811 - 0.8125 could trigger a decline.
Resistance levels: 0.811 - 0.8125
Support levels: 0.8056, 0.8030
A false breakout, consolidation below the specified zone, and a price close below the level could trigger a further decline.
Best regards, R. Linda!

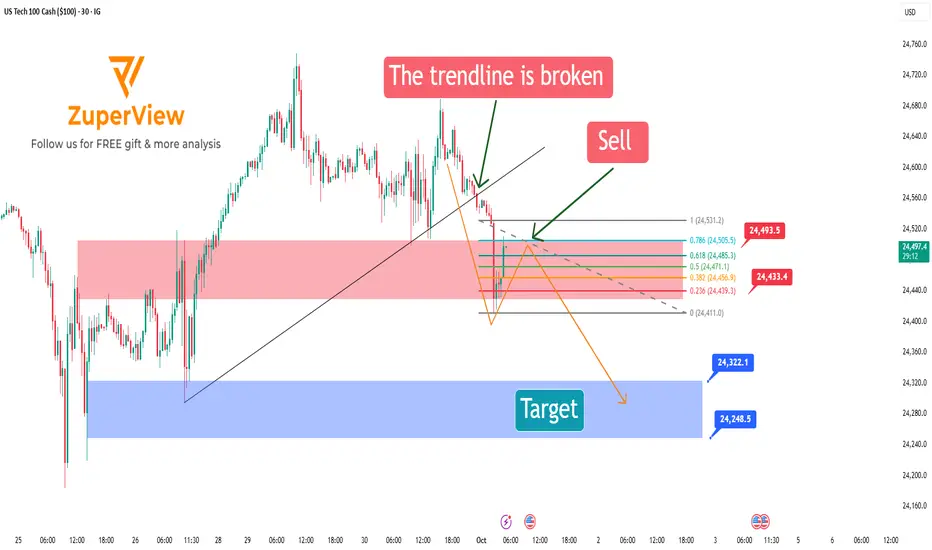
US100: Short setup using fib levels from flash candleIG:NASDAQ m30 chart analysis: short action!!
The chart signals a potential short opportunity after breaking the previous bullish structure and printing a strong bearish flash candle. The strategy focuses on shorting the pullback using fibonacci retracement measured from that candle.
🔺 1. Structure break and flash candle confirmation
The price broke below the rising trendline supporting the bullish move from sep 26 to sep 30.
Immediately after, a large bearish flash candle appeared — signaling strong selling pressure and a potential trend reversal.
This candle becomes the reference point for measuring the retracement and anticipating a continuation to the downside.
📏 2. Measuring fibonacci from the flash candle (high → low)
Apply fibonacci from the high to the low of the flash candle.
This technique identifies potential resistance zones within the context of that specific bearish move.
Key fibonacci levels to watch:
0.5: 24,472.0 | 0.618: 24,486.4 | 0.786: 24,506.9
🎯 3. Ideal entry zone: from 0.382 to 0.786
After a strong bearish flash candle, price often pulls back moderately before continuing lower.
The optimal short zone is between fibo 0.382 and 0.786:
This respects the integrity of the bearish impulse.
A retracement smaller than 0.382 may be too shallow to confirm a strong rejection.
A retracement beyond 0.786 might indicate loss of bearish momentum and invalidate the flash candle setup.
🎯 4. Bearish scenario and targets
If price reacts at the 0.382–0.786 zone and resumes downtrend, a potential ABC bearish correction forms:
A: Flash move down
B: Pullback to fib zone
C: Next impulsive leg down
Suggested take-profit levels:
🎯 Target 1: 24,322.1
🎯 Target 2: 24,248.5
🛡️ Stop-loss: above the flash candle’s high (around 24,533)
✅ Summary
After a structure break and a decisive bearish flash candle, us tech 100 is showing a clear bearish setup.
Using fibonacci measured from the high to low of the flash candle helps identify high-probability pullback zones.
📌 Entry zone: between 0.382 and 0.786 retracement — outside this range, the flash candle's power may be invalidated.
This is a momentum-following trade with defined entry, stop loss, and take profit zones.
Wait for confirmation from price action within the fib levels before entering.
Please like and comment below to support our traders. Your reactions will motivate us to do more analysis in the future 🙏✨
Harry Andrew @ ZuperView
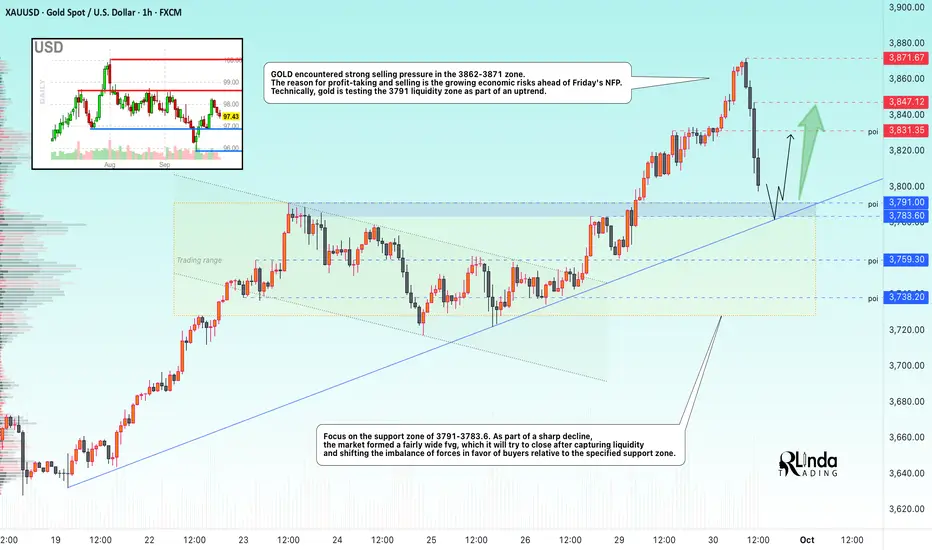
GOLD → Liquidation, but there is still a chance for growth...FX:XAUUSD has reached a new all-time high of 3871.6, marking its best month in 14 years (+12% in September). However, against the backdrop of high risks, the market is experiencing profit-taking and a deep correction. What next?
The high probability of a shutdown from October 1 is weighing on the dollar. The probability of a Fed rate cut in October is 90%, despite cautious comments from the Fed.
New tariffs on timber and furniture (from October 14).
Data from China: PMI growth (Manufacturing to 51.2). All this supports the bullish trend in gold. However, the end of the quarter, anticipation of NFP (but in the event of a shutdown, the publication of employment data will be suspended).
Technically, as part of the correction, the price is testing the upward support line, and the price reaction to the 3790-3780 zone will give hints about further movement...
Support levels: 3791, 3783
Resistance levels: 3831, 3847
A false breakdown and the formation of a reversal pattern relative to the specified support zone could trigger a recovery phase within the bullish trend. However, a quick return to support could trigger an attempt to break through and correct to 3759-3738.
Best regards, R. Linda!
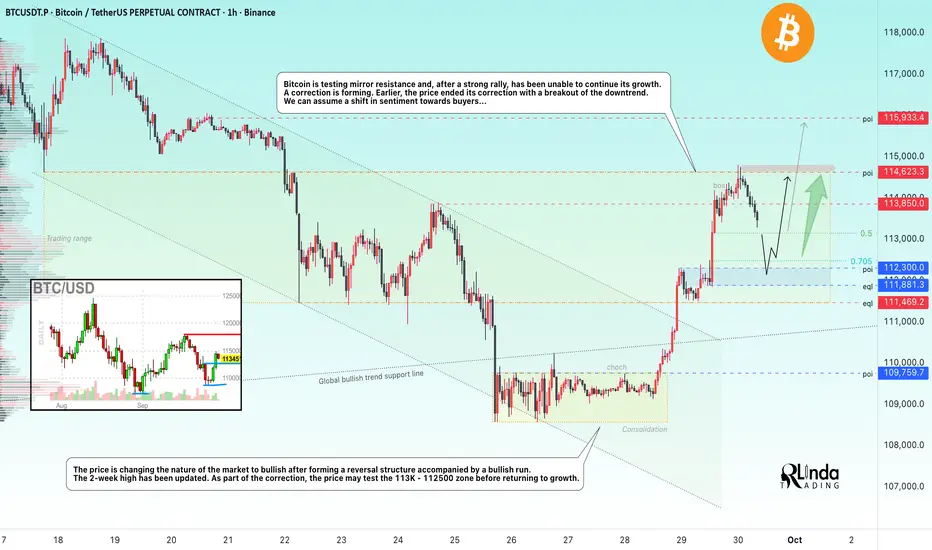
BITCOIN → Correction before the breakout of 114.5KBINANCE:BTCUSDT , after the end of the correction, is forming a 3.5% rally and testing the important milestone of 114,600. It was not possible to break through the level without consolidation and at such a high speed. How long will the correction last?
Bitcoin is testing mirror resistance and, after a strong rally, was unable to continue its growth. The reason for the halt is a huge liquidity pool above 114,600. A pullback is forming. Earlier, the price ended a 3-week correction by breaking through the downward resistance. We can assume a change in sentiment towards the buyer...
Technically, the price is changing the nature of the market to bullish after the formation of a reversal structure accompanied by a bullish run. The 2-week high has been updated.
Resistance levels: 113850, 114620, 115900
Support levels: 113100, 112300, 111800
As part of the correction, the price may test the 113K - 112500 zone before returning to growth. If the market holds the price above 112K - 113K, it will confirm the bullish sentiment, and the positive fundamental background will support further growth.
Best regards, R. Linda!
XAUUSD – U.S. Government Shutdown Pressure on GoldHello Traders,
For the first time since 2018, the U.S. government faces the risk of a shutdown. This can only be avoided if Congress passes new funding legislation, but the timing remains uncertain. This political backdrop is exerting strong pressure on the financial markets, and gold – the traditional safe haven asset – has become the focal point for investors.
Technical Perspective
Gold continues to set new ATHs right in the Asian session today, indicating the uptrend remains intact.
The upward price channel on H4 maintains a beautiful structure, with the main trend continuing to favor buying.
Yesterday's decline was merely a "liquidity sweep," after which the price quickly returned to its upward momentum.
Short positions can be considered when the price hits strong resistance, combining Fibonacci + Trendline, to optimize winning probabilities.
Trading Scenario
Sell (short-term at resistance):
Entry: 3884 – 3886
SL: 3890
TP: 3872 – 3860 – 3845 – 3830
Buy (in line with the main trend):
Entry: 3820 – 3823
SL: 3816
TP: 3835 – 3850 – 3862 – 3880
Conclusion
Gold remains strongly supported by the political instability in the U.S.
The medium-term strategy continues to prioritize Buying at support zones, while Selling should only be considered when there is a clear reaction at resistance zones.
Traders need to closely monitor political news, as any developments related to the U.S. government can alter gold's short-term structure.
Follow me for the fastest updates on new scenarios as price paths change.

LiamTrading – Gold continues its “madness”LiamTrading – Gold continues its “madness”: Strong trend, but awaiting reaction at 3900
Gold has just recorded its 39th all-time high in 2025, now approaching the 3,900 USD/oz mark. This is not only a significant psychological threshold but also coincides with extended Fibonacci levels, making this area a sensitive market point.
Trend & Trendline
On the H4 chart, gold remains firmly within the upward channel formed since early September. Prices consistently bounce off the lower trendline and expand towards the upper boundary.
The lower trendline around 3760–3780 acts as dynamic support. If prices break below this area, a deeper correction scenario towards 3720–3730 will be triggered.
The upper trendline is currently “pressing” prices right at the 3897–3900 area, converging with Fibonacci 2.618. This is a strong resistance, potentially causing profit-taking reactions and creating a technical pullback.
Volume Profile & Liquidity
The 3800 and 3720 areas are dense volume clusters, indicating that large capital flows are positioned here. These are also potential Buy zones when prices correct.
The 3640–3650 area is a larger liquidity cluster, but will only be activated if there is a strong breakdown from the current trendline.
Reference Trading Scenario
Sell zone: 3897 – 3900, SL 3905, TP 3885 – 3862 – 3850 – 3833
Short-term Buy zone: 3797 – 3800, SL 3793, TP 3822 – 3840 – 3855 – 3872 – 3890
Medium-term Buy: 3720 – 3730, SL 3710, TP 3760 – 3800 – 3850
Conclusion
The upward trend remains very strong, but the 3897–3900 area will be a crucial challenge. If prices are rejected here, we may witness a correction back to the lower trendline before gold continues towards the larger target of 4000 USD.
This is my personal view on XAUUSD. Please manage risk carefully and stay updated with the latest scenarios.

NZDUSD → Rebound from support. Focus on 0.5800FX:NZDUSD is undergoing a correction amid a rebound in the US dollar, testing trend support and forming a reversal pattern. The fall in the dollar may support price growth.
The dollar is correcting, which gives the forex market a chance. After retesting the support of the downtrend, the New Zealand dollar is forming a rebound. A reversal pattern and a breakout of resistance at 0.58 will return the price to the trading range, confirming a false breakdown of support and potentially triggering growth.
The global trend is neutral, and locally we have the boundaries of a downward channel. However, a false breakout of trend support could shift the angle of imbalance towards the buyer, allowing the price to rise.
Resistance levels: 0.580
Support levels: 0.5771, 0.575
A breakout of resistance at 0.58 and a close above this level would be a strong signal of readiness for growth. However, before that, the price may test support at 0.5771 (break-even zone).
Best regards, R. Linda!
