Red TL saves the day!Pretty much as the title says, the red TL held via the candle closing below. Took the TL on the 4H TF but it's holding on 1h & daily. As the USD is rising and looking like going for $100+ this should help gold to dump. I'm in again at 1948 with SL on entry.
Trendlinesuport

Will XTZ recover ?XTZ is trading in an ascending channel (Log Chart) since February 2020. Both trendlines was tested several times in the past.
There are many multiple factors that affect all markets last days or weeks, like events on Canada, Biden’s crypto executive order or Russia – Ukraine conflict, etc.
At the time of writing this report, XTZ is trading at $3.17, a further drop to $3.00 – 2.54 is possible, but not certain.
A trendline breakdown, at its own, is not the proof of reversal.
A break and close below the in the 1W TF may result in a deeper breakdown to $2.10.
In the long run, with the current situations there is no worrying signs for a bearish reversal in the market.
For long positions:
Take profit targets are: $13.21, $15.73, $19.81
Stop loss or alerts below previous week or month low depending on your time horizon.
In any case R/R ranges from 8.39 to 21.77. Consequently, it is a worthwhile trade/investment.
Resistance zones in a new update.
If I help you with your trading plan, like, follow me for more ideas & in my social media for more updates in the crypto market.

Long Term View on USDJPYWe are still respecting the long term channel on this pair. I am watching this pair for a bounce from the top of the range to support level.

SURYA ROSHNI TRENDLINE + 30 WEEK EMA SUPPORTNSE:SURYAROSNI is standing on its 1 year old trendline from which it has taken support 7 times.
It has now taken its 8th support and looks like a good buy from here.
The trendline was broken once but the bears wear trapped and the stock quickly climbed back.
More buying can take place if stock gives breakout from the marked rectangle region, at price of 690-710 levels. From there it can test it's all time high of 860-870 levels.
If stock sustains above all time high, it can be a good buy and hold.

GBPUSD Watchout level defined FX:GBPUSD
Watch out level is presented here for either side of trend
Indications for either Bulls or Bears have been mentioned on chart
My view is to watch out 0.382 Fib level (1.33699). Then decide accordingly. If sustained this level, it might be the end of downward trend.
Price may retrace down before start uptrend, as slight divergence is observed on 1H RSI(14).
On 1D timeframe, morning star appeared followed by spinning top, at 1D trendline support. The pair is moving in 1D channel S&R. Currently it took support from 1D trendline, but still it is at key area of value around 1.33488.
If it continues downward trend, then further support might be around 1.31933.
Please comment below for any suggestion, follow and hit like button if you like the idea.
Thanks

COTI MASSIVE MOVE COMINGKeep HODL massive move ahead. profits on the way Keep HODL massive move ahead. profits on the way

Bitcoin 1h Chart Bullish movement expected:
Momentum changed
Also, RSI confirms the bullish movement
Range box bottom ($44000 to $44300) is very strong support and touched early
I could ignore the last day's pump and dump
Strong candles not expected
If the price breakdown the $44k support with a confirmation candle, the next stop will be near $41k.
Trend Key Points Indicator have been used to draw important key levels and key points.

bank nifty @its trendline support.. important levels markedwe can see bank nifty at its trendline support. will go long if it breaks its short time resistance on 36900

BNB > Trendline Support > Bull Run? Potential Target?Hello Friends,
Hope you all are having a thrill in your trading journey.
I am presenting you my analysis of Binance Coin.
According to my technical analysis, BNB is following a trendline support. Now, we are expecting a fall to trendline and a rise!
"My analysis is valid until We don't see a breakout from trendline"
I hope my analysis is pretty clear to you guys.
Kindly do your own research and follow proper risk management.
Feel free to share your views in the comment section. Like and Follow!
Best Regards,
Shaswat Naman
TradeThrill, India🇮🇳
Disclaimer: The analysis provided is purely informative and it should not be used as financial advice. Remember that you need a plan before you start trading; so, take this knowledge and use it as a guidebook that will ultimately help you understand the market and easily predict your next move.

CELR > Trendline Support > Next Opportunity to long again?Hello Friends,
Hope you all are having a thrill in your trading journey.
I am presenting you my analysis of CELR.
According to my technical analysis, CELR is following a trendline support. Now, we are expecting a fall to trendline and a rise!
"My analysis is valid until We don't see a breakout from trendline"
I hope my analysis is pretty clear to you guys.
Kindly do your own research and follow proper risk management.
Feel free to share your views in the comment section. Like and Follow!
Best Regards,
Shaswat Naman
TradeThrill, India🇮🇳
Disclaimer: The analysis provided is purely informative and it should not be used as financial advice. Remember that you need a plan before you start trading; so, take this knowledge and use it as a guidebook that will ultimately help you understand the market and easily predict your next move.


CTK > Rising Wedge > Jump? Potential Target?Hello Friends,
Hope you all are having a thrill in your trading journey.
I am presenting you my analysis of CTK.
According to my technical analysis , CTK is following a trendline support, creating a rising wedge . Now, we are expecting a rise till next resistance.
"My analysis is valid until We don't see a breakout from channel"
I hope my analysis is pretty clear to you guys.
Kindly do your own research and follow proper risk management.
Feel free to share your views in the comment section. Like and Follow!
Best Regards,
Shaswat Naman
TradeThrill, India🇮🇳
Disclaimer: The analysis provided is purely informative and it should not be used as financial advice. Remember that you need a plan before you start trading; so, take this knowledge and use it as a guidebook that will ultimately help you understand the market and easily predict your next move.

TLM > Parallel Channel & Trendline Support >time for a Bull-Run?Hello Friends,
Hope you all are having a thrill in your trading journey.
I am presenting you my analysis of TLM.
According to my technical analysis, TLM is moving in a parallel channel . Now, we are expecting a rise till next resistance.
"My analysis is valid until We don't see a breakout from channel"
I hope my analysis is pretty clear to you guys.
Kindly do your own research and follow proper risk management.
Feel free to share your views in the comment section. Like and Follow!
Best Regards,
Shaswat Naman
TradeThrill, India🇮🇳
Disclaimer: The analysis provided is purely informative and it should not be used as financial advice. Remember that you need a plan before you start trading; so, take this knowledge and use it as a guidebook that will ultimately help you understand the market and easily predict your next move.


READY FOR LIFTOFF?Lookin at a decending wedge, you have price touching the bottom trendline of a rising channel.If price falls below this zone your looking at the next zone below between $1.85-$1.61. Coming closer to the bottom of this wedge I don't see price retesting the lower trendline of the wedge, but anything is possible. 1st target looking at $9.75, if we get past that I'm projecting a 2nd tarjay @ $19.00, where we have the next major monthly supply zone and some resistance. Let me know your thoughts.

What are Trend Lines?Trend lines are lines that are drawn on the charts connecting a series of prices together . They helps traders to find the further support and resistance .
Further there are two types of Trend Lines:
1. Body to Body Trend lines .
2. Wick to Wick Trend lines .
How often you use Trend Lines?
Lets us know what you think about this educational idea in comments!

KENNAMETAL INDIA LTD.Enter when the price reaches the uptrending support line and hold for more than 6 months atleast. it will blow up.


$CNCIts possible price can bounce off trend line support. The support has been pretty strong. It does look as though price is forming an H&S as well so be cautious and let price develop. If price does bounce off its possible price can head towards resistance possibly forming an ascending triangle. Its also possible price can break through trend line support and sell off some.

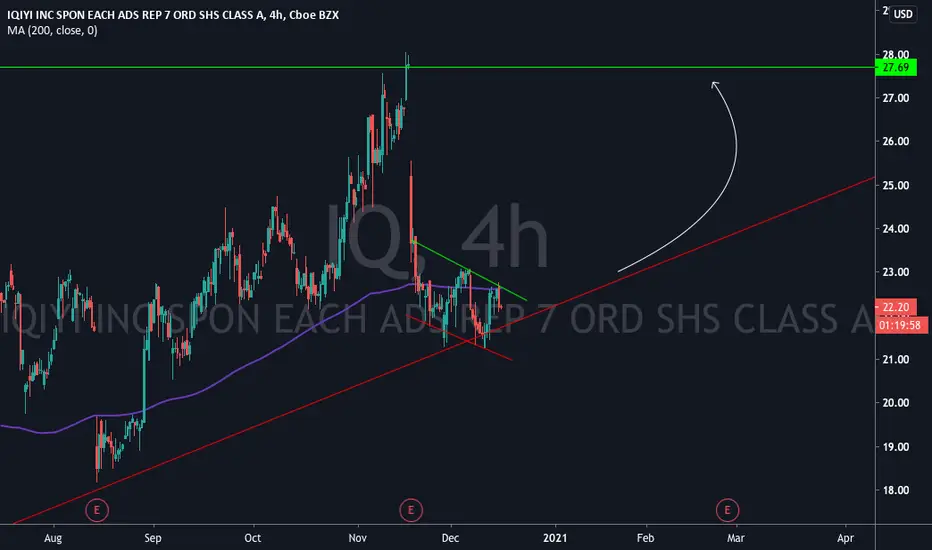
$IQIts possible price can head back up, price is at trend line support and possibly forming an descending channel towards the support of the trend line. Price could possibly head back up to the resistance. Its possible price could be forming an ascending triangle as well
RLCBTC. Resistance becomes support.RLCBTC 1H. Trendline resistance becomes support and on the 1 hour chart price may soon find itself sitting on the 200EMA. With this confluence of factors including horizontal support I am looking at a long trade once & if this candle closes above the 200.

GM: Don't bet against Pickemup Trucks!Cyclical stock, truck sales booming online with retail stores closed, lol. Buy em sight unseen, delivered to your door!
Downside at the gap from 22.68, could fill, would be a buy opp if it does. H&S pattern evident, stock had unsupportable runup, trades at fair value.
Either get a bounce from $25 headed back to $35, then $40 at cyclical highs, or 10% correction to fill gap then bull again IMO.
In the Aug $25 calls, short Jul 28s in $3 bull spread for under $2 premium. Keep shorting weeklies against the long contracts to pay for them.
Bought shares in a covered write as well.
Just an idea; not investing advice; trade at your own risk! GLTA!

GBPJPY TA : LONG Whats up people, The H4 candle shows signs of bullish energy, the 14ema also acts as a support zone for long position and its a fib long as well.
