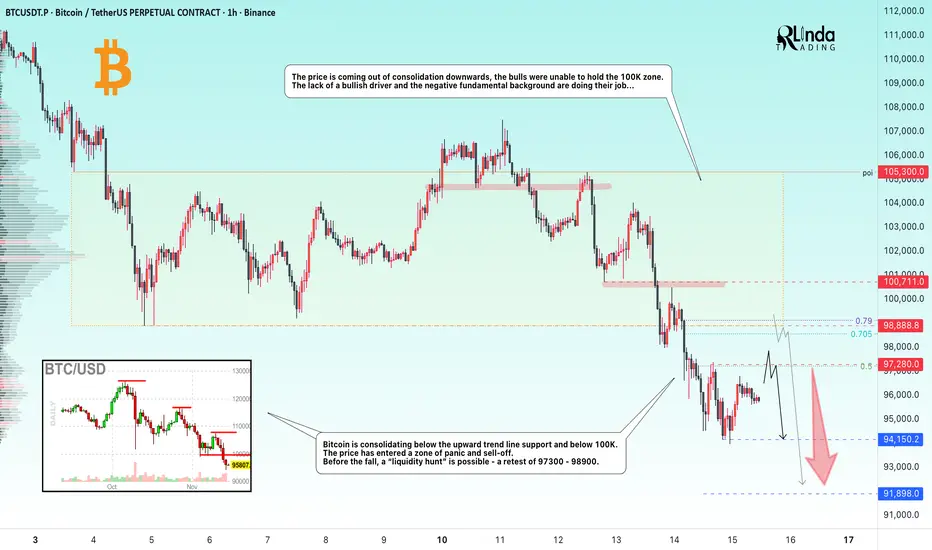
BITCOIN → 100K broken. Consolidation in the short zone...BINANCE:BTCUSDT.P broke through the 100K support level and is consolidating within the local range of 94,150 - 97,280. The decline may continue if the market does not receive support (news or other bullish drivers).
Bitcoin is consolidating below the upward trend line of support and below 100K. The price has entered a zone of panic and sell-off. Before the fall, a “liquidity hunt” is possible - a retest of 97300 - 98900.
The price is coming out of consolidation downwards, the bulls were unable to hold the 100K zone. The lack of a bullish driver and the negative fundamental background are doing their job...
Resistance levels: 97280, 98900, 100700
Support levels: 94150, 91900
Before further decline, the market may test the previously broken support zone relative to the upward lower trend line. Focus on the 97280 - 98990 zone. A false breakout and lack of bullish momentum could form a reversal pattern and trigger a decline to 94150 - 91900.
Best regards, R. Linda!
Triangle
GOLD → Retest 4050 in a weak market...FX:XAUUSD is bouncing off support at 4000 and forming a correction towards 4050, an important resistance level. The market's main focus is on the September employment report (NFP), which will be released on Thursday.
Key pressure factors:
The strong dollar is supported by hawkish statements from the Fed and risk aversion. The probability of a rate cut in December has fallen to 42%.
Support for gold: Demand for government bonds has lowered the yield on 10-year Treasuries, allowing gold to rebound to $4045.
A series of negative labor market reports keeps risks alive.
Gold remains under pressure. A break below $4000 will open the way to $3950, while a rise above $4050 will require weak NFP data or dovish Fed rhetoric. The week will determine the direction
Resistance levels: 4050, 4090
Support levels: 4000, 3965
The market is beginning to doubt the local bullish structure. Strong trend support is breaking down and the previously broken level is being retested. If the bears keep the price below 4045-4050, gold could continue to decline. However, it is worth keeping an eye on the news in the second half of this week...
Best regards, R. Linda!

BTCUSD: Buyers Aiming for a Move Toward 99,000 ResistanceHello everyone, here is my breakdown of the current Bitcoin setup.
Market Analysis
BTCUSD has recently completed a strong downward phase inside a well-defined Downward Channel, where price continuously formed lower highs and lower lows. After reaching the Support Zone around $94,500–$95,200, buyers stepped in and created a fake breakout, followed by a quick recovery — a sign of weakening seller pressure. Following this rebound, Bitcoin formed an Inverse Head and Shoulders pattern, confirming a potential bullish reversal. Price has now broken above the Triangle Resistance Line, signaling the first structural shift from bearish to bullish.
Currently, BTCUSD is consolidating just above the $95,500–$96,000 support zone, which now acts as a retest area for the breakout. As long as BTC stays above the Triangle Support Line, bullish momentum remains intact, and the market structure favors further upward movement. The nearest target for buyers is the $99,000 Resistance Zone, which previously acted as a strong supply area. A successful breakout above $99,000 would confirm bullish continuation and open the way toward higher resistance levels. If price fails to hold above support, a short-term pullback toward the lower triangle boundary may occur before buyers try to regain control.
My Scenario & Strategy
I expect BTCUSD to maintain its bullish bias as long as price trades above the Triangle Support Line and the key support zone. Potential long entries remain valid on retests of the $95,500–$96,000 area, with a primary target at the $99,000 Resistance Zone (TP1).
A confirmed breakout above $99,000 would strengthen bullish momentum and open the next leg upward. However, a breakdown below the triangle structure may lead to a deeper correction toward $94,500. For now, sentiment remains bullish, and Bitcoin appears ready for a continued recovery within the new reversal structure.
That's the setup I'm tracking. Thank you for your attention, and always manage your risk.

GOLD → Consolidation while awaiting the driverFX:XAUUSD is consolidating after a sharp decline. Bulls are consolidating above 4050. Important US data is ahead, including the employment report (NFP) on Thursday.
Decrease in bets on Fed easing: The probability of a cut in December has fallen to 46% (from 67% a week ago) after cautious statements by Fed officials. However, we have not yet seen inflation and employment data, so the situation may change... The September NFP report will be released on Thursday after a 43-day hiatus.
The market is waiting for clarity from the US data. Weak indicators (NFP, inflation) could bring back interest in gold, while strong data would strengthen the dollar and reinforce the correction.
Gold is in the $4030–4100 range. A break above $4100 will require weak US data or unexpectedly dovish rhetoric from the Fed. The $4030–4045 level is key support.
Resistance levels: 4097, 4110
Support levels: 4071, 4046, 4032
I think the market may remain in the current range while awaiting economic data or other drivers. A correction to support may form from resistance. It is important to monitor the levels from below; if the bulls keep the price above support during the correction, gold will be able to strengthen...
Best regards, R. Linda!

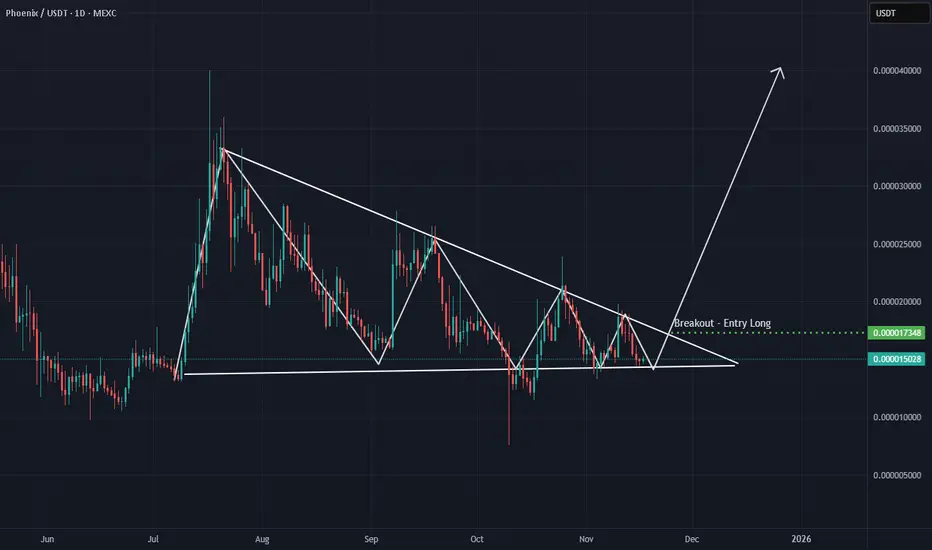
PHNIX 1D CRYPTOCAP:PHNIX 1D
Symmetrical Triangle forming above strong multi-touch support.
A breakout above $0.0000173 would confirm a bullish continuation.
Structure looks like bullish consolidation, but confirmation is required above the trendline.
#PHNIX #YodaXCalls #Crypto
XAUUSD 2 scenariosThe U.S. dollar remains strong 💵, supported by firm economic data, resilient labor markets, and expectations that the Federal Reserve will maintain higher interest rates for longer. This strength is adding pressure to many major currency pairs and increasing volatility as price consolidates inside a triangle formation.
Bearish scenario 📉:
If the triangle breaks to the downside, price could move toward the lower boundary of the ascending channel, where buyers have previously stepped in. A bearish breakout would likely align with stronger USD momentum, higher Treasury yields, or risk-off sentiment.
Bullish scenario 📈:
If price manages to break the triangle to the upside, we would then look for the upper region of the ascending channel, supported by potential USD weakness, softer economic data, or dovish signals from the Fed.
With patterns like this, discipline is key — never enter prematurely. Always wait for a confirmed breakout and retest, as entering too early often means becoming the liquidity for larger players.

EURUSD: Breakout Structure Supports Move Toward 1.1650Hello everyone, here is my breakdown of the current Euro setup.
Market Analysis
EURUSD is showing a clear bullish shift after breaking out of multiple downward structures and reclaiming higher support levels. The chart highlights several key phases: a prolonged decline inside two consecutive Downward Channels, followed by confirmed breakouts, each signaling weakening bearish momentum. After the second downward channel breakout, EURUSD established a stable bullish structure, forming an ascending move supported by the Triangle Support Line. Price has been consistently creating higher lows along this line, indicating strong buyer presence.
Currently, EURUSD retraced back toward the Triangle Support Line after being rejected from the major Resistance Area around 1.16500. This zone has acted as a key supply region multiple times, and it also aligns with the Triangle Resistance Line, making it a significant confluence area. As long as price remains above the ascending support, the bullish structure stays intact. The overall market behavior shows healthy correction patterns followed by breakouts, suggesting that buyers remain in control, with momentum gradually building toward the upper resistance once again.
My Scenario & Strategy
I expect price to rebound from the current correction zone and attempt another move toward the 1.16500 Resistance, which is the next major decision point. A successful breakout above 1.16500, followed by consolidation, would signal a bullish expansion and could open the path toward higher targets in the coming sessions.
However, if EURUSD breaks below the Triangle Support Line, the current bullish structure would weaken, and price may return to lower support areas before buyers attempt another recovery. For now, structure remains bullish, and pullback-based long entries continue to offer the best opportunity while price respects the rising support trendline.
That's the setup I'm tracking. Thank you for your attention, and always manage your risk.

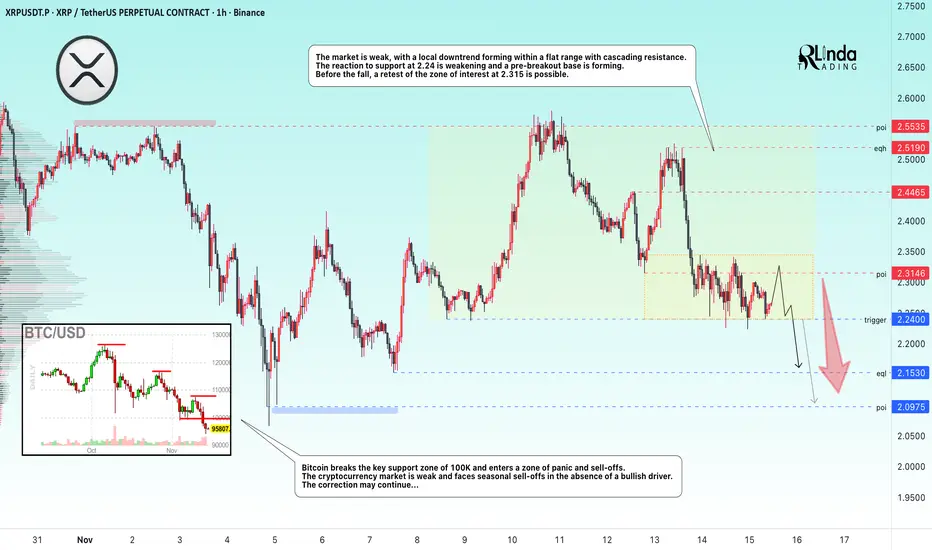
XRPUSDT → Consolidation before breaking through support BINANCE:XRPUSDT continues to storm the 2.24 support level amid a downtrend and a weak market. There is no bullish driver, and the fundamental background is also weak...
Bitcoin breaks through the key support zone of 100K and enters a zone of panic and sell-offs. The cryptocurrency market is weak and facing seasonal sell-offs in the absence of a bullish driver. The correction may continue...
XRP is forming a local downtrend with cascading resistance within a flat. The reaction to the 2.24 support is weakening and a pre-breakout base is forming. Before the fall, a retest of the 2.315 zone of interest is possible.
Resistance levels: 2.315, 2.4465
Support levels: 2.24, 2.153, 2.097
A false breakout of 2.3146 could trigger a further decline, but a close below 2.153 could trigger a sell-off and a subsequent decline to the 2.153-2.097 zone.
Best regards, R. Linda!
GBPJPY higher bullish expectations
OANDA:GBPJPY trend based analysis, currently price in ASCENDING TRIANGL, from here expecting higher bullish continuation.
SUP zone: 202.500
RES zone: 204.500, 205.000

BITCOIN FALLING?What is your thoughts on Bitcoin?
Theres been a 3 touch on Resistance where price caused a ATH! Signaling a bear reversal, as liquidity formed a decending triangle price might bro the Trendline support also touching a double bottom on support! Breakouts are lucky to occur, the plan is to join the trend and hop on the supply ZONE all the way down!
Profit target not set! But the market rewards those who waits ✋️

USDJPY at 155: Intervention Threats & A Possible Big DropRecently, the Bank of Japan has been dropping hints that they might be gearing up for intervention on the USDJPY because of the yen’s ongoing weakness. The 155 level keeps coming up, which has a lot of traders on alert. But here’s the thing—while intervention does happen and the BOJ has stepped in before, a lot of this type of talk is what we call jawboning. It’s basically a way to spark a little fear and trigger a market reaction without actually doing anything… yet.
From a technical standpoint though, things are genuinely interesting. USDJPY is sitting inside a descending triangle on the weekly chart, and price is currently reacting off its third consecutive lower high. So if these intervention rumors pick up steam—or if upcoming U.S. data shifts the narrative back toward potential rate cuts instead of the now-expected hold—we could see this pair open up a really clean path to the downside.
If you have any questions, comments, or just want to share you ideas, please do so below.
Akil

GEV ProjectionMultiple confluences signaling towards an expanding diagonal correction for GEV to complete Wave 4 and then up to Wave 5.

Inside the falling wedge: H&S followed by ascending triangleWe are here looking at the end of a falling wedge, here a H&S (+double top) was formed causing the price to go down and a retest from the long term uptrend line. We bounced from this and can see a ascending triangke there. We have seen that before inside this same wedge. Will we see a breakout occur (market with orange circle) the closer we get to Dec? What else is expected for Dec? The possible end of QT (which is bullish for us)! See my linked idea also.

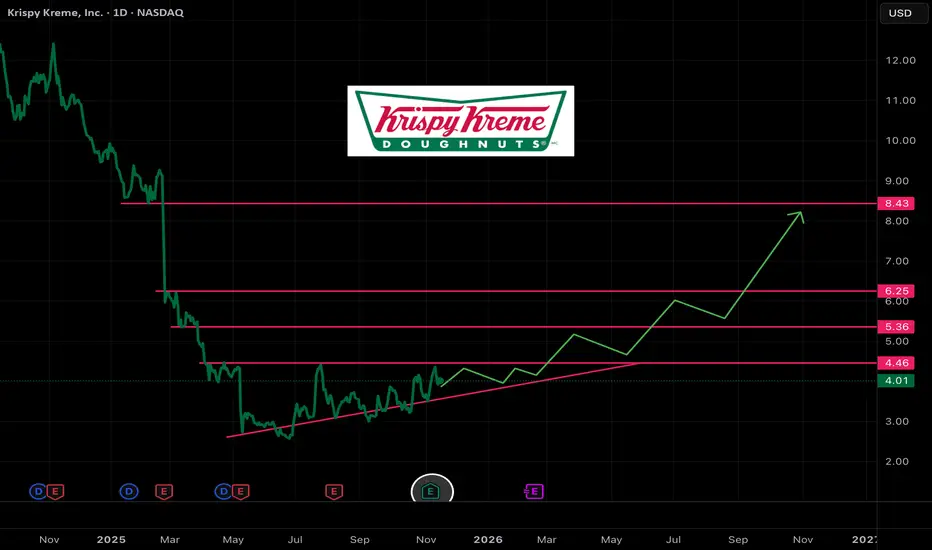
Krispy Kreme trending upward look for good entriesNASDAQ:DNUT shares are building a large ascending triangle and just had positive earnings after a slew of misses.
The shares are consolidating after touching resistance, but the uptrend appears in tact.
I've set an alert on the lower upward trend line. If the price get back there I may pick up some shares.
Looks like it could be setup to pump decently into the back half of next year.
BTCUSD: Bulls Defend $102K Zone — Eyeing Breakout Toward $107KHello everyone, here is my breakdown of the current Bitcoin setup.
Market Analysis
BTCUSD is trading within a well-defined triangle formation after a period of volatile movements between $102,500 and $107,000. The chart shows that price recently rebounded from the Triangle Support Line, aligning with the $102,000–$103,000 Support Zone, where buyers have consistently stepped in to defend this level. This zone has acted as a strong accumulation area, confirmed by multiple bounces and rejection wicks signaling absorption of selling pressure.
Currently, after a fake breakout to the downside, BTCUSD quickly recovered, retesting the Resistance Zone near $105,000–$105,500, which also aligns with the Triangle Resistance Line. This confluence area represents the next key reaction point. A confirmed breakout above this resistance would indicate a potential continuation of the broader bullish trend, while a rejection here could lead to a short-term correction back toward the support base. The market behavior shows constructive consolidation, with higher lows forming along the support trend line — a sign that buyers are gradually regaining control. As long as BTCUSD remains above $102,000, the short-term structure favors further upside movement within the triangle, aiming toward the $106,500–$107,000 resistance area.
My Scenario & Strategy
As long as Bitcoin holds above the $102,000–$103,000 Support Zone, the bullish outlook remains valid. The first upside objective (TP1) is the $106,500–$107,000 Resistance Area, where traders should watch for potential rejection or breakout signals. A confirmed breakout and close above $107,000 could trigger an extension toward $109,000–$110,000, aligning with the upper boundary of the triangle and the previous reaction zone.
However, if BTCUSD fails to hold above $102,000, this would invalidate the bullish scenario and open the way for a deeper pullback toward $100,000–$99,000, where fresh buying interest may emerge. For now, the structure supports buying pullbacks while price remains above the ascending Triangle Support Line, as momentum continues to favor the bulls.
That's the setup I'm tracking. Thank you for your attention, and always manage your risk.

GOLD → Correction and retest 4150 FX:XAUUSD still retains its bullish structure. The price is entering a correction phase within the trading range. The key support level that may attract the attention of MM is 4150.
The probability of a decline in December fell to 51% (from 63% the day before) after hawkish statements by Fed officials. Government bond yields are rising. These factors are putting pressure on gold.
However, a weak dollar, a flight to safe assets amid global market sell-offs, and uncertainty surrounding US data (September reports may be published, but October data is likely to be lost) are providing support for the bullish trend.
Gold retains its growth potential due to macro risks. A short-term correction is possible due to profit-taking ahead of the weekend, but the $4150 level remains key support.
Resistance levels: 4211, 4239
Support levels: 4161, 4150, 4100
Within the current trading range, the focus is on support at 4161 - 4148. A false breakdown and bulls holding prices above key levels could trigger a rebound and growth to local resistance levels...
Best regards, R. Linda!

EURUSD → Correction for consolidation before growth FX:EURUSD is in a “liquidity hunt” phase, testing an intermediate support level, and may continue to rise if the dollar's decline intensifies...
On the daily timeframe, the price is within a wide trading range, but at the same time, it is breaking through the resistance of the local downtrend, which allows us to observe bullish sentiment in the market. The trend is changing, and there are local confirmations of the presence of bulls in the market...
Without reaching the resistance level of the range, the price is consolidating and correcting, testing the key support level of 1.1618. If the bulls hold this area, the price will continue to rise to 1.1667 - 1.1728.
Support levels: 1.1618, 1.1577
Resistance levels: 1.1667, 1.1728
A false breakdown and price consolidation above 1.1618 could lead to a continuation of the bullish momentum and the achievement of the first key target of 1.1667.
Best regards, R. Linda!

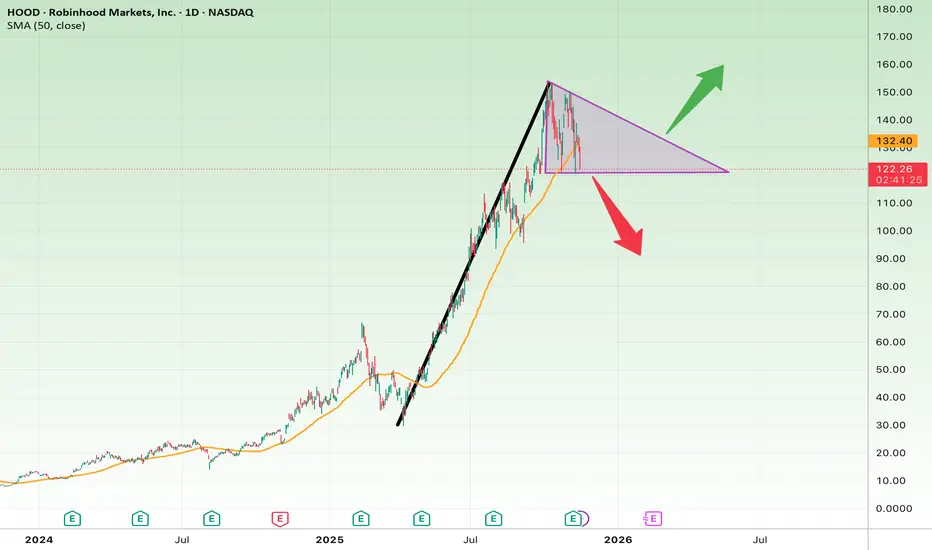
Robinhood at a Major TriangleHOOD formed a symmetrical triangle after a massive rally from ~$20 to ~$150. This consolidation now acts as a make-or-break zone.
Bullish Case:
• Break above $140 → continuation toward $160–$170
• Supported by the 50-day SMA at $111
Bearish Case:
• Drop below $120 → correction to $100–$85
Conclusion:
Robinhood is in a decisive consolidation. The breakout direction will define its next big move.
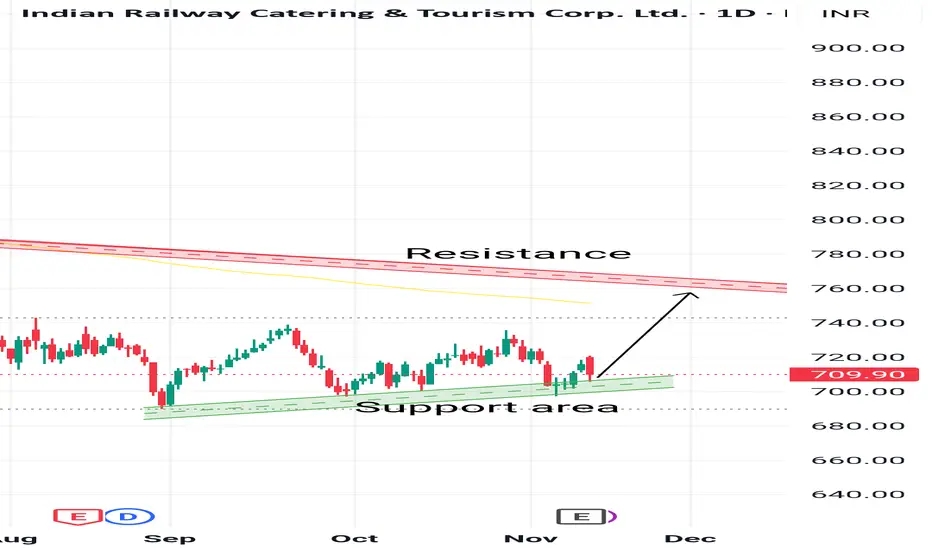
IRCTC Hi ,
Price traded at near support area so possiblity that it will be moves upper side of the resistance area, let's see what happens.....
This idea is for Educational purpose and paper trading only. Please consult your financial advisor before investing or making any position. Facts or Data given above may be slightly incorrect. We are not SEBI registered
GOLD → Consolidation before the next rally?FX:XAUUSD is trying to consolidate above the psychological threshold of 4200-4225 amid uncertainty surrounding the publication of US data after the end of the shutdown. Despite the resumption of government work, key reports for October may be lost...
Key factors: The House of Representatives has approved funding, ending the shutdown. However, data for October (including NFP and CPI) may not be published. We need to wait for confirmation... However, the restoration of statistics (possibly next week) will clarify the Fed's trajectory.
Fed support: 80% of economists surveyed by Reuters expect a 25 bp rate cut in December.
Gold retains its growth potential. The $4200 level is a key barrier, with the price entering a new trading range of 4200-4400. A breakout of the local trigger is possible if data is weak or the Fed confirms a rate cut in December...
Support levels: 4200, 4161, 4148
Resistance levels: 4239, 4274, 4317
Focus on local consolidation and the 4239 trigger. A breakout and close above this level could trigger further growth. Otherwise, the market may test 4220-4200 before resuming its rally. Overall, the market structure and sentiment are bullish.
Best regards, R. Linda!

CDSL Weekly Chart – Symmetrical Triangle SetupPrice Action: CDSL is consolidating within a symmetrical triangle on the weekly timeframe. Lower highs and higher lows are converging toward an apex, suggesting a breakout or breakdown is near.
Key Levels (as of latest weekly data):
Breakout trigger: Above ₹1,565 (recent swing high)
Breakdown risk: Below ₹1,480 (recent swing low)
Triangle apex zone: Between ₹1,500–₹1,520 (compression zone nearing decision point)
RSI Insight: RSI is hovering near the 50 zone. Bearish divergence is visible—price made higher highs while RSI made lower highs. This suggests fading bullish momentum and calls for caution.
MACD Insight: MACD line is flat and close to the signal line. Histogram bars are alternating, showing indecisive momentum. No clear trend yet—market is waiting for a directional move.
Verdict: Neutral bias for now. Wait for a confirmed breakout with volume. Momentum indicators are not yet supportive of a strong move. A breakout above ₹1,565 could resume the uptrend; a breakdown below ₹1,480 may invite deeper correction.

GOLD → Consolidation above 4100...FX:XAUUSD consolidates above $4,100 ahead of a key vote in the US House of Representatives on reopening the government. The rise is supported by weak employment data and expectations of Fed policy easing...
Key factors: Losses of more than 11,000 jobs per week until the end of October have heightened concerns about the labor market. The probability of a Fed rate cut in December has risen to 68%. Lower government bond yields and a weaker dollar have supported gold.
The resumption of data publication after the shutdown may change market sentiment (it is important to monitor actual data).
Gold retains its upside potential, but a short-term correction is possible. The outcome of the vote in Congress will determine the immediate dynamics.
Resistance levels: 4148, 4161
Support levels: 4097, 4075, 4046
If the bulls keep gold above 4100-4120, then in the short term, the market will be able to test resistance for a breakout. However, as a primary retest, I expect a rebound before the breakout and growth, provided that the fundamental background remains unchanged and continues to support the market...
Best regards, R. Linda!
