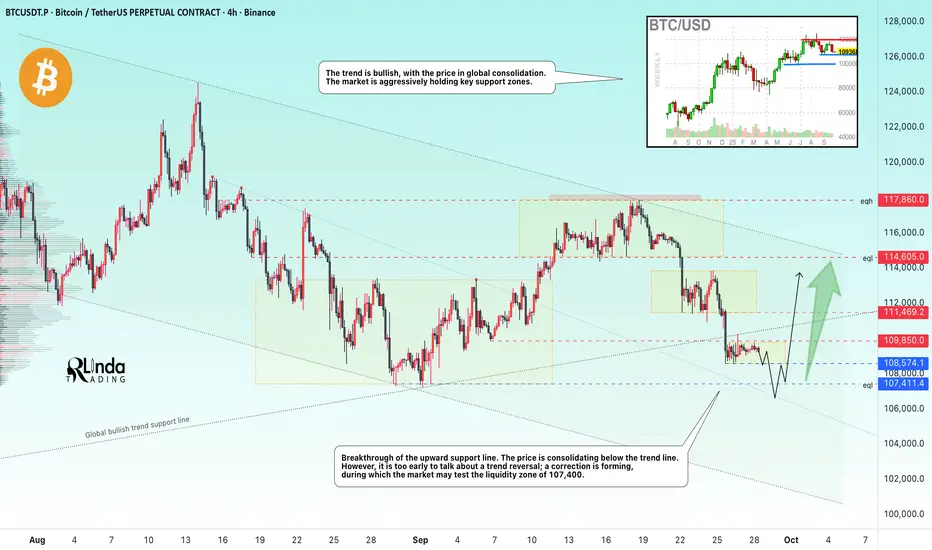
BITCOIN → Stagnation. A brief overview of the current situation.BINANCE:BTCUSDT.P is consolidating after breaking through the trend line support. Despite the positive fundamental background and bullish trend, the market is forming a countertrend correction.
The decline in interest rates in the US has had a negative impact on the cryptocurrency market. Can this be called manipulation? Most likely, yes. But the cryptocurrency market needs a constant driver to keep it alive; calm or neutral conditions lead to corrections and retests of intermediate lows...
As for Bitcoin, I have identified several key areas: the boundaries of the current consolidation at 109,850 and 108,575. Accordingly, a breakout and close above or below one of these boundaries could trigger a move in the corresponding direction. But within the local trend, we can expect a decline to the intermediate bottom of 107,400, from which an attempt at growth could form. In addition, an important zone is the conglomerate of resistance at 110K and the ascending support line. If the price can form an upward momentum and close above the trend support, the market may react positively.
Resistance levels: 109,850 - 110K, 111,500
Support levels: 108,500, 107,400
After breaking through the trend support, there is no momentum and the price is consolidating. This suggests that the market does not believe this premise and a battle for the area is forming. If the bulls can hold their ground and bring the price back within the boundaries of the uptrend, then it may be worth looking for a buying opportunity. Otherwise, it is worth waiting for a retest of the intermediate bottom at 107,400 before looking for an opportunity to open long positions.
Best regards, R. Linda!
Triangle
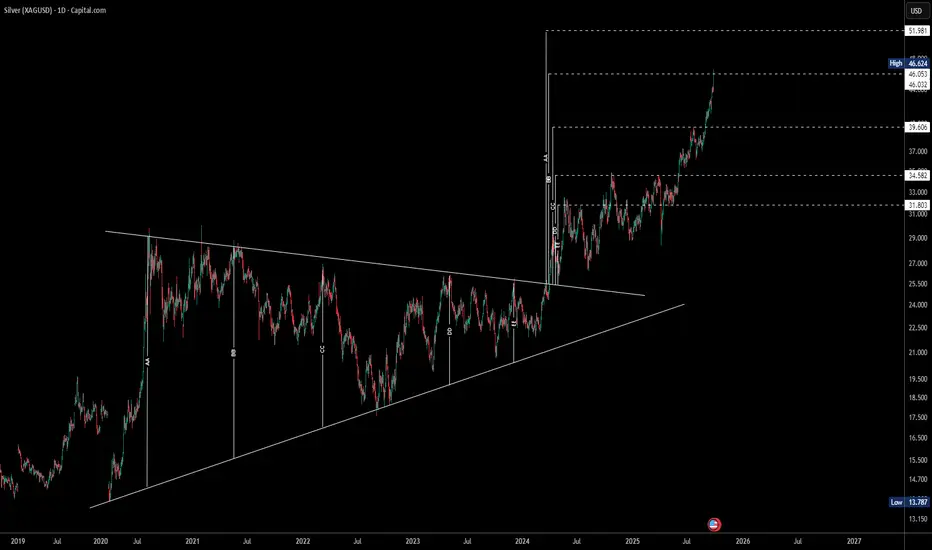
Everywhere I look ~ TrianglesCan't help but be pleased with myself for using what seems to work in determining when I should be acquiring more physical silver, while trading it's illegitimate paper cousins...
Keurig Dr Pepper (KDP) – Triangle Breakdown with Heavy VolumeOn the Weekly timeframe, KDP has broken down from a Triangle pattern , with price also pushing below the first major support zone while volume increased.
Typically, Triangle patterns project a move equal to the triangle’s widest range. Based on this, the chart suggests a possible continuation towards the $18–20 zone.
There is also a notable gap area around $15, which could act as a magnet for price if selling pressure continues.
RSI is already oversold territory, and MACD is deep in negative momentum. This may result in a short-term bounce or correction upward before continuing the downside move.
However, it’s important to remember that patterns do not always play out fully — sometimes reversals occur before reaching the projected target.
Key Takeaway:
This analysis is not a call to short the stock. It is a cautionary outlook for those considering BUY positions. Given the strong breakdown and technical signals, it may be wiser to remain patient until stronger signs of reversal appear.
(For educational purposes only, not financial advice.)

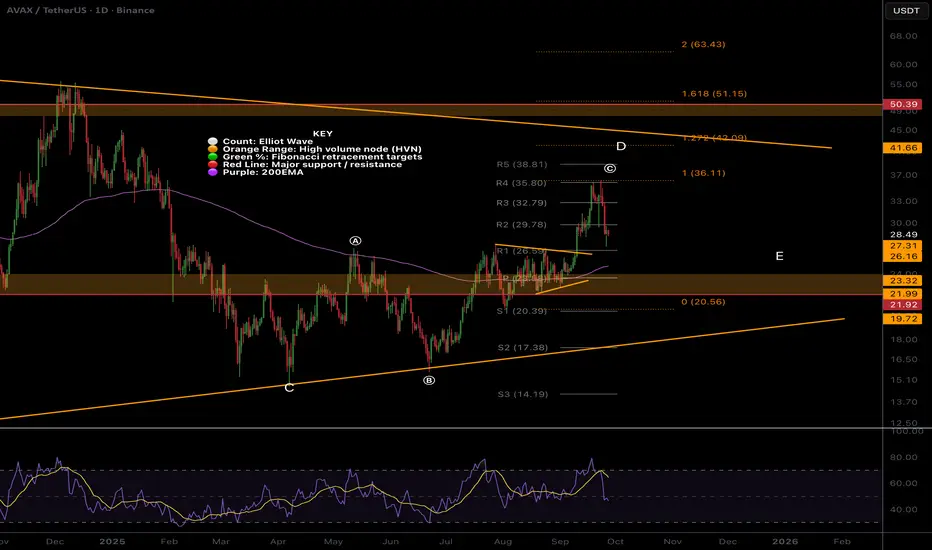
AVAX Local interior triangle completeMouthful ahead:
AVAX appears to have completed a triangle as interior wave (b) of (c) of the macro triangle wave D... sorry
(c) ended perfectly at the 1:1 ration of the (a) - (b) which is expected.
Wave E is underway with the triple support target of the daily 200EMA, pivot and High Volume Node.
Safe trading
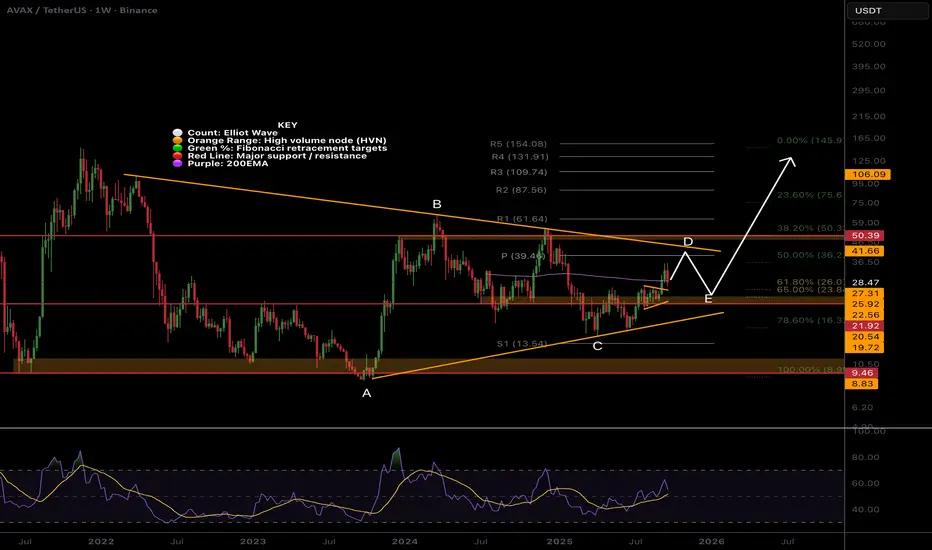
AVAX Macro Triangle?CRYPTOCAP:AVAX is printing a macro triangle similar to CRYPTOCAP:XRP did before it moved x10 in late 2024. The series of ABCs and Fibonacci depths gives this away.
Wave D could be complete but has not reached the resistance line and weekly pivot so I may have one more push up to go.
Wave E is expected to end at the weekly 200EMA to the High Volume Node as it doesn't test the support diagonal line by its characteristics.
This would also have triangle correction complete at the golden pocket adding confluence to the area.
Triangle pattern target is high and we could see a move to the R5 weekly pivot at $150 to test the all time high one more time.
Weekly RSI has bullish divergence from wave C.
Safe trading
GOLD → Consolidation ahead of the news. Rise or fall?FX:XAUUSD is consolidating in the range of 3738-3759 in anticipation of US PCE inflation data, a key indicator for forecasting further Fed policy. Pressure on the metal is intensifying amid a strengthening dollar.
The revision of GDP growth in Q2 to 3.8%, a decline in jobless claims, and an increase in durable goods orders have lowered expectations for aggressive Fed easing.
The new tariffs imposed by Trump have supported demand for defensive assets, but have not been able to offset the pressure from the rise of the USD.
The overall fundamental backdrop is stagnant amid Powell's uncertain stance and the start of a rate cut cycle. The market reaction is mixed...
Gold is in wait-and-see mode. Strong PCE data could send the price to support at $3700, while weak data could bring back interest in record highs.
Resistance levels: 3754, 3759, 3776
Support levels: 3738, 3728, 3703
Technically, the price is storming the resistance of the downward correction and the resistance of the “triangle” consolidation. A breakout and close above 3754-3759 will confirm the bullish sentiment, which could trigger growth towards the ATH. Otherwise, we can expect a retest of 3738-3728 before a possible rise.
Best regards, R. Linda!

Is this a platinum breakout?Using a weekly chart of a platinum ETF.
Breaking out above it's triangle pattern. Needs confirmation though or retrace in the next coming months

EURUSD | Rising Wedge structure WAVE 4Price is moving inside a Rising Wedge.
Wave (IV) correction is unfolding 🔻, targeting 1.1570–1.1500 support zone.
From there, a bullish leg ⚡ (Wave V) can start, aiming above 1.20.
👉 Short-term: Bearish bias.
👉 Medium-term: Bullish continuation after Wave (IV).
⚠️ Educational view, not financial advice.

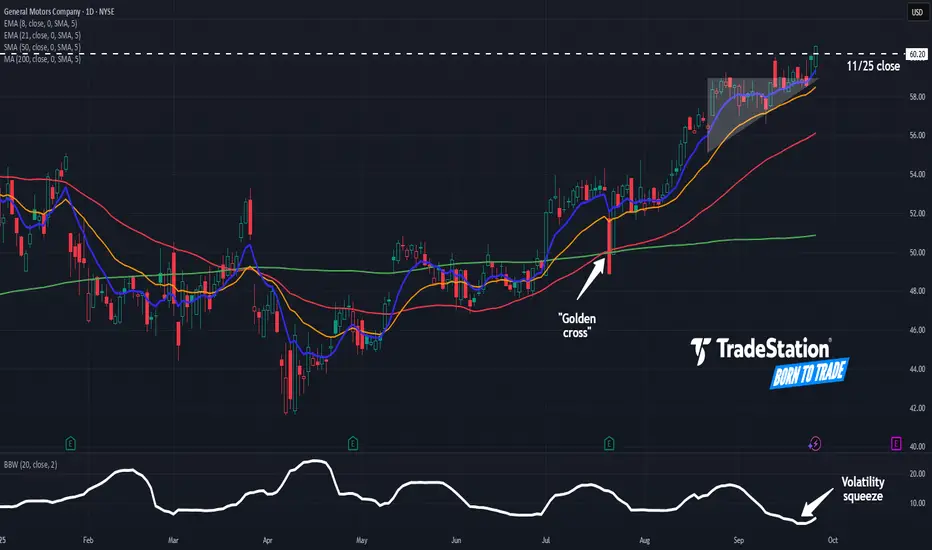
General Motors Could Be AcceleratingGeneral Motors has pushed higher amid low volatility, and some traders may think the automaker is starting to accelerate.
The first pattern on today’s chart is the series of higher lows since mid-August. Prices mostly remained below $59 until last week, creating an ascending triangle. They now seem to be escaping that potentially bullish continuation pattern.
Second, GM ended Thursday at its highest daily closing price since early 2022.
Third, Bollinger Band Width recently fell to its lowest reading since July 2017. Will that price compression give way to expansion?
Next, the 50-day simple moving average (SMA) had a “golden cross” above the 200-day SMA in July and has remained there since. That could reflect a more positive long-term uptrend.
Finally, the 8-day exponential moving average (EMA) has remained above the 21-day EMA since late June. That may be consistent with a short-term uptrend.
TradeStation has, for decades, advanced the trading industry, providing access to stocks, options and futures. If you're born to trade, we could be for you. See our Overview for more.
Past performance, whether actual or indicated by historical tests of strategies, is no guarantee of future performance or success. There is a possibility that you may sustain a loss equal to or greater than your entire investment regardless of which asset class you trade (equities, options or futures); therefore, you should not invest or risk money that you cannot afford to lose. Online trading is not suitable for all investors. View the document titled Characteristics and Risks of Standardized Options at www.TradeStation.com . Before trading any asset class, customers must read the relevant risk disclosure statements on www.TradeStation.com . System access and trade placement and execution may be delayed or fail due to market volatility and volume, quote delays, system and software errors, Internet traffic, outages and other factors.
Securities and futures trading is offered to self-directed customers by TradeStation Securities, Inc., a broker-dealer registered with the Securities and Exchange Commission and a futures commission merchant licensed with the Commodity Futures Trading Commission). TradeStation Securities is a member of the Financial Industry Regulatory Authority, the National Futures Association, and a number of exchanges.
TradeStation Securities, Inc. and TradeStation Technologies, Inc. are each wholly owned subsidiaries of TradeStation Group, Inc., both operating, and providing products and services, under the TradeStation brand and trademark. When applying for, or purchasing, accounts, subscriptions, products and services, it is important that you know which company you will be dealing with. Visit www.TradeStation.com for further important information explaining what this means.
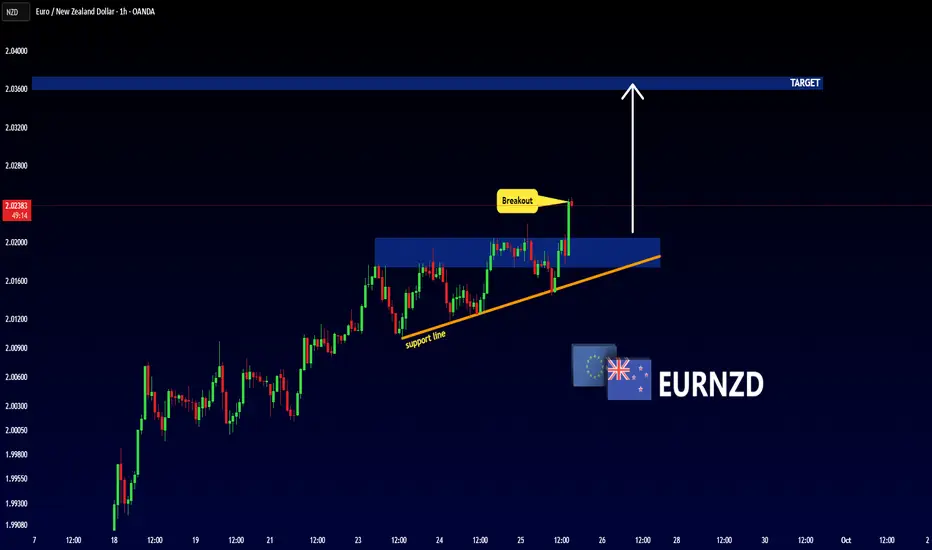
EURNZD - Ascending TriangleHello Traders!
The EURNZD price formed an ascending triangle pattern.
Currently, The resistance level (2.02046 - 2.01743) is broken!
So, I expect a bullish move🚀
______________
TARGET: 2.03600🎯
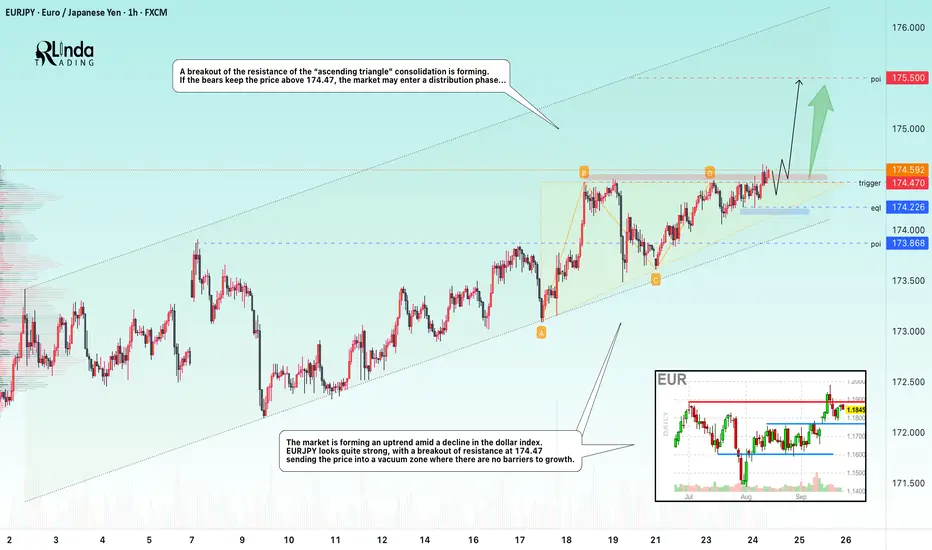
EURJPY → The classical model of technical analysis FX:EURJPY is attempting to break through resistance. The trend is bullish, and the probability of continued growth after consolidation above 174.50 is quite high...
The market is forming an uptrend amid a decline in the dollar index. EURJPY looks quite strong, breaking through resistance at 174.47 sends the price into a void zone where there are no barriers to growth.
A breakout of the “ascending triangle” consolidation resistance is forming. If the bears keep the price above 174.47, the market may enter a distribution phase...
Resistance levels: 174.47, 175.0
Support levels: 174.226, 173.86
The classic technical model for the continuation of the movement is a breakout of the resistance of the ascending triangle. Consolidation of the price above 174.47 - 174.5 may provoke a continuation of the movement within the bullish trend.
Best regards, R. Linda!
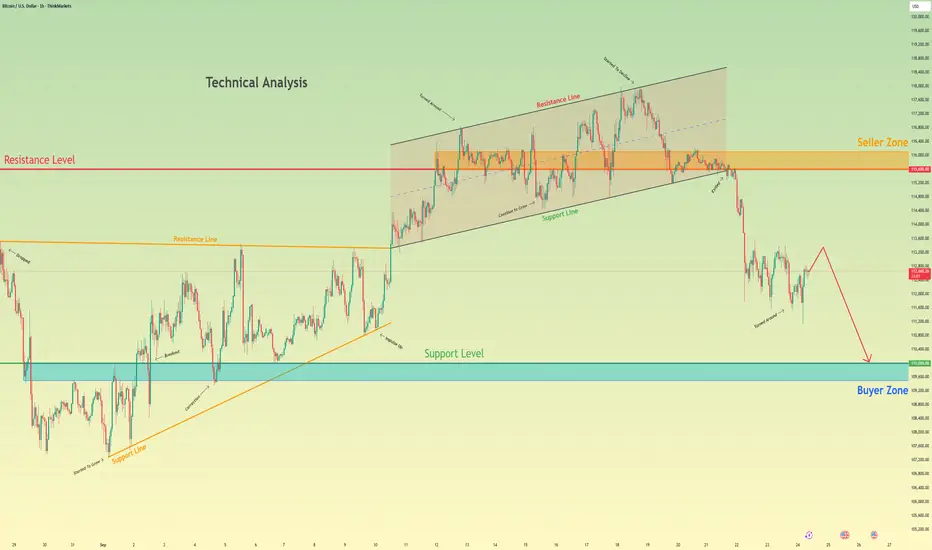
Bitcoin can Continue to Decline to Support LevelHello traders, I want share with you my opinion about Bitcoin. The market structure for Bitcoin has recently shifted to a bearish bias following a significant breakdown from its prior upward channel. After a complex consolidation within a triangle, the price of BTC made a final push to the highs near the 115600 seller zone before being strongly rejected, which led to the failure of the channel's support. This structural break initiated a new bearish phase, causing a sharp decline to a recent low of 111600. Currently, the asset is in a small consolidation, attempting a minor corrective bounce after the significant fall. In my mind, this consolidation is simply a pause before the next wave of selling pressure resumes. I expect that this small upward movement will soon be exhausted and that the price will continue its bearish movement downwards. A failure to produce a strong rally from these levels confirms that sellers remain in control of the market. Therefore, I have placed my TP for this trend-continuation scenario at the major 110000 support level. This target is a logical objective, as it represents the next significant area of historical support and aligns with the 110000 - 109500 buyer zone. Please share this idea with your friends and click Boost 🚀
Disclaimer: As part of ThinkMarkets’ Influencer Program, I am sponsored to share and publish their charts in my analysis.
Nifty 50 – Symmetrical Triangle SetupNifty is consolidating inside a large symmetrical triangle.
Support: 24,000–23,500 zone (rising trendline)
Resistance: 25,500–25,800 (falling trendline)
Volume: Contracting, confirming consolidation
Scenarios:
Above 25,800 → room toward 26,500–27,000
Below 24,000 → risk opens toward 22,500–22,000
Bias: Long-term trend is still up. Near-term, likely sideways between 24,000–25,800 until breakout.
⚠️ Disclaimer: This post is for educational purposes only. I am not SEBI registered. Not investment advice.

I Should Have Noticed This Pattern (Episode 1)
Just today I zoomed out on my GS chart and noticed for the first time this almost perfect triangle pattern. How did I completely miss this?
-There are many times in my short trading career that I have come across things I should have noticed. Whether it's chart patterns, correlation, volume spikes, or indicators indicating; I kick myself for my neglect!
-Now the least I can do is point out those mistakes and share them with you as I see them, in the hopes that more get noticed in the future.
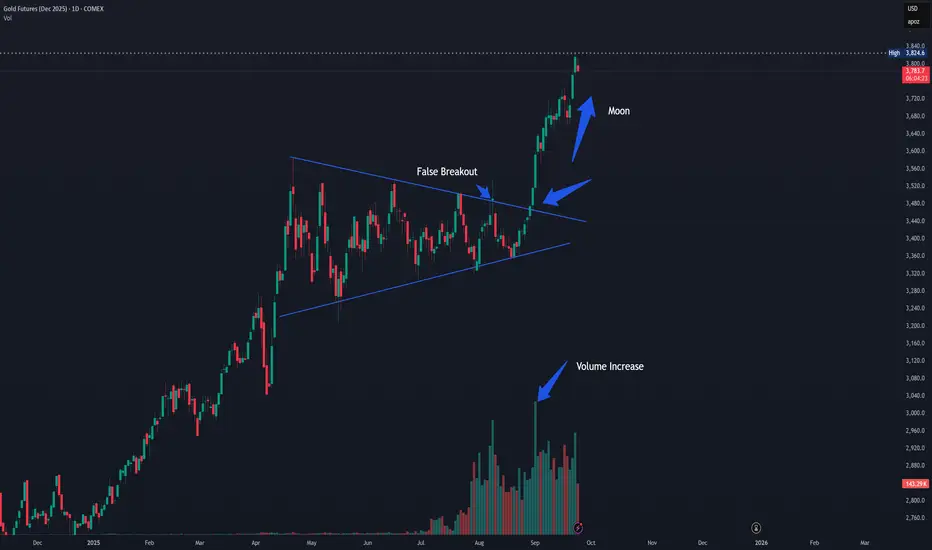
-This is an example of a symmetrical triangle which is considered the most common type of triangle pattern. Despite the name, the triangle does not have to be symmetrical and like all patterns is evaluated in the approximate. Some imagination is required. Most triangles are a representation of consolidation before continuation, but can sometimes represent a top or bottom before reversal. When price does break out of a triangle, volume should spike and this example clearly shows that. This example also shows a false breakout which would have been discovered when closing for the day back "inside" the pattern. Also like all patterns, the larger the time interval, the more important the pattern. Daily and longer are preferred.
-Again this is what I see after the fact and far too late. I would not enter this trade now. Please let me know if I missed something or if you were able to trade this in real time and there was details that I left out. Also, did anyone make money on noticing this pattern? Am I mistaken in any way?
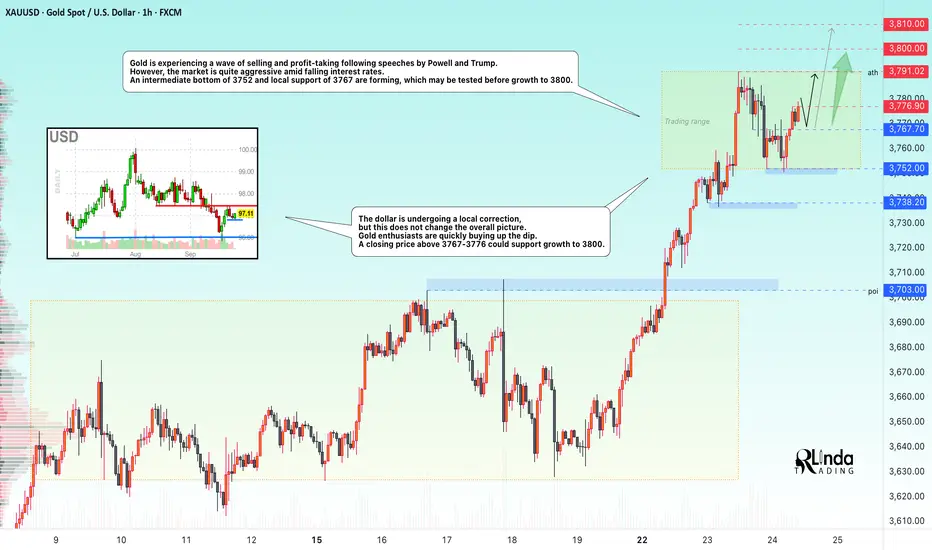
GOLD → Intermediate bottom. Consolidation before growth FX:XAUUSD is being sold off and declining amid profit-taking following speeches by Powell and Trump. However, the market is quite aggressive amid falling interest rates. After forming an interim bottom, the market quickly bought back the decline.
Gold is correcting after record growth, awaiting new signals from Fed representatives and PCE inflation data on Friday. The price remains close to historic highs, but the upward momentum has temporarily slowed, with consolidation forming at 3752-3791.
Key factors : Powell gave no clear hints about future rate cuts, noting the risks of rising inflation and a weakening labor market. The probability of a rate cut in October has risen to 92%, but the Fed's sentiment index is fluctuating somewhat...
The risk of a US government shutdown on October 1 and mixed PMI data are holding back the USD's strengthening.
Technically, gold remains in a bullish trend, but consolidation is possible in the short term. PCE data will be the deciding factor — weak figures will support the metal, while strong figures will trigger a correction.
Resistance levels: 3776.9, 3791, 3800
Support levels: 3767, 3752, 3738
The price is consolidating. Before reaching 3791-3800, there may be a retest of local support. Similarly, a retest of the ATH may also trigger a small pullback of 1/2 of the impulse before a breakout and growth to the specified targets.
Best regards, R. Linda!
EUR/USD: Coiling for a breakout as triangle tightenSitting in an ascending triangle with RSI (14) and MACD generating bullish signals on price momentum, traders should be on alert for a potential topside break in EUR/USD.
If we see a definitive push above 1.1820, longs could be established with a tight stop beneath for protection, targeting 1.1848 initially and 1.1860 after that.
While the price and momentum picture favours longs, you can’t ignore that the pair struggled around these levels during the North American session, putting a possible countertrend short trade on the menu should no definitive bullish break emerge when Asian trade is in full swing later today.
Shorts could be placed beneath 1.1820 with a stop above the level for protection, targeting uptrend support found around 1.1795 currently.
Good luck!
DS

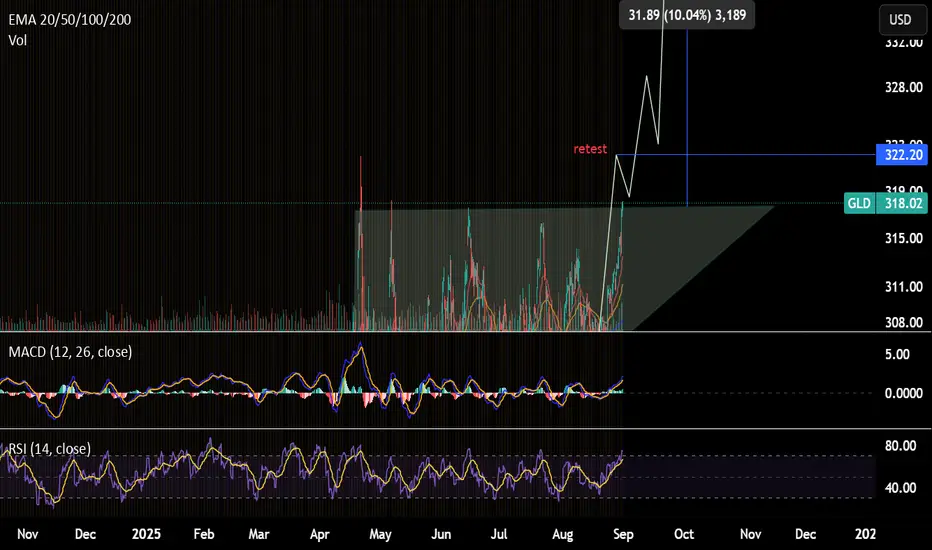
GLD - CALL4hr chart pattern: ascending triangle
Resistance: 321.99 -> need to break & close above 322.2 to confirm bullish breakout. A retest to the equal high at $317 ish might happen after reaching this resistance. Still a good call play from 318 to 321.9
Ultimate price target : $349.2
Stoploss: $304.9
*** Stoploss (for option): Just in case if it is still consolidating in the triangle, stop loss at $313, monitor price movement and re-entry when it reacts at $305.2
Follow-Up on EURNZD Breakout TradeIn our last video, we looked at a consolidation pattern forming on EURNZD and discussed the potential for a breakout. Well, that breakout has now happened — price has pushed above the sideways channel/high-and-tight flag, and we’re currently seeing a pullback into a zone that provides a solid bullish entry reason.
If you’d like to see the full breakdown, including our projected targets for this move, make sure to check out the original video I posted this weekend (linked below).
Please leave any questions or comments below.
Akil

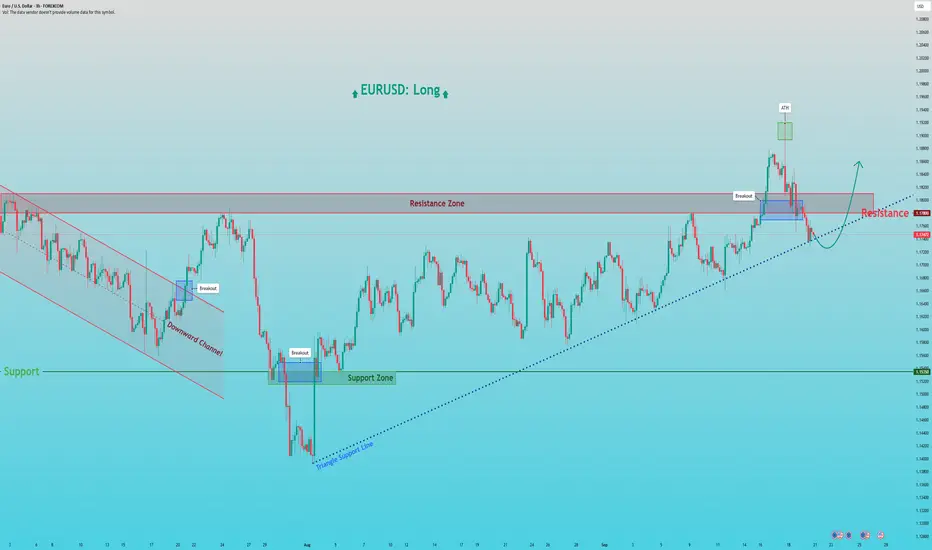
EURUSD: Dip and Bounce from Triangle SupportHello everyone, here is my breakdown of the current Euro setup.
Market Analysis
After reversing from a prior Downward Channel, EURUSD has been consolidating in a large Upward Triangle. This pattern is typically bullish and is defined by a flat horizontal Resistance at the 1.1780 level and an ascending support line, showing that buyers are becoming progressively more aggressive on each dip.
An interesting part of this pattern's history is the 'fake breakout' we saw previously, where the price spiked to a local ATH at 1.1920 before falling back inside. Currently, the price is again in a corrective pullback, heading towards the ascending Triangle Support Line for another test.
My Scenario & Strategy
My scenario is based on the expectation that this Upward Triangle will eventually resolve to the upside. I'm looking for the price to complete its downward movement and find strong support on the ascending Triangle Support Line. A confirmed bounce from this line would be the key signal that buyers are stepping in to defend the trend.
Therefore, the strategy is to watch for this bounce. A successful rebound that finally leads to a decisive breakout above the Resistance Zone would validate the long scenario. The primary target for the subsequent expansion is 1.1860, a logical objective for the move that would follow.
That's the setup I'm tracking. Thank you for your attention, and always manage your risk.
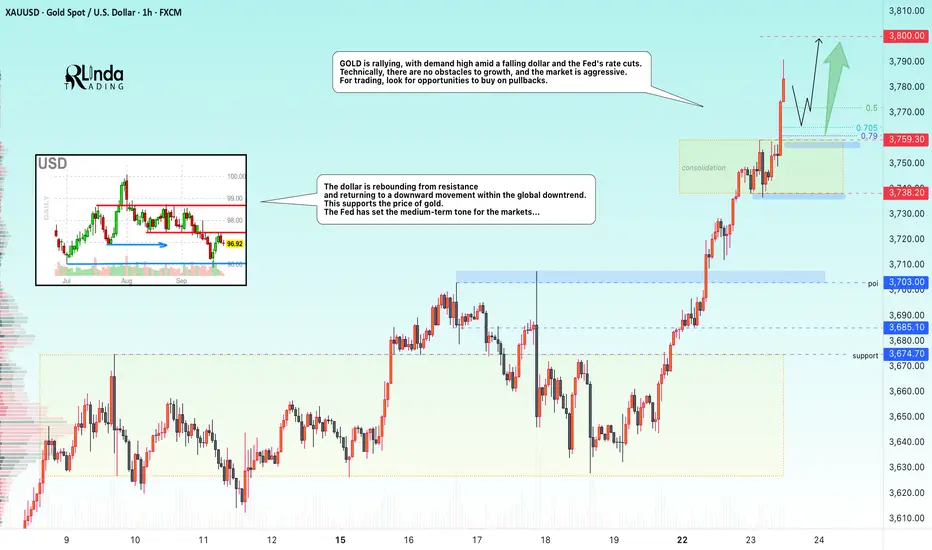
GOLD → Aggressive growth is not over. Powell's speech...FX:XAUUSD is rallying, with demand high amid a falling dollar and the Fed's rate cuts. Technically, there are no obstacles to growth, and the market is aggressive. For trading, look for buying opportunities on pullbacks.
Gold is rallying and hitting new highs as people realize what's going on (interest rates are falling). Powell's speech is coming up, and it may trigger a correction (profit-taking) amid growing risks.
Key factors: Powell's speech today, at which time the market is waiting for hints of further easing of Fed policy.
PMI data (US), weak figures will support the possibility of further rate cuts...
Demand for metal is supported by geopolitical tensions in the Middle East and Eastern Europe.
Resistance levels: 3800
Support levels: 3760
Many factors are supporting the rise in gold, and there are no compelling reasons to sell gold now. The ideal trading strategy is to wait for a pullback and retest of support levels with the formation of strong reversal points for buying.
Sincerely, R. Linda!
The rocket has lifted offWith Nvidia’s investment in OpenAI, Supermicro (SMCI) is expected to benefit from increased equipment purchases, which will boost its sales and help it recover the value lost due to unfounded rumors from certain fund managers. An initial recovery of 32% is projected, with a price target of up to $100 area.
Now we have a huge Symmetrical triangle pointing to 116

COOKIE/USDT – Accumulation before potential breakout This is truly an amazing chart. ✨ I haven’t seen anything like this in the altcoin world for a long time, and it even reminds me of Bitcoin’s structure.
On the weekly chart, COOKIE has been trading in a yellow accumulation zone, while forming a descending trendline (yellow). The price is approaching a decision point – either a breakdown or a potential breakout to the upside.
Support: around 0.10 – 0.13 USDT
Resistance: descending trendline
Volume profile: shows strong interest in this range
Upside target (if breakout): green zone $3 – $4.5 🟢
📌 Conclusion: The market is in accumulation. Watch closely how price reacts at the trendline. A breakout to the upside could open the door for a significant rally.

CHANDI CHANDI CHANDIChandi made classic triangle pattern on daily charts & its on the verge of breaking out of golden triangle .
Risk:Reward = 1:3
Could b bought above 93660 with short/long term stoploss & mentioned target.
