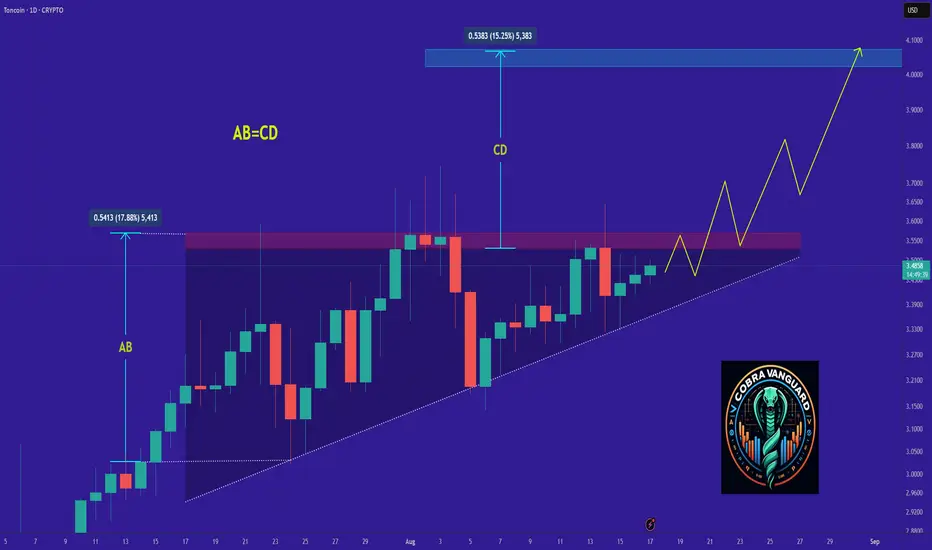
TON's Situation, A Comprehensive Analysis !!!The price on the Daily timeframe is within an ascending triangle, which can be promising. If the price breaks this pattern with bullish candles, it could easily rise by the distance of AB=CD .
Best regards CobraVanguard.💚
Triangle
Wajani Investments; USDCHF Analysis for the days ahead.Monthly, weekly and daily has formed a bullish wedge. In addition, the market on the daily has created a HH from support. To add, the new HH has formed a triangle with price hoping to break out on the weaker side. All these point to a bullish move. Adjust entry and stop loss as market proceeds.
Let me know your thoughts. If this means something to you, please like, share and follow for more.
FOR EDUCATIONAL PURPOSE ONLY. HaPPY tRADING.

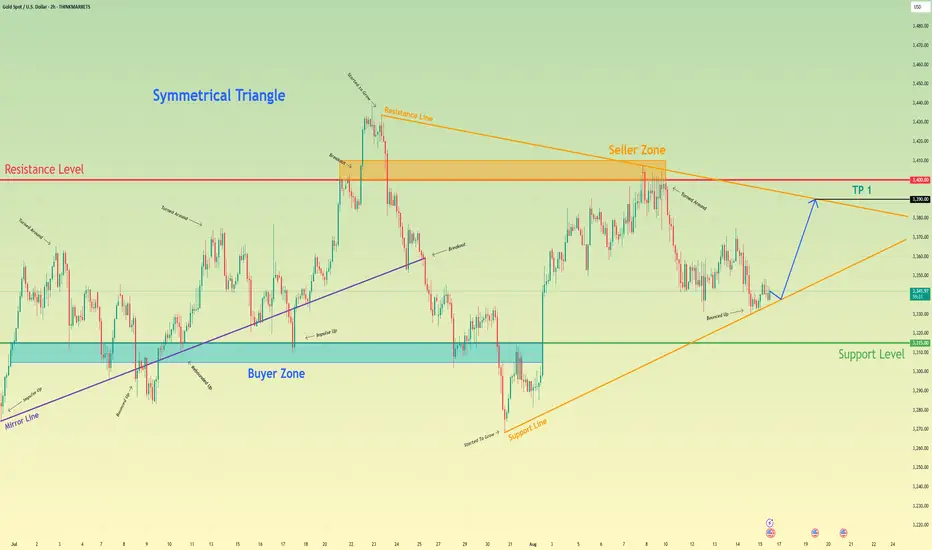
Gold can make correction and then rebound up of support lineHello traders, I want share with you my opinion about Gold. The Gold market has transitioned from a clear directional trend into a phase of price discovery and consolidation, following a significant breakdown of a prior ascending mirror line. This shift in market dynamics has led to the formation of a large symmetrical triangle, a pattern that signifies a period of equilibrium and contracting volatility as the price coils between a descending resistance line and an ascending support line. The boundaries of this pattern are well-established, with the buyer zone around the 3315 support level providing a floor and the seller zone near 3400 acting as a ceiling. Currently, the price is navigating the lower half of this triangle, having recently rebounded from the support line. The primary working hypothesis is a long scenario, based on the expectation of another successful test of the ascending support line. A confirmed and strong rebound up from this dynamic support would validate the integrity of the triangle and suggest that another full rotation to the upside is likely. Therefore, the tp for this rotational move is logically placed at the 3390 level. This target aligns perfectly with the triangle's upper resistance line and sits just below the major seller zone, representing the most probable destination for a bullish swing originating from the pattern's support. Please share this idea with your friends and click Boost 🚀
Disclaimer: As part of ThinkMarkets’ Influencer Program, I am sponsored to share and publish their charts in my analysis.
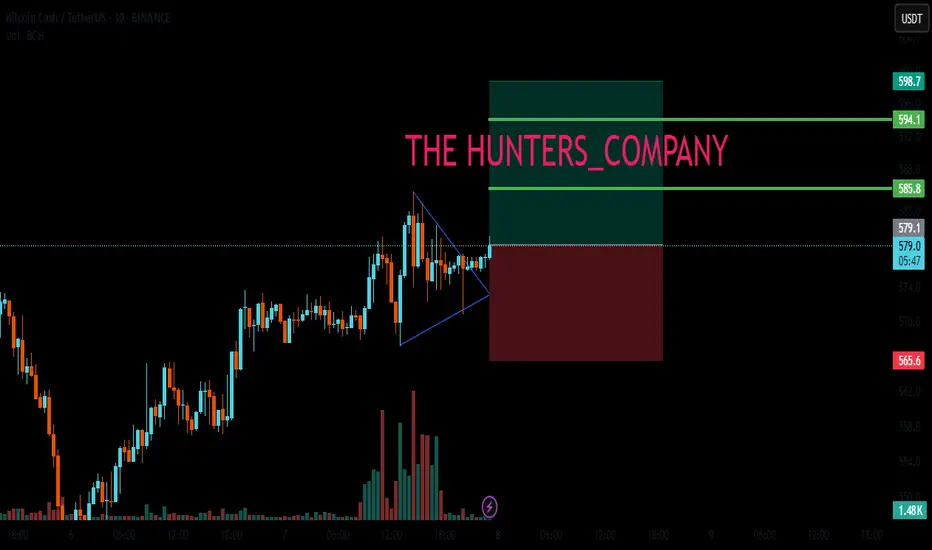
BCH : LIVE TRADEHello friends 🙌
✅Due to the good rise we had, the price has compressed and now formed a triangle.
Now with the valid triangle pattern, we can enter the trade with risk and capital management and move with it to the specified targets.
🔥Follow us for more signals🔥
*Trade safely with us*
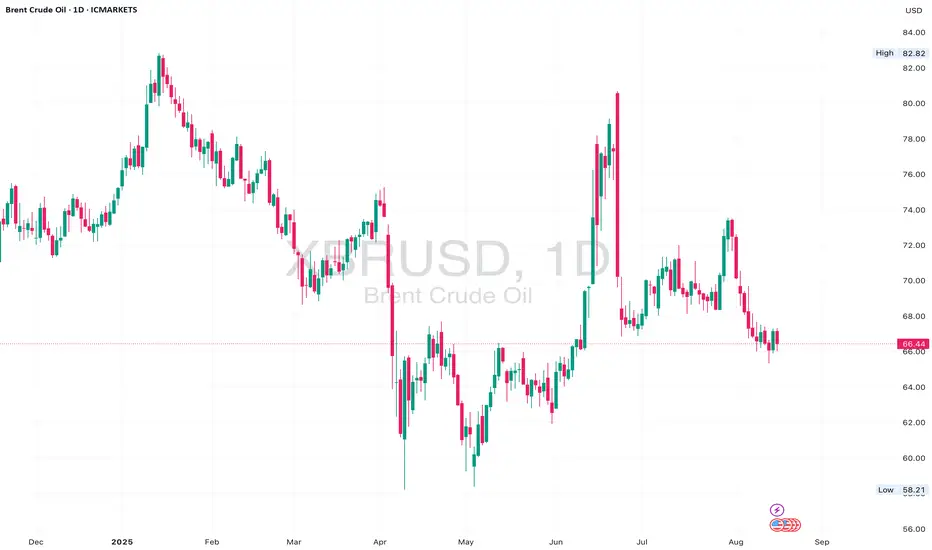
Brent Crude Squeeze – Daily Symmetrical Triangle Nears BreakoutBrent Crude has been consolidating within a symmetrical triangle on the daily chart since mid-May, following a strong bullish recovery from $58 lows. Price is now approaching the apex of the structure, suggesting a breakout is imminent.
We’re still holding above the higher low trendline support, but resistance at $71.00 remains unbroken. A decisive daily candle close outside this triangle will likely set the tone for the next leg.
A bullish breakout above $71.15 could expose $75.00 and eventually $82.00 highs. But if bears take control and break below $67.00 support, $64.00 and $58.00 reopen.
📈 Bias:
Neutral short term — Waiting for breakout confirmation.
Bullish if price breaks and retests above $71.15.
Bearish if we lose $67.00 and structure fails.
TOKENUSDT 4H Symmetrial TriangleThe market has reached the end of its consolidation phase. Now the question is whether to break through the resistance or continue to fluctuate around the support and resistance levels.
T

Euro may reach seller zone and then start to decline to 1.1600Hello traders, I want share with you my opinion about Euro. The historical price action for the Euro began with a period of contracting volatility, where the market consolidated within a triangle formation. A decisive breakout from this triangle unleashed a strong upward impulse, which marked a shift into the current market environment characterised by expanding volatility. This new phase is captured by a large broadening wedge, which has since been defining the trading range between the major buyer zone around 1.1450 and a significant seller zone near the 1.1740 resistance. After a powerful impulse down from the top of this wedge was absorbed by the buyer zone, the asset has entered a corrective rally back towards the upper boundary. Currently, the price is approaching this critical confluence of resistance. The primary working hypothesis is a short scenario, predicated on the expectation that the seller zone will once again cap the rally. A confirmed rejection from this area would validate the integrity of the broadening pattern and suggest that another major downward rotation is imminent. Therefore, the TP for this anticipated decline is logically placed at the 1.1600 points, representing a key area of prior price interaction and a prudent first objective. Please share this idea with your friends and click Boost 🚀
Disclaimer: As part of ThinkMarkets’ Influencer Program, I am sponsored to share and publish their charts in my analysis.

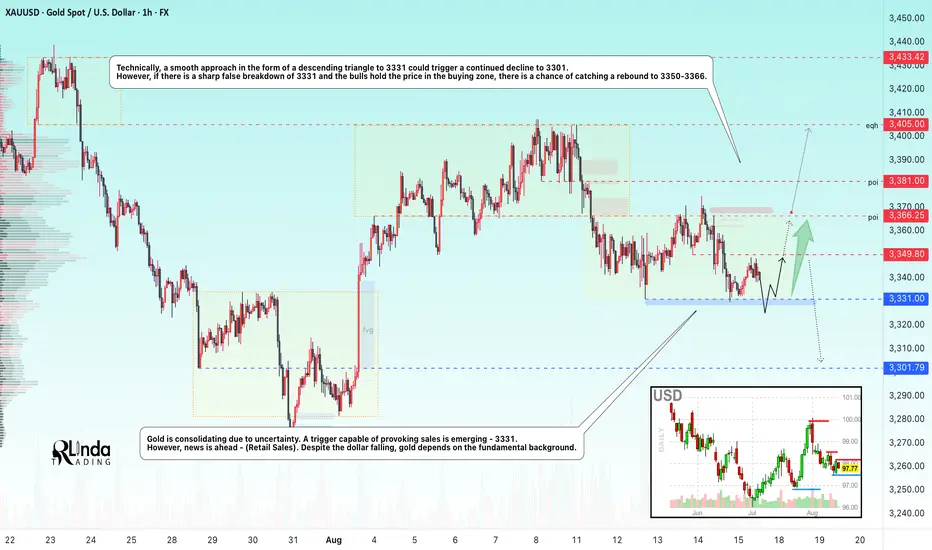
GOLD → Gold is consolidating. What will C.Retail Sales show?FX:XAUUSD is consolidating due to uncertainty caused by economic data from the US, interest rate decisions, and negotiations between the presidents of Russia and the US.
Gold has not had an easy time lately, with the price in a rather difficult zone both technically and fundamentally. Low-potential, restrained movements occurring within the consolidation are waiting for a strong driver to appear. Potentially, this could happen today, as we have retail sales data ahead of us, as well as a fairly important event - a meeting and negotiations between the presidents of Russia and the US.
Technically, the focus is on the boundaries of the current consolidation: 3331 - 3349 - 3366. Thursday's weak close (close to the trigger) hints at a possible attempt to break through 3331 with the aim of falling to 3300. However, a sharp approach and seizure of liquidity from 3331 could provoke a rebound to local resistance (3350 - 3366).
Support levels: 3331, 3300.
Resistance levels: 3350, 3366.
Markets are waiting for hints on interest rates. Weaker data on Core Retail Sales and Retail Sales could bring us closer to a reduction in interest rates, against which backdrop gold could strengthen. And vice versa, respectively...
Best regards, R. Linda!
GBPUSD → Breakout of resistance after consolidationFX:GBPUSD is rebounding from strong daily resistance with the aim of consolidating its pre-breakout potential. The fundamental background for the pound is positive...
GBPUSD has a strong market structure. A false breakout of resistance at 1.3589 is forming. The level could not be broken on the first attempt, MM may form a correction or consolidation for a retest of resistance with the aim of a breakout and further growth. Focus on the liquidity zone at 1.35, 1.3488. The dollar is in a downward movement within the global bearish trend. Despite conflicting news, the index continues to decline, giving the pound a chance...
Resistance levels: 1.3589
Support levels: 1.3521, 1.3488
The market needs consolidation in order to break through this barrier. Against the backdrop of a bullish trend, which is already supporting the market, we can expect a rebound from support with the aim of continuing growth.
Best regards, R. Linda!

NZDCAD: Very Bullish Price Action 🇳🇿🇨🇦
NZDCAD is testing a key intraday/daily horizontal support.
It holds strongly for now, managing to break a resistance line
of a falling wedge pattern on an hourly time frame.
I believe that the price may rise and reach at least 0.819
❤️Please, support my work with like, thank you!❤️
I am part of Trade Nation's Influencer program and receive a monthly fee for using their TradingView charts in my analysis.

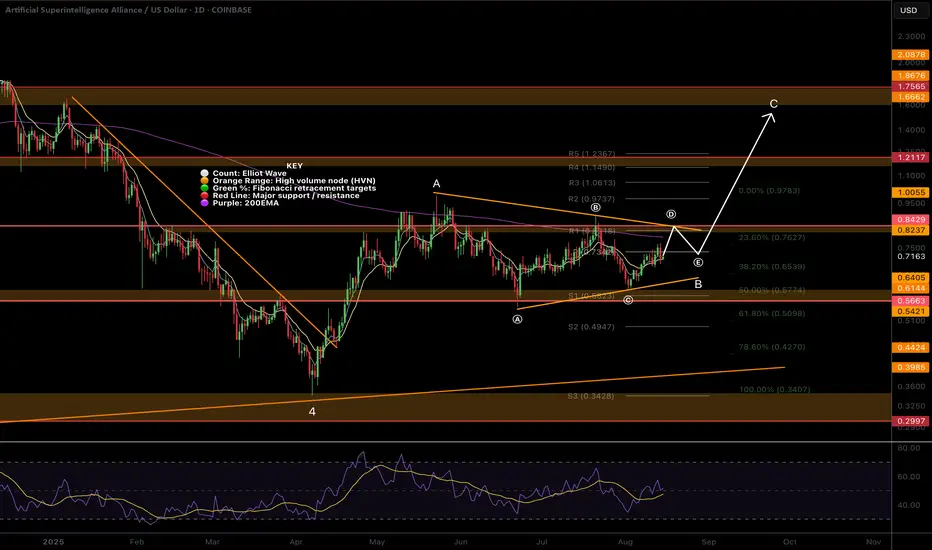
$FET Elliot Wave Updated, Triangle forming?NYSE:FET appears to be printing a triangle in a larger degree wave B of an ABC counter-bear trend correction.
Wave (D) is expected to finish at the descending resistance, poking above the daily 200EMA, while wave (e) is often shallow so expected to end at the daily pivot point. The target is $1.6 at he triangle pattern depth and major High Volume Node resistance.
An ABC corrective wave does not mean that the macro count is invalidated and may form part of larger ending diagonal series of ABCs to achieve my high degree wave 5 targets above all time high. I will update the weekly chart to reflect this shortly.
Safe trading
HYPEUSDT → Correction for consolidation before ATH breakoutBINANCE:HYPEUSDT.P looks quite strong and is just a few cents away from reaching its ATH. The coin needs to build up its potential to reach its target and break through a strong resistance level...
The cryptocurrency market feels quite confident. Bitcoin's growth is having a positive effect on altcoins. HYPE almost tested its ATH as part of an upward movement, but encountered pressure. The price did not reach its target (ATH) and entered a correction phase. Most likely, this is an MM maneuver to collect liquidity...
As part of the correction, the market may test the consolidation located below. Focus on the support area 0.5F - 45.85
Resistance levels: 49.88
Support levels: 45.85, 44.27
The most likely scenario is a retest of the support and interest zone. A false breakdown and the bulls holding the price above the level, i.e. in the zone of interest, could attract active buying, which in turn could trigger a continuation of the growth within the global bullish trend.
Best regards, R. Linda!

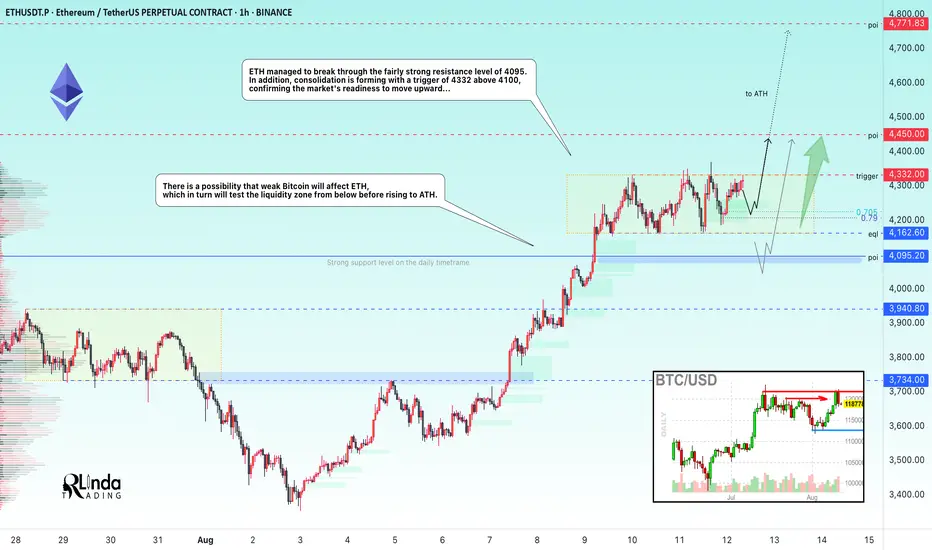
ETHUSDT → A new range has been opened. Onward to ATH!BINANCE:ETHUSDT is breaking through strong resistance formed in the 4090-4100 area on D1-W1. Consolidation is forming after strong growth, which can be seen as a positive sign.
Bitcoin has been looking quite weak recently against ETH, which continues to rally despite Monday's red market. ETH managed to break through the fairly strong resistance level of 4095, and after a strong 25% rally, the price moved into consolidation (trading range 4325-4160, with resistance at 4325 as the trigger). Technically, we see that the market has stopped updating local lows, and a fourth retest of resistance is forming with reduced volatility, which in general could lead to a breakout attempt. Consolidation of the price above the consolidation resistance could trigger further growth. A channel to the ATH is open...
Resistance levels: 4325, 4450, 4800
Support levels: 4220, 4162, 4095
ETH is quite strong and the market may not allow the price to fall too low, as there is a lot of excitement. However, I do not rule out the possibility that weak Bitcoin will affect ETH, which in turn will test the liquidity zone (4162 - 4095) from below before rising to ATH.
Best regards, R. Linda!
EURCAD → Consolidation above the mirror level...FX:EURCAD continues its global bullish trend. Locally, within the upward movement, we see a pause, but the nature of this pause is not aimed at a reversal, but at consolidation before growth.
EURCAD, within the upward trend, is pausing before local resistance at 1.6052. A pre-breakout base is forming with fairly active and dynamic buyers. A breakout and consolidation of prices above resistance will trigger further growth.
Focus on consolidation at 1.6052 - 1.5977. The market is not updating local lows, volatility is decreasing (consolidation pattern) and the assault on resistance continues. Strong prerequisites for the movement to continue
Support levels: 1.6011, 1.5977
Resistance levels: 1.6052, 1.6118
A smooth approach to resistance, a breakout and consolidation above the key level (trigger) could trigger further growth within the global and local bullish trend.
Best regards, R. Linda!

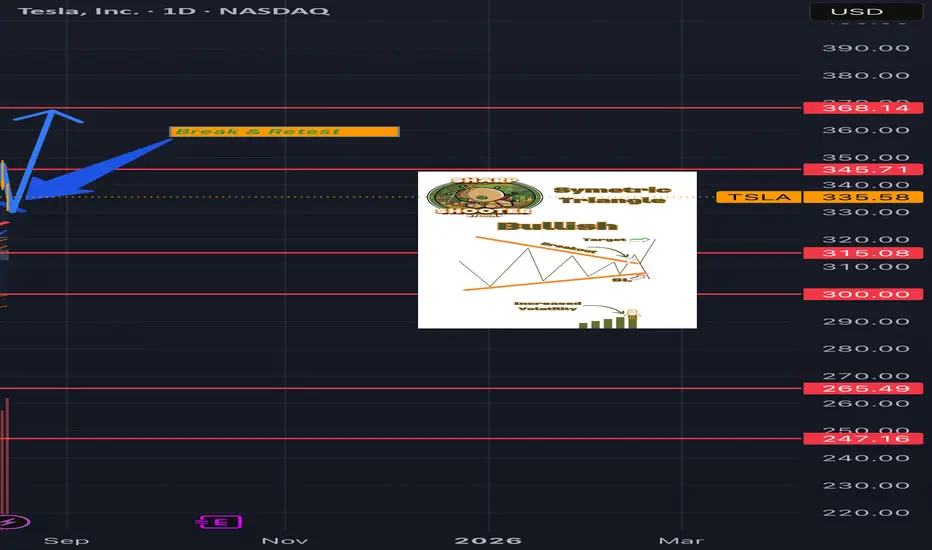
TSLA…..Triangle Breakout!!!TSLA "Tesla"
- Symmetric Triangle (Break & Retest)
- Big FSD update next month!!!
(Closest to FSD Unsupervised we've seen yet)
- Future sources of revenue undervalued (Energy, Robotics/Al, CyberCab)

TSLA……Triangle Breakout!!!TSLA “Tesla”
- Symmetric Triangle (Break & Retest)
- Big FSD update next month!!!
(Closest to FSD Unsupervised we’ve seen yet)
- Future sources of revenue undervalued
(Energy, Robotics/AI, CyberCab)