$MEI Bullish Consolidation: Support Holding Strong, RSI Coiled fChecking out the ASX:MEI chart, and I’m seeing a classic bullish setup brewing after that earnings noise. We’ve been consolidating right at this long-term horizontal support line (that red one going back years—it’s held like a champ through multiple tests). Price dipped to test it again but bounced hard, with the trend now tilting upward. Look at that MACD divergence tightening up—histogram bars are shrinking, signaling momentum shift incoming. RSI is super coiled in the 40-50 range, oversold but not breaking down, ready to spring higher on any volume pop.
Fundamentals aren’t perfect (auto segment still dragging), but industrial/data center growth is the sleeper here, and with cost cuts kicking in, H2 launches could ignite this. I’m betting we punch past $10 soon—calls looking juicy if we hold this support. DYOR, not advice, but this feels like the bottom. Who’s with me? #MEI #Stocks #BullishSetup
Triangle

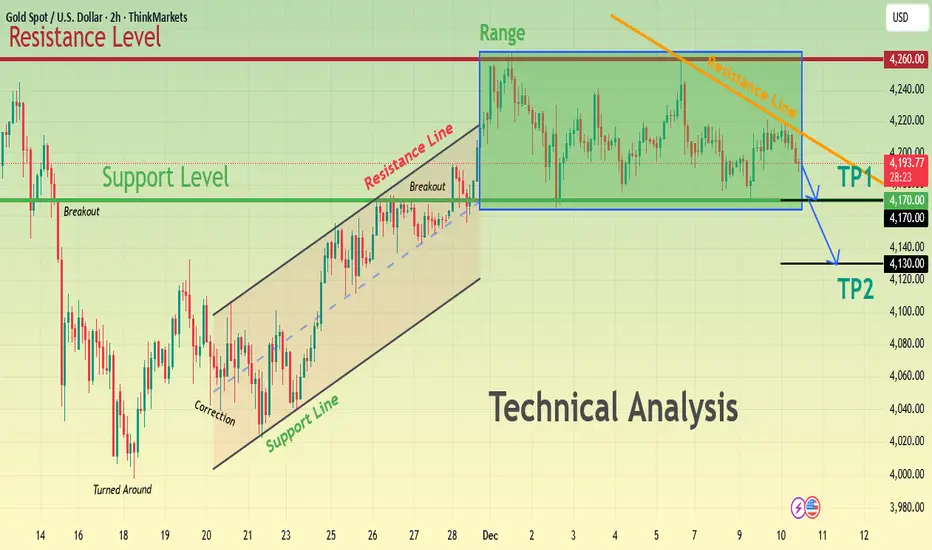
XAUUSD Range Resistance Holds — Pullback Toward $4,170 in FocusHello, traders! Here’s my technical outlook on GOLD (XAUUSD) based on the current market structure visible on the chart. After a strong rebound from the previous lower demand area, price moved into a steady ascending structure, respecting the rising Support Line and forming higher highs and higher lows. This bullish impulse later transitioned into a corrective consolidation, where Gold entered a well-defined range below the major 4,260 resistance level. The repeated rejection from this resistance confirms strong selling pressure at the top of the range, while buyers continue to defend the 4,170 support level, keeping price compressed between these key boundaries.Currently, XAUUSD is trading inside this consolidation box, while also respecting the descending short-term resistance line from the recent swing highs. The market previously broke out from the bullish channel and is now showing signs of weakness beneath the upper boundary of the range, suggesting that upside momentum is fading. As long as price remains capped below 4,260, the risk of a deeper corrective move remains elevated.My primary scenario is bearish as long as Gold stays below the 4,260 resistance and continues to respect the descending resistance line. I expect price to gradually move lower toward the TP1 target at 4,170, which is the first key support inside the structure. If selling pressure accelerates and this level fails to hold, the next downside objective stands at TP2 around 4,120, where stronger demand could emerge. A clear breakdown below TP1 would confirm bearish continuation. However, if price reclaims 4,260 with strong momentum, this bearish setup would be invalidated and the bullish trend could resume. For now, the structure favors a corrective pullback toward 4,170–4,120. Please share this idea with your friends and click Boost 🚀
GOLD → Positive fundamental background. Focus on 4200 FX:XAUUSD is testing the $4,250 level amid news momentum related to interest rate cuts. The fundamental backdrop is improving, with the dollar entering a downward trend...
The Fed cut rates by 25 basis points to 3.75%, as expected. Powell's tone was cautious rather than hawkish, which weakened the dollar and Treasury yields. The market expects two rate cuts next year, compared to one in the Fed's forecasts
- Focus has shifted to US employment data (jobless claims). The next key risk will be next week's NFP data.
The Fed's decision provided support for gold, but for growth above $4250, confirmation of a weakening labor market in upcoming reports will be needed. Technically, the focus is on the 4200-4220 zone.
Resistance levels: 4220, 4250, 4260
Support levels: 4200, 4180, 4175
Consolidation above 4200 will confirm the bullish sentiment, while a breakout and consolidation above 4220 will open up a new chance for growth towards the resistance of the range.
I do not rule out the possibility of a retest the support of the range at 4181 before moving up (the price is still in a sideways trend).
Best regards, R. Linda!

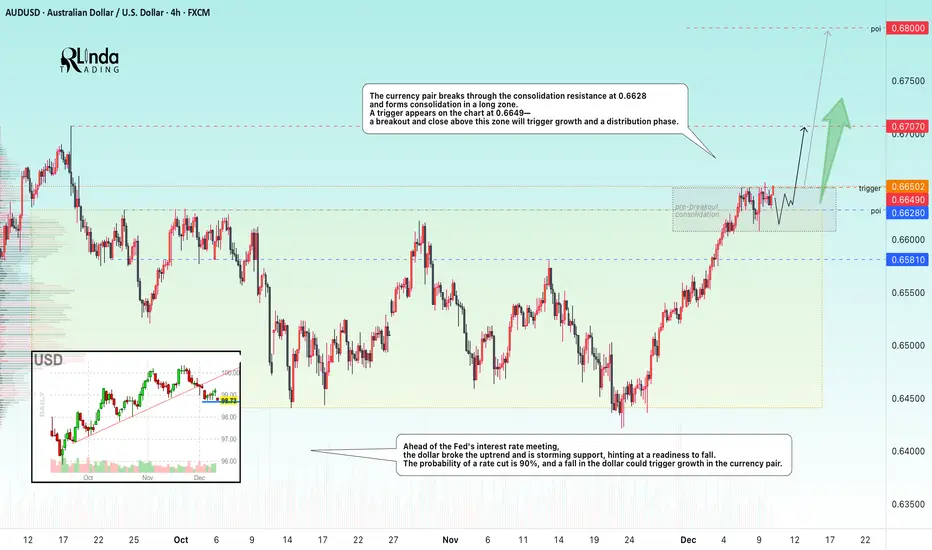
AUDUSD → Readiness for distribution within the uptrend FX:AUDUSD breaks through the resistance of a wide trading range (consolidation) and is preparing for growth. Important news ahead...
Ahead of the Fed's interest rate meeting, the dollar broke its upward trend and is storming support, hinting at a readiness to fall. The probability of a rate cut is 90%, and a fall in the dollar could trigger growth in the currency pair.
The currency pair is breaking through the consolidation resistance at 0.6628 and forming consolidation in a long zone. A trigger of 0.6649 appears on the chart - a breakout and close above this zone will trigger growth and a distribution phase.
Resistance levels: 0.6649, 0.67, 0.68
Support levels: 0.6628, 0.6581
Before rising, the price may test support (the previously broken trading range boundary). However, a breakout and close above 0.6649 could trigger a distribution phase towards 0.67-0.68, especially against the backdrop of a weak dollar...
Best regards, R. Linda!
AEVA Macro Setup: Textbook Bull Flag Breakout on Weekly ChartExecutive Summary: A High-Probability Continuation Play
We are currently tracking a massive technical setup on Aeva Technologies (AEVA) . After a parabolic impulse move of over 1,400% earlier this year, the stock has spent the last few months in a healthy, controlled consolidation phase.
The structure is now complete. The charts are signaling that the consolidation is over, and the next leg of the primary bullish trend is beginning.
Below is a detailed technical and structural analysis of why AEVA presents one of the most attractive risk/reward ratios in the market right now.
________________________________________
1. Market Structure: The "Bull Flag" Mechanics 🏳️
To understand where price is going, we must understand where it has been. The chart is forming a classic Bull Flag / Falling Wedge pattern on the Weekly Timeframe.
Phase 1: The Impulse (The Pole):
The initial rally from $2.50 to $35.60 was driven by institutional demand. This aggressive buying created a "change of character" in the stock, signaling a long-term trend reversal.
Phase 2: The Consolidation (The Flag):
For the past few months, price has drifted lower in a contained channel (marked by the yellow trendlines). Crucially, this sell-off was low volume . This indicates a lack of aggressive selling pressure. It was merely profit-taking by short-term traders, while long-term holders maintained their positions.
Phase 3: The Breakout (Current State):
Price is now breaking above the upper resistance of the wedge. This signals that the supply has dried up, and buyers are stepping back in to push prices higher.
________________________________________
2. Multi-Timeframe Confirmation 📊
A breakout is only as good as the indicators backing it up. We have strong confluence here:
A. Volume Analysis:
Volume is the fuel of any move. Notice the volume profile:
1. High volume during the initial rally (Accumulation).
2. Declining volume during the pullback (No supply).
3. Surging volume on the current breakout candle.
This sequence confirms that "Smart Money" is supporting the current move.
B. Momentum (Weekly MACD):
The MACD indicator on the weekly chart provides a powerful signal. The histogram is flipping bullish, and the signal lines are curling upward for a bullish crossover. Historically, weekly MACD crossovers on momentum stocks lead to multi-week or multi-month rallies.
________________________________________
3. Strategic Targets & Trade Management 🎯
Given the volatility of AEVA, we are using structural resistance levels rather than purely theoretical projections.
🛑 Stop Loss (Invalidation):
A weekly close back inside the wedge structure (below $14.00 - $14.50 ) would invalidate the breakout thesis.
✅ Target 1: The Test ($35.00 - $35.60)
The first major objective is a retest of the previous cycle high. The stock must prove it can clear the supply zone where sellers stepped in last time. Reaching this level represents a potential ~100% gain from current prices.
✅ Target 2: Blue Sky Breakout ($45.00 - $50.00)
If the stock clears $35.60 with volume, there is no overhead resistance. Using Fibonacci extensions, the next psychological targets sit at the $45 and $50 levels.
________________________________________
4. The Fundamental Catalyst (LiDAR)
Technical analysis tells us "when," but fundamentals tell us "why." The LiDAR and Autonomous Driving sector is waking up. As AEVA moves towards commercialization with major automotive partners, the market is pricing in future growth. The technical breakout is likely leading the fundamental news cycle.
💡 Conclusion
This is not a random movement. It is a structured, textbook technical pattern supported by volume and momentum. For traders looking for asymmetric upside, AEVA offers a pristine setup.
Disclaimer: This analysis is for educational purposes only. I am not a financial advisor. Please manage your risk and trade according to your own plan.

Nikkei 225 Is Coiling UpAfter a strong uptrend, price is consolidating inside a symmetrical triangle, a pattern that often precedes a continuation move.
Bullish Scenario
If price breaks above 51,500:
• Target 1: 52,800
• Target 2: 54,500
• Target 3: 56,000
• Stop-loss: Below 50,900
Bearish Scenario
If price breaks below 49,600:
• Target 1: 47,800
• Target 2: 45,500
• Target 3: 43,500
• Stop-loss: Above 50,200
Short Fundamental Overview
• Weak Japanese yen supports export-heavy companies.
• BOJ’s accommodative stance remains supportive.
• Yet, price is near major historical resistances.

XAUUSD Long: Demand Holds — Price Aiming for $4,260 RetestHello, traders! The current price action on GOLD (XAUUSD) is developing within a clearly defined ascending channel, showing that the broader bullish structure remains intact despite recent corrective movements. Earlier, the market formed a Double Top pattern near the upper Supply Zone around $4,260, which triggered a bearish reaction and a downside breakout from that distribution phase. After this rejection, price moved into a corrective decline, respecting the Triangle Supply and Demand lines, where multiple breakouts confirmed increasing volatility and active participation from both buyers and sellers. Following the corrective phase, Gold reached a key Pivot Point near the lower Triangle Demand Line, where strong buying interest appeared and initiated a bullish reversal. From this base, price broke back above resistance and entered the current Ascending Channel, forming higher highs and higher lows.
Currently, XAUUSD is consolidating near the $4,190–$4,200 Demand Zone, where buyers are actively defending the structure. The market is holding above channel support, suggesting that bullish momentum is stabilizing after the pullback.
My scenario remains bullish as long as price stays above the highlighted Demand Zone around $4,180–$4,190 and continues to respect the lower boundary of the ascending channel. I expect Gold to gradually build momentum and attempt another move toward the $4,260 Resistance level, which represents the next major target and the top of the recent supply area. A confident breakout above this zone would signal trend continuation and open the door for further upside. However, a failure to hold current demand could trigger a deeper correction back toward the lower channel area. For now, the structure favors buyers, with $4,260 as the main upside objective. Manage your risk!

Gold – Potential Choppy Price Action AheadThe market got what it wanted from the Federal Reserve last night when a widely anticipated interest rate cut of 25bps (0.25%) was announced, a move which as a rule is positive for Gold prices as it is an asset that doesn’t bear any interest itself. Initially this was the case, with the popular metal trading from opening levels at 4210 before the Fed decision on Wednesday up to a one week high of 4248 early this morning. However, that is where the positive story ended and Gold prices have since traded back down to 4210 again at the time of writing (0700 GMT).
On a longer-term basis, the drivers underpinning prices still seem to remain in place, namely central bank buying dips, concerns over swelling government debt and an uncertain geopolitical outlook, but in the short-term Gold prices could be at the mercy of general risk sentiment, which is wavering after a disappointing Q3 earnings release from Oracle overnight, and positioning readjustment. This situation isn’t helped by the reality that there is little in the way of scheduled risk events for traders to focus on until the release of US Non-farm Payrolls next Tuesday, December 16th (1330 GMT) and the interest rate decisions from the Bank of England, European Central Bank (December 18th) and Bank of Japan (December 19th).
This backdrop could suggest potential for some choppy price action ahead which may require traders to keep monitoring important support and resistance levels that could impact the direction of Gold moving forward.
Gold Technical Update: Watching the 4245/4265 Resistance Band
Since posting the 4381 October 20th high and 3887 October 28th low, Gold has entered a more balanced phase of sideways trading between these extremes. The over‑extended upside price conditions seen after the recent sharp acceleration higher are currently being unwound by this activity.
This current balance between buyers and sellers is evident in the chart below, but it also highlights that no successful closing breakout has yet materialised in price.
Gold’s initial response to the Fed interest rate cut and subsequent press conference yesterday was more positive, with fresh price strength emerging. However, there is still no evidence of a successful breakout to the topside on a closing basis.
As such, maintaining an awareness of both key support and resistance levels could be important in gauging whether the recent sideways trading range is nearing an end.
Possible Resistance Levels:
As the chart below highlights, there is a combination of potential resistance levels situated just above current price activity. This zone reflects both the downtrend line connecting price highs back to October 20th, which sits at 4245 and the December 1st high at 4265. Having previously marked areas where selling pressure has emerged, traders may now be focused on how this resistance band is defended on a closing basis.
Closing breaks above 4245/4265 could lead to a fresh phase of price strength, marking an upside break in Gold from its sideways activity. While not a guarantee of sustained gains, such a move could open potential to challenge the 4381 October 20th extreme and possibly extend further if that level also gives way on a closing basis.
Potential Support Levels:
For now, the 4245/4265 resistance band remains intact. While this area continues to cap attempts at price strength on a closing basis, risks may shift toward the downside, bringing the Bollinger mid‑average at 4155 into play as a potential support level to monitor.
Closing breaks below this support at 4155, if seen, could suggest scope for continued declines toward 3998, the November 18th low. If this level also gave way, it may open the path toward 3887, the October 28th downside extreme.
The material provided here has not been prepared accordance with legal requirements designed to promote the independence of investment research and as such is considered to be a marketing communication. Whilst it is not subject to any prohibition on dealing ahead of the dissemination of investment research, we will not seek to take any advantage before providing it to our clients.
Pepperstone doesn’t represent that the material provided here is accurate, current or complete, and therefore shouldn’t be relied upon as such. The information, whether from a third party or not, isn’t to be considered as a recommendation; or an offer to buy or sell; or the solicitation of an offer to buy or sell any security, financial product or instrument; or to participate in any particular trading strategy. It does not take into account readers’ financial situation or investment objectives. We advise any readers of this content to seek their own advice. Without the approval of Pepperstone, reproduction or redistribution of this information isn’t permitted.

GOLD → Consolidation ahead of the Fed's interest rate decision FX:XAUUSD is rebounding from resistance at the local range of 4220 and heading towards support at the liquidity zone of 4175. Ahead is the Fed meeting on interest rates, where rates are likely to be lowered. What to expect?
The probability of a 25 bp rate cut today is ≈90%. JOLTS job vacancy data reduced the chances of easing in January to ≈20%. Attention is shifting to the Fed's rate forecasts for 2026 and the tone of Powell's comments — the balance of votes in the FOMC (the ratio of “hawks” to “doves”) will determine the further course.
In the current case, it is worth looking not only at the fact of the rate cut, which is most likely already priced in. What is important to us are the regulator's comments and political stance. If they say that the pace of rate cuts will slow down in the future, the dollar may fly up and gold down.
If they support further rate cuts, the dollar will go down and gold up.
Resistance levels: 4220, 4266
Support levels: 4200, 4175, 4165
It would be a shock to the market if rates were cut by 50 points; the chances are slim, but they exist. In this case, gold would soar. However, the most likely scenario is described above.
Technically, I expect a retest of the trading range support; in the worst case, gold may fall to 4140 - 4120 - 4100 before rising. High volatility is possible in the evening!
Best regards, R. Linda!

BITCOIN → False breakout of resistance on a downtrend BINANCE:BTCUSDT is consolidating in the range of 86K - 92K, bears are holding resistance amid a global downtrend, traders lack drivers...
Fundamentally, sentiment in the crypto market is weak, and there is increasing talk of a crypto winter, especially among companies that previously actively bought cryptocurrencies for their balance sheets. There is no bullish driver at the moment.
Bitcoin is in a neutral state, with the market holding the price below 93K. The fundamental background is unstable, and technically, the market is in a downtrend. A reversal pattern is forming relative to 92K, and a retest and false breakout of the zone of interest could trigger a decline to the support range.
Locally, we are seeing an upward channel, but this is a correction against the backdrop of the global trend. If the bears keep the price below 92K, the decline may continue. However, a breakout of 94K and a close above that level could trigger an upward momentum...
Resistance levels: 91850, 92700, 93700
Support levels: 88000, 86300
A false breakout and price consolidation in the short zone could cause further sell-offs towards the areas of interest located at the bottom of the trading range.
Best regards, R. Linda!

BTCUSDT Long: Demand Line Holds — Path Toward 96,500 Opens UpHello, traders! BTCUSDT is respecting the Triangle Demand Line after completing a full bearish cycle inside the descending channel earlier. Sellers maintained control for an extended period, pushing price steadily lower until it reached the pivot point near 88,800, where buyers finally stepped in and broke the bearish structure. This pivot zone became the foundation for a new bullish sequence, with price forming higher lows along the Triangle Demand Line. After the breakout from the descending channel, BTCUSDT entered a consolidation Range, where multiple fake breakouts occurred on both sides. This range acted as a transition phase before buyers regained momentum. Following the range, price made another bullish attempt, but faced resistance near the 96,500 Supply Zone — an area where sellers have shown strong activity in the past.
Currently, BTCUSDT is moving toward the Triangle Demand Line once again, retesting it as support. As long as buyers defend this trendline and price remains above the Demand Zone at 88,800, the bullish structure stays intact.
My scenario: if the trendline holds, BTCUSDT may bounce and continue moving toward the 96,500 resistance, which remains the main upside target for the current bullish leg. A clean breakout above 96,500 would open the path for stronger continuation. However, if price fails to hold the demand line, a corrective pullback toward the lower demand region becomes possible. For now, the market structure remains bullish while price respects the Triangle Demand Line. Manage your risk!

XAUUSD: Buying Pressure Aims for the $4,260 ResistanceHello everyone, here is my breakdown of the current Gold (XAUUSD) setup.
Market Analysis
Gold continues to trade within a broader bullish structure, with price action developing inside a well-defined ascending channel. After the previous impulse move higher, the market entered a consolidation phase below the $4,260 Resistance Zone, where sellers repeatedly defended the level. Earlier, XAUUSD produced a breakout from the upward channel structure and formed a temporary base above the mid-support area near $4,200, confirming that buyers still control the broader trend.
Currently, price is holding above the Triangle Support Line, showing that demand remains active on dips. The recent pullback into the $4,200–$4,190 support area looks corrective rather than impulsive, suggesting that bearish pressure remains limited for now. As long as price stays above this triangle support, the bullish market structure remains valid.
My Scenario & Strategy
My scenario is bullish while XAUUSD holds above the $4,200 Support Zone and respects the Triangle Support Line. I expect price to stabilize in this area and attempt a renewed push toward the $4,260 Resistance Zone, which is the key barrier for continuation.
Therefore, a clean breakout above $4,260 would confirm bullish continuation and open the door for further upside expansion toward higher historical levels. However, if price fails to hold the triangle support and breaks below $4,190–$4,180, this would weaken the bullish structure and could trigger a deeper corrective pullback toward the lower channel boundary. For now, the market maintains a long bias, with the main objective being a renewed test and potential breakout of the $4,260 resistance zone.
That’s the setup I’m tracking. Thank you for your attention, and always manage your risk.

BTCUSD Buyers Defend Support — Market Targets $91,5K — $93K ZoneHello traders! Here’s my technical outlook on BTC/USD based on the current market structure. After a strong bullish recovery from the lower demand area near $83,500–$85,000, the price formed a steady impulsive move upward and entered a consolidation phase inside the marked range below the key $93,000 resistance level. Multiple breakout attempts from the range were followed by corrective pullbacks, showing active participation from both buyers and sellers. Once BTC broke above the range, the price initiated another bullish leg but quickly transitioned into a symmetrical triangle structure, defined by the descending Triangle Resistance Line and the rising Triangle Support Line. Currently, BTC is compressing inside this triangle while holding above the critical $89,500 Support Level, which is acting as the main short-term demand zone. Buyers continue to defend this area, keeping the bullish bias technically valid. The price is now approaching the upper triangle resistance again, hinting at a possible volatility expansion. As long as BTC remains above $89,500, the bullish scenario stays in play. I expect a breakout from the triangle toward TP1 at $91,500, followed by a potential continuation toward TP2 at $93,000, which is the major resistance zone. However, a breakdown below the triangle support would invalidate the setup and may trigger a deeper corrective move. For now, the market remains in a compression phase, preparing for its next directional impulse. Please share this idea with your friends and click Boost 🚀

Extreme compression The price is gearing up for a strong move in either direction.
The triangle is a neutral pattern.
It’s best to wait for the breakout before taking a position. For greater safety, wait for a confirmed break of one of the two blue lines.

GOLD → Price within range ahead of Fed meeting FX:XAUUSD is consolidating within a wide range amid expectations of the Fed's interest rate meeting. The fact that interest rates will be lowered has most likely already been factored in by the market. There is a possibility of a long squeeze...
New threats of tariffs by Trump (on fertilizers from Canada and against Mexico) are weakening the dollar and supporting gold.
As for interest rates, the Fed is expected to cut rates by 25 basis points, but the market has most likely already priced in the cut. Accordingly, there may be countertrend movements (MM traps) to accumulate liquidity before further advances.
Today's JOLTS data on job vacancies may cause increased volatility. According to statistics, before and after interest rate cuts, gold forms a swing correction, within which it may test the support of the range against the backdrop of a bullish trend...
Resistance levels: 4219.5, 4256
Support levels: 4200, 4180, 4163
Ahead is a strong liquidity zone at 4220, and the retest may end in a decline. MM may continue to accumulate liquidity before further advancement. I expect a retest of the range support with the aim of retesting the liquidity pool at 4175-4165 before a possible rise.
Best regards, R. Linda!

I think the only one Liking my post is me!The price on the 4h timeframe is within an ascending triangle, which can be promising. If the price breaks this pattern with bullish candles, it could easily rise by the distance of AB=CD.

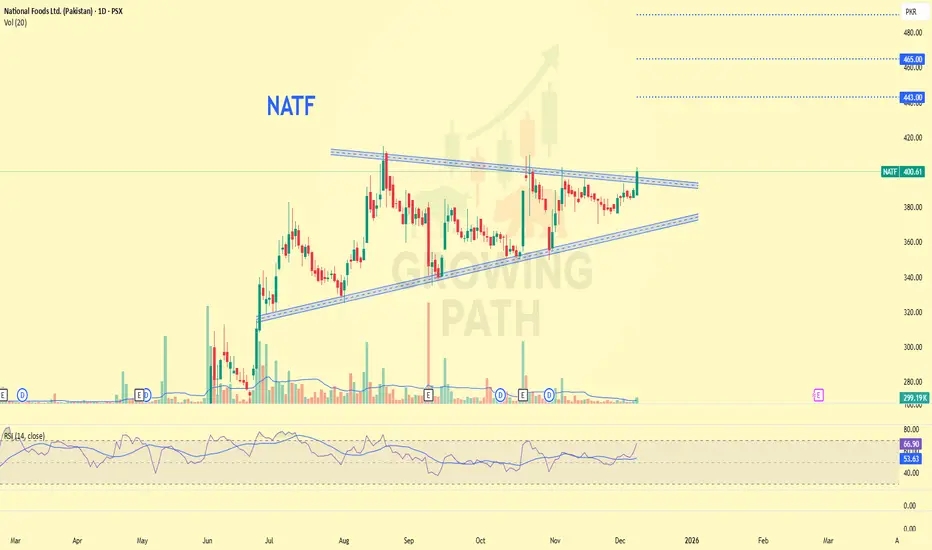
NATF – Symmetrical Triangle Breakout📈 Clean breakout above 396 confirming strength from today's price action.
🔍 Market Structure: Breakout from a symmetrical triangle signals a continuation phase.
💠 Trend Strength: RSI is pushing higher, aligning with bullish momentum.
🛡️ Protection Level: Breakout remains valid as long as 383 holds.
🎯 Targets Ahead:
TP1: 420
TP2: 443
TP3: 465
🚀 Outlook: Momentum shift favors buyers; dips expected to be absorbed above key support.
Gold is in a uptrend.Overall Gold trend is to the upside.
But this month is of holidays so it will move slowly. But we have to catch some pips. Right ?

BTCUSDT: Failed Recovery Opens Path to 87,000 SupportHello everyone, here is my breakdown of the current BTCUSDT setup.
Market Analysis
BTCUSDT is trading inside a broader ascending channel, but the recent price action shows clear signs of weakness near the upper structure. Price previously attempted a breakout above the 90,000 Resistance Zone, however this move turned into a fake breakout, confirming strong seller pressure in that area. After the rejection, the market shifted into a corrective phase and formed a descending triangle structure, defined by the Triangle Support Line and repeated failures near resistance.
Currently, price is consolidating just below the 90,000 resistance, while gradually sliding along the descending support of the triangle. The 87,000 Support Zone remains the key downside buffer where buyers previously stepped in. The overall structure now suggests that bullish momentum is weakening, and sellers are gaining short-term control as long as price remains below the 90,000 resistance level.
My Scenario & Strategy
My scenario is bearish, as long as BTCUSDT stays below the 90,000 Resistance Zone and continues to respect the descending triangle structure. I expect price to attempt another breakdown toward the 87,000 Support Zone, which aligns with the lower channel support and previously active demand area. A clean break below 87,000 would confirm bearish continuation and open the path toward deeper downside targets.
However, if price once again reclaims the 90,000 resistance with strong volume and holding strength, the bearish scenario would be invalidated and a renewed push toward the upper channel could follow. For now, the market supports a short bias, with the main focus on a potential move toward the 87,000 support area.
That’s the setup I’m tracking. Thank you for your attention, and always manage your risk.

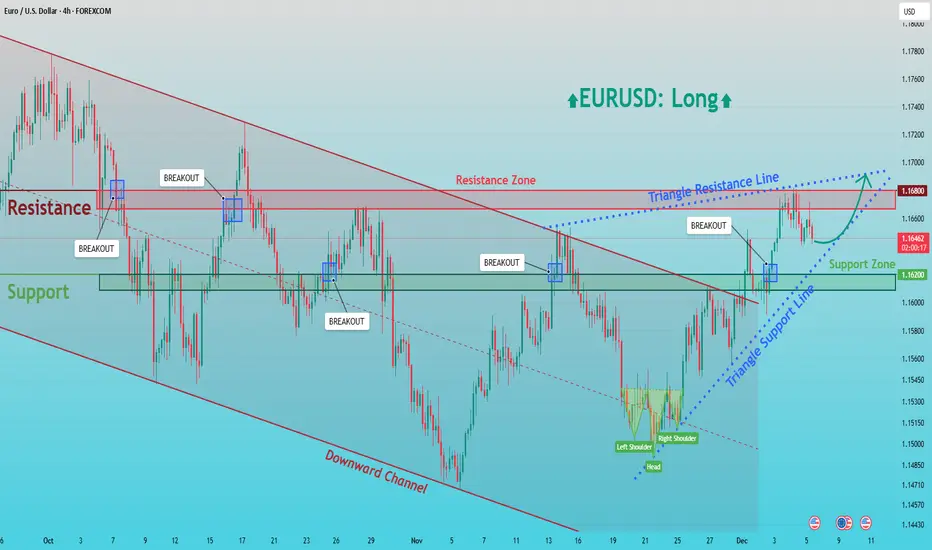
EURUSD: Buyers Push Toward the 1.1680 Triangle Resistance BreakHello everyone, here is my breakdown of the current EURUSD setup.
Market Analysis
EURUSD is transitioning out of a prolonged bearish phase that previously unfolded inside a well-defined downward channel. After forming a major swing low in early November, the pair initiated a recovery and gradually shifted into a corrective bullish structure. Price is now trading inside a developing triangle formation, defined by the ascending Triangle Support Line and the descending Triangle Resistance Line. During the decline, the market repeatedly respected the key Support Zone around 1.16200, which acted as a strong demand area and triggered bullish reactions on multiple occasions. Most recently, EURUSD completed a clear Head and Shoulders reversal pattern near the lower boundary, signaling exhaustion of sellers and the start of buyer control. Following this structure, price broke above the support zone and is now consolidating above it, confirming the zone as a valid demand base.
Currently, the pair is approaching the major Resistance Zone at 1.16800, which also aligns with the descending triangle resistance. This area remains the key upside barrier for buyers and represents a critical decision point for the market.
My Scenario & Strategy
My scenario is bullish, as long as price remains above the 1.16200 Support Zone and continues respecting the ascending Triangle Support Line. I expect EURUSD to maintain upward pressure and attempt a breakout toward the 1.16800 resistance, which is the next major supply area. A clean breakout above this zone would confirm bullish continuation and open the way for further upside toward higher targets.
However, if price reaches the resistance and shows strong rejection, a corrective pullback back toward the 1.16200 demand may occur. Still, the overall bullish structure remains valid as long as the support zone holds. For now, market conditions favor a long bias with focus on a breakout attempt toward the 1.16800 resistance zone.
That's the setup I'm tracking. Thank you for your attention, and always manage your risk.
GOLD → Retest of upward trend support. Focus on 4200FX:XAUUSD is trading near $4,200, remaining cautious at the start of the week ahead of the Fed's decision. The trend is bullish, with the dollar stagnating. A long squeeze of support could trigger a rebound...
The Fed is expected to cut rates by 25 bps (probability ≈90%). Weak US data supports dovish expectations
Attention is shifting to the Fed meeting and its forecasts for 2026. The lack of important US data today shifts the focus to geopolitics and general market sentiment.
There is not much news this week, but from a geopolitical point of view, attention is focused on Japan-China and Russia-Ukraine-US relations.
Gold is awaiting signals from the Fed. The decision on rates and geopolitical news will determine the direction of the breakout from the current range.
Resistance levels: 4220, 4256
Support levels: 4200, 4195, 4180
The dollar previously broke through the support of the uptrend, but has been stagnating for the past few days. A break below 99.0 could trigger a decline in the index, which could support the price of gold.
Gold is testing the support of the trading range within the uptrend. Focus on the 4200-4195 zone. A long squeeze could trigger growth amid a weak dollar...
Best regards, R. Linda!

USDJPY → Attempt to return to the bullish trend from correctionFX:USDJPY may exit the correction phase and continue its upward movement within the trend. The global target has not yet been reached.
The dollar is consolidating after breaking the bullish trend structure. The market is trying to keep the price above 99.0. Growth and a retest of 99.5 are possible. This move may support the growth of the currency pair.
The correction may end. The main trend is bullish, and the market continues to follow the trend lines despite the weak dollar.
A breakout of the correction boundary and maintaining the price above 155.4 may trigger a distribution of 157.8.
Resistance levels: 155.4, 157.15
Support levels: 154.45
Local and global trends are bullish. The correction may end as the price continues to storm the resistance of the local bearish pattern. A breakout of 155.4 and consolidation above this zone may support further growth.
Best regards, R. Linda!

Gold (XAU/USD) – Breakdown & Two Clear ScenariosGold recently moved inside a defined price range between 4260–4160, even forming a bullish triangle pattern, suggesting indecision with a slight bias upward. During today’s session, price has broken below the Previous Day Low (PDL), which now acts as short-term resistance.
From here, we can play two likely scenarios:
📈 Bullish Scenario
If gold reclaims and breaks above the PDL, we may see price retrace toward the Previous Day High (PDH).
Upside potential lies near ~4240, with buyers regaining control.
📉 Bearish Scenario
If the PDL remains as strong resistance and price rejects it, a throwback could lead gold to test liquidity near the 4100 zone.
This area also coincides with the midline of the bullish channel, making it a key support zone for potential buys.
🌐 Fundamental Context
According to Reuters, recent weeks have seen a weakening USD and high market expectations of a Fed rate cut in December, which supports gold as a non-yielding asset.
However, stronger-than-expected U.S. employment data and rising Treasury yields have created periodic pullbacks, showing short-term pressure.
Safe-haven demand remains a factor due to ongoing geopolitical tensions and global economic uncertainty, further boosting gold’s medium-term bullish story.
OANDA:XAUUSD
