EUR/USD Trending Towards Range LowsEUR/USD is testing its five-week lows today around 1.1600 as a firm U.S. dollar and resilient U.S. macro news propped up the greenback in recent session. Stronger U.S. jobless claims (now below 200K) and other data reinforced expectations that the Federal Reserve will remain patient on rate cuts, underpinning U.S. Dollar demand and limiting upside for the Euro. Broader risk sentiment was mixed, with European equity gains failing to translate into meaningful Euro strength.
In the Eurozone, inflation data showed price growth at target levels and the European Central Bank signaled a steady rate outlook, underscoring the impression that policy divergence with the U.S. persists. With limited top-tier Eurozone releases today and into next week, and the Federal Reserve entering its blackout window ahead of its January policy meeting, EUR/USD may be subject to broader trends rather than binary event risk tied to the pair itself over the coming sessions.
In the above chart, EUR/USD rates have started to produce a potential turn in momentum. The uptrend from the January, March, and November 2025 lows has been breached, suggesting that a top may be forming. Recent price action likewise suggests that EUR/USD may be consolidating into a symmetrical triangle. Daily MACD is trending lower while Slow Stochastics are looking to re-enter oversold territory, a testament to bearish momentum. Likewise, each of the 5-day exponential moving average (EMA), 20-day EMA, 50-day EMA, and 100-day EMA having negatives rates of change. Contextually, these developments suggest the path of least resistance remains to the downside, with EUR/USD potentially favoring a test of consolidative range support closer to 1.1500.
Triangle

Silver 45 year Asc Tri chartBullish on Silver for the next 45 years
The Asc Tri chart suggested upside, it was proven correct
How do the price move through the pattern to its full target of $356 assuming it does that
I think because Silver was so manipulated for such a long time the normal rules will not apply
I think we will see surprises on this one, either it just rips to target or we get clever banks trying to get you out of this trade.
We often see smackdowns around US open and at night when less liquidity is present. So that is manipulation go check the records or just trade it and you can see it in live time, all the time not a bit a lot. So there are big players out there that do not like a high price on silver and they seem to have vast monies available.
Hence to see an asc tri break out come all the way back to neckline is not uncommon. Then to think the market makers would like to push it lower before letting it run is also not so far fetched.
If we see it back at 30-45 its a stonking buy, if we ever do see this, maybe it touches on a spike its neckline back at round number 50. Thats why its useful to stagger your positions back in, a few at many price levels, 52.6, 50.1 etc to make sure you get filled.
This is all made up of course not advice, But what if you will get the buying chance of a lifetime again on silver! Most silver longs will be liquidated back at those levels and the big banks can clear their bad positions / order books out and then all be long. When you look at the leveraged fund ie silver 3x short, they were say 500-600k which fell to 1k atm, thats huge. Imagine being in those now, 1k short back to $30 back up to 5-600k again thats like 500 times your money. these are the investment bankers you are competing against. This is a game and we are retail. I am kind of tempted to go short at the round number 100 because of the rewards and no one else is. Standing in the way of a cement truck, sweaty palm trade that one! With a stop for safety it may get hit and could be fairly safe because its so over bought (37 years high) atm. If you are short at those levels where to take it off? use a trailing stop. As fast up it goes spike back down historically on the chart. Plus if this is the case you can pick up all the silver miners very cheap, and the market has not pushed them up so much, so maybe money out there does not believe in this silver price just at the moment, which of course long term I am $300 silver guy and sure that will get hit eventually.

GOLD - Consolidation continues amid bullish trendFX:XAUUSD maintains its upward trend but shows signs of weakening short-term momentum as the market phase has shifted to consolidation. Interest in the metal remains high...
Fundamentals: Tensions between the US and Iran have temporarily eased. Strong US data has reinforced expectations that the Fed will keep rates unchanged until mid-2026, but there will be more news next week... Fed Chair Powell will not be fired, according to Trump, which has eased fears of sudden policy changes.
Inflation in the US (CPI 2.7% y/y) remains above the Fed's target, supporting the regulator's caution.
The market expects the Fed's first rate cut no earlier than June 2026.
Gold maintains a long-term uptrend, but a short-term correction may continue to key liquidity zones. From a fundamental point of view, a resumption of growth will require either a deterioration in geopolitics or weak macro data, and from a technical point of view, a long squeeze or a false breakout of 4581, 4561, 4550...
Resistance levels: 4621, 4639, 4650,
Support levels: 4581, 4561, 4550
The market clearly shows limit support zones behind which a pool of liquidity is hidden. MM will most likely not leave these zones untouched. The capture of liquidity and the bulls' ability to keep prices above key support zones could trigger growth.
Sincerely, R. Linda!

GBPJPY - The hunt for liquidity within a bullish trendFX:GBPJPY is testing key areas of interest amid an upward trend as part of a deep correction. Fundamentally, the pound is stronger than the yen...
The Japanese yen continues to decline for economic reasons related to the Bank of Japan. Against this backdrop, the pound is strengthening. Focus on the 211.59 - 212.0 zone, where the battle for position is most likely to take place. If the bulls manage to break through 212, the currency pair could return to an upward trend.
The currency pair is forming a fairly deep correction, but there is no break in the trend structure. A retest of the 0.6-0.7 Fibonacci zone and a retest of the consolidation boundary within the bullish trend have been formed.
Resistance levels: 212.08, 213.01
Support levels: 211.59, 211.31
A false breakout and the market holding above the key support zone could give buyers a chance to resume the uptrend after the correction ends.
Best regards, R. Linda!

Triangle break triggers GBP/AUD short caseGBP/AUD looks set to close beneath the psychologically important 2.000 level for the first time since early 2025, differentiating this breakdown from the four failed attempts beforehand.
Having coiled within a descending triangle over the past six weeks, convention suggests we may see an extension of the move into the mid 1.90s, especially with momentum indicators on board.
Should GBP/AUD hold beneath 2.0000 over the Asian and early European sessions on Friday, consider initiating shorts beneath the level with a stop above for protection. The pair tends to gravitate towards big figures, so keep 1.9900, 1.9800 and 1.9600, along with 1.9750, in mind as targets, depending on the risk reward you are looking for. Given where the triangle formed, it suggests 1.9600 could be in play.
Mirroring the price action, momentum indicators are singing from the same bearish hymn book with RSI (14) trending lower beneath 50, indicating building downside strength. MACD is delivering a complementary message, staging a bearish crossover of the signal line in negative territory before pushing lower. Shorts are therefore preferred over longs.
From a fundamental perspective, a risk positive tone in markets should support continued downside, so further gains in cyclical assets such as stocks and metals should help promote downside in the pair. You may therefore want to keep an eye on Iranian related headlines for anyone considering the setup.
Good luck
DS

Property a good time to sell out? 18.6 yr cycle There is an 18.6 yr cycle in property and maybe its topping out
If so its bearish on property in USA
This one has broken its long term trend line and is making kind of a reversal pattern at the top or its continuation pattern if the bull has further to run, either case I think we can get a 15% pull back lower here atm. Which still supports forming a chart pattern of a triangle wedge
If you are bearish and prices have topped or are wobbling - Using KLOS/R on the way down could provide target zones to get out or buy back in depending on the bear and rate of decent. Assuming bear approach it will fall quick.
Over a long time prices tend to go back up so unless this is a super bear you will be ok and it will be a nice place to buy loads of properties again at the bottom.
Can the price chart tell us any clues for the bottom of the real estate market?
Can the price chart tell us any clues about the top of the real estate market?
Time will tell,

How long will the Russian war last ? Chart clues ?Observations from the price action of the Russian Index
I can see a macro long term triangle forming on the Russian index
As the price eventually pushes into the apex it will pop out upwards or downwards
This price movement into the apex may give a clue as to how long the war will last.
If the price moves out of the triangle, before the war is officially over the people in the know maybe telling us that the war is ending. ie if the price breaks the upper or lower trend line
Unfortunately there are many potential years left in this trade before the triangle times out
I notice that if we take the bull case as shown here, if the war was to end then the index could quite easily move back up to the 2011 high giving from todays price level approx. 100% move up.
As most of the world is encouraged not to invest in Russia, when it is allowed this may be a buying opportunity to catch up with the rest of the worlds money markets
However its also interesting to see that the Russian index has not collapsed like many thought would happen, its traded sideways for multiple years.

Breakout and retestSilver after hitting 84, started moving/ consolidating / narrowing down in a triangle shape with a breakout and retest candle made at trendline support. I'd expect the rally to begin for a target of 87,
The idea remains valid long as silver doesn't close below 70 on hourly/2H/4H TF.

4191 Breakout of Triangle 4191 has broken out of triangle with good volume, looking good for long trade. Entry at CMP is fine with averaging till 46 if it dips. It should hit 52 and 56 as Targets. Should not close below 45 (SL)

1321: consolidating in a bullish triangle.1321 is consolidating in a bullish triangle after a nice bullish rally. Buying near the low of triangle near 132-130 is ok with SL 129 on closing basis.
It is expected to breakout and continue the rally with intermediate target of 157.

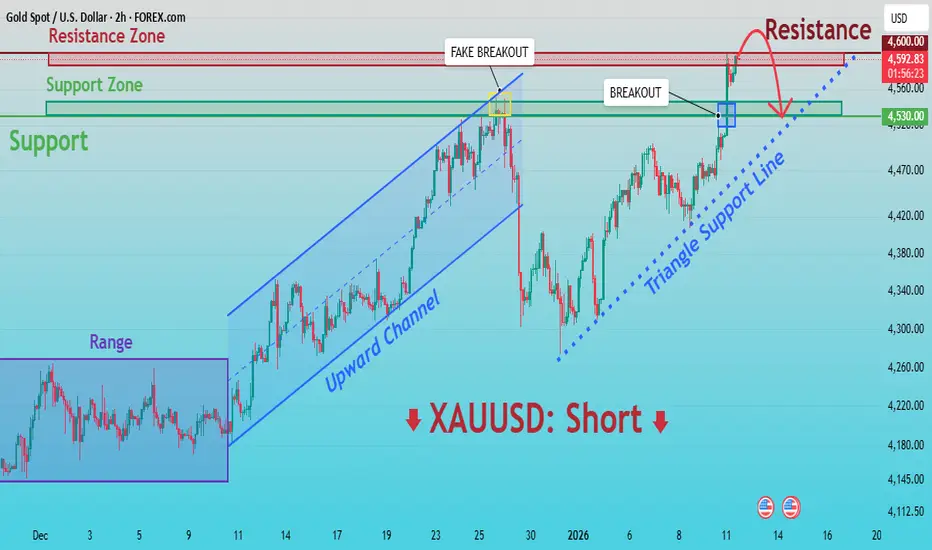
XAUUSD: Critical Supply Zone - Reaction May Define Next MoveHello everyone, here is my breakdown of the current XAUUSD setup.
Market Analysis
Gold is trading within a broader bullish environment, but recent price action shows signs of exhaustion near key resistance. After a period of consolidation inside a clear range, XAUUSD broke to the upside and formed a well-defined upward channel, confirming buyer control. This move brought price into the upper Resistance Zone around 4,590–4,600, where strong selling pressure emerged.
Currently, at this level, price printed a fake breakout, indicating a lack of acceptance above resistance and trapping late buyers. Following this rejection, gold pulled back sharply and then staged a recovery, breaking above the local structure again and retesting the Support Zone near 4,530. This area aligns with previous resistance turned support and a rising triangle support line, which is currently being tested. Despite the bullish recovery, price is once again approaching the major resistance area, where sellers have previously shown strong interest. The market structure suggests that the current move is corrective within a larger resistance context rather than the start of a fresh impulsive rally.
My Scenario & Strategy
My primary scenario favors a short setup while price remains below or reacts strongly from the 4,590–4,600 Resistance Zone. A rejection from this area could trigger a move back toward the 4,530 Support Zone and potentially lower if selling momentum increases.
However, a clean breakout and acceptance above 4,600 would invalidate the short bias and signal bullish continuation. Until that happens, the resistance area remains a key decision point, and caution is warranted near the highs.
That’s the setup I’m watching. Thank you for your attention, and always manage your risk.
GOLD - The battle for 4600 within the great consolidation...FX:XAUUSD is testing the 4581 zone as part of a correction, forming an intermediate bottom and consolidating above 4600, indicating a confident bullish trend.
PPI showed growth in November, retail sales exceeded expectations, and the unemployment rate fell to 4.4% in December, which slightly reduces the likelihood of an early easing of Fed policy, putting pressure on gold.
Geopolitics: Tensions between the US and Iran, as well as around the independence of the Fed. Risks are high...
Today, data on US unemployment benefit claims will be released. High figures could reinforce fears of an economic slowdown and support gold.
The short-term correction in gold is due to strong data from the US, but the upward trend remains influenced by geopolitics and pressure on the Fed. Weak employment data could bring the price back to record levels.
Resistance levels: 4612, 4630, 4643
Support levels: 4600, 4581, 4561
Consolidation is forming against the backdrop of a bullish trend. The market is likely to test 4581-4561 as part of profit-taking or correction before continuing to grow. However, if the bulls keep the price above 4600, growth may begin earlier...
Best regards, R. Linda!

MarketBreakdown | GBPAUD, NZDUSD, US500, EURGBP
Here are the updates & outlook for multiple instruments in my watch list.
1️⃣ #GBPAUD 4h time frame 🇬🇧🇦🇺
The pair is trading in a long-term bearish trend.
After the last bearish wave, the price started a correctional
movement within a bearish flag pattern.
A breakout of its support will confirm a start of a new bearish wave.
2️⃣ #NZDUSD daily time frame 🇪🇺🇺🇸
The market is strongly bullish from November,
After the price updated the last local higher high,
it started to correct within a falling wedge.
Your strong signal to buy will a breakout of its resistance.
3️⃣ #US500 daily time frame
The market retraced to a major rising trend line.
Being a strong vertical support, it was respected.
Probabilities are high that the market will continue rising now.
4️⃣ #EURGBP 4h time frame 🇪🇺🇬🇧
EURGBP has been strongly bearish since November.
The price is currently breaking a support line of a symmetrical
triangle pattern.
It indicates a highly probable bearish continuation.
Do you agree with my market breakdown?
❤️Please, support my work with like, thank you!❤️
I am part of Trade Nation's Influencer program and receive a monthly fee for using their TradingView charts in my analysis.

SOLANA - The battle for resistance 145. The bulls have a chanceBINANCE:SOLUSDT.P breaks resistance and tries to stay above key levels. The fundamental background for cryptocurrencies is gradually improving. What can be expected in the short and medium term?
The crypto market has received support amid progress in US regulatory initiatives: the Digital Asset Market Clarity Act has been submitted for consideration, which increases regulatory predictability and attracts institutional capital. Progress in regulation is laying the foundation for sustainable growth in the crypto market by attracting institutional capital.
Bitcoin is strengthening against the backdrop of positive news related to market regulation and is moving into a local bullish trend. Against this backdrop, SOL is breaking through consolidation resistance and attempting to stay above 143.5 - 144.7...
Resistance levels: 156.5, 160.0
Support levels: 144.7, 143.5, 142. 0
If the bulls manage to keep SOL above the key support zone of 143.5 - 144.7 after breaking through resistance and a reversal pattern forms, a rally to 155 - 160 can be considered.
Best regards, R. Linda!

GOLD - Consolidation ahead of news. ATH retestFX:XAUUSD is trading around $4630, pretty close to its all-time high, but since the session opened, the price has jumped a lot because of the aggressive bull market, which could lead to a correction. News ahead...
US inflation (CPI) slowed in December, and the market expects 2-3 Fed rate cuts in 2026, which exceeds the regulator's forecasts. Protests in Iran and threats of possible intervention by the US; tensions surrounding the independence of the Fed (investigation into Powell); and the tense situation in Eastern Europe are creating geopolitical risks.
• US PPI data will be released today.
• Higher inflation figures may temporarily support the dollar and limit gold's growth.
• Traders are also awaiting the Supreme Court's decision on Trump's tariffs, with a 72% probability of cancellation. If this is confirmed, the market may react strongly...
Resistance levels: 4630, 4650, 4675
Support levels: 4600, 4577
Technically, the ideal scenario would be to wait for a correction, for example to 4605-4600, or to the support level of the trading range to form an ideal entry point. But against the backdrop of an aggressive market, bulls are likely to push the price up from the 4630 zone...
Best regards, R. Linda!


BTC break out ascending triangleBitcoin is completing an ascending triangle. It is possible a pull back to 93.400 area, hence we would be putting there our SL. Tentative target at 108.000 area.
This is for educational purposes and amusement only, not a recommendation or financial advice. The last thing you should do is follow the ideas of some random guy on the internet.

XAUUSD - GOLD FORECAST 15min. AnalysisGold is consolidating. It should tap the bearish order block @4588 before taking off.

XAUUSD Short: Fails at Supply Zone, Sellers Regain ControlHello traders! Here’s a clear technical breakdown of XAUUSD (1H) based on the current chart structure. XAUUSD recently completed a strong bullish leg within a well-defined ascending channel, but momentum started to fade as price reached the major Supply Zone around 4,620–4,630. This area acted as a key rejection zone, where aggressive selling pressure appeared, leading to a clear breakdown from the ascending channel and signaling a shift in short-term market control. After the breakdown, price attempted to recover but failed to regain acceptance above the former structure. The rebound moved into a corrective phase and is now trading below the Supply Line, suggesting that the recent upside is corrective rather than impulsive. The market structure has transitioned into lower highs, reinforcing bearish pressure.
Currently, XAUUSD is approaching the 4,540–4,560 area, which aligns with a prior breakdown level and dynamic resistance from the descending supply line. This zone is expected to attract sellers again. Below current price, the Demand Zone near 4,520 is the first key support. A clean break below this level would confirm bearish continuation and open the door for a deeper move lower.
My scenario: As long as XAUUSD remains below the 4,620–4,630 Supply Zone and continues to respect the descending supply structure, the bearish bias remains valid. I expect price to show rejection from the current pullback zone and push lower toward 4,520 (TP1). A breakdown and acceptance below 4,520 would expose further downside toward 4,480–4,460 (TP2). However, a strong bullish breakout and acceptance back above 4,600–4,630 would invalidate the short scenario and suggest renewed bullish continuation. For now, structure favors sellers while price trades below supply. Manage your risk!

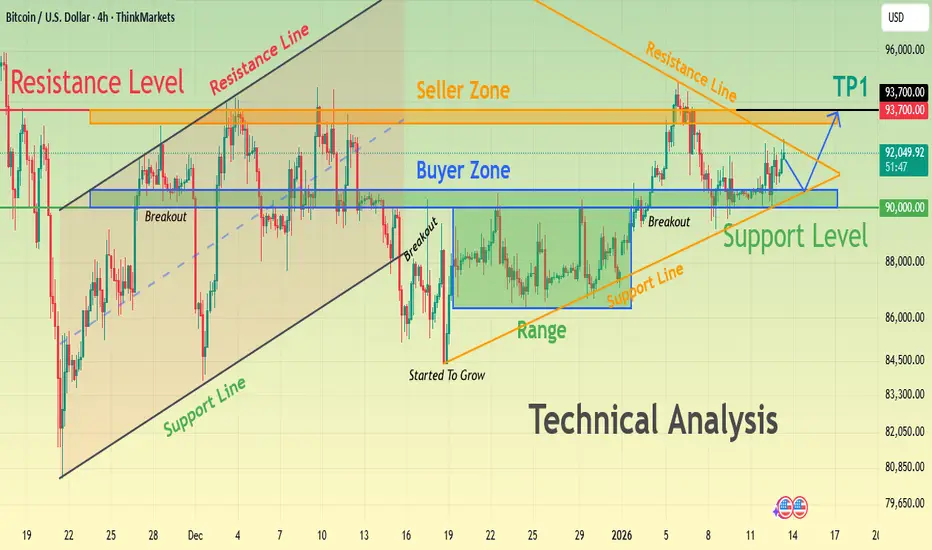
BTCUSD Consolidation Before the Next Big MoveHello traders! Here’s my technical outlook on BTCUSD (4H) based on the current chart structure. Bitcoin is trading within a broader bullish structure after reclaiming key levels and breaking above previous consolidation zones. Earlier on the chart, price respected a rising support line and formed a series of higher lows, signaling growing buyer strength. After a brief pullback, BTC entered a consolidation range, where the market paused before continuing higher. This range acted as an accumulation zone, and the subsequent breakout confirmed renewed bullish momentum. Currently, BTCUSD is trading above the Buyer Zone around the 90,000–91,000 area, which aligns with previous resistance turned support. Price recently broke out from this zone and is now consolidating just below the Seller Zone / Resistance Level near 93,700. This resistance also aligns with a descending resistance line, increasing its significance and making it a key reaction area. My scenario: as long as BTCUSD holds above the Buyer Zone and respects the rising support line, the bullish structure remains intact. A clean breakout and acceptance above the 93,700 Resistance Level would confirm continuation toward the next upside target (TP1). However, a strong rejection from resistance could lead to a corrective pullback back into the Buyer Zone before any further attempt higher. For now, price remains compressed between support and resistance, and a decisive move is likely soon. Please share this idea with your friends and click Boost 🚀
GBPNZD - Ascending triangle on an upward trendFX:GBPNZD has moved into consolidation amid an uptrend and is forming another bullish structure. Focus on trigger 2.340
The global trend for the currency pair is bullish. Against the backdrop of the main trend, consolidation is forming in the form of an ascending triangle, which is generally a fairly strong bullish conglomerate. If resistance is broken, consolidation may move into a distribution phase
After the short squeeze, a weak reaction is forming and the market is quickly returning the price to the resistance level of 2.340. Closing above this level could trigger a rally to 2.35.
Resistance levels: 2.34, 2.355
Support levels: 2.338, 2.336
Before the resistance is broken, a long squeeze of local support may be triggered. However, a quick retest of resistance and a close above the level may trigger distribution towards 2.355.
Best regards, R. Linda!

AUDJPY: Unstoppable Bulls 🇦🇺🇯🇵
I see another confirmed BoS on AUDJPY.
The price now heading towards the 107.5 level.
Look to buy after a pullback.
❤️Please, support my work with like, thank you!❤️
I am part of Trade Nation's Influencer program and receive a monthly fee for using their TradingView charts in my analysis.

BITCOIN (BTCUSD): Road to 100k
Bitcoin finally completed a bullish accumulation within
a huge ascending triangle pattern on a daily..
There is a high probability that the market will continue
rising now.
The next strong resistance cluster is 98800 - 101200 area.
I think that it will be reached soon.
❤️Please, support my work with like, thank you!❤️
I am part of Trade Nation's Influencer program and receive a monthly fee for using their TradingView charts in my analysis.
