Trump's Greenland Tariff 10% on NATO from 1st Feb 2026📢 Statement That Shook Global Diplomacy
Former U.S. President Donald J. Trump has announced a historic geopolitical and economic escalation, directly linking Greenland acquisition with tariff punishment on major European nations.
From February 1, 2026 → 10% tariff
From June 1, 2026 → 25% tariff
On:
🇩🇰 Denmark
🇳🇴 Norway
🇸🇪 Sweden
🇫🇷 France
🇩🇪 Germany
🇬🇧 United Kingdom
🇳🇱 Netherlands
🇫🇮 Finland
Until Greenland is fully purchased by the USA.
🧠 Why Greenland Is So Important
Trump highlighted Greenland as critical for:
✔ Missile defense systems (Golden Dome)
✔ Arctic military dominance
✔ Control of North Atlantic routes
✔ Rare earth & mineral resources
✔ Strategic positioning vs China & Russia
✔ Future space and satellite defense geometry
In modern warfare, location = power.
⚠ What Makes This Statement Extremely Dangerous
Trump directly said:
“World Peace is at stake.”
Which means:
• NATO unity is at risk
• EU–US relations face direct stress
• Arctic militarization increases
• China & Russia involvement becomes aggressive
• Global security architecture destabilizes
This is no longer a trade issue — this is military geopolitics.
💥 Immediate Economic Impact
1️⃣ European Exports to USA
A 25% tariff will:
• Hurt EU auto exports
• Hurt machinery exports
• Hurt pharmaceutical trade
• Hurt luxury brands
• Raise US inflation on imports
• Reduce EU corporate profits
European stock markets will face structural selling pressure.
2️⃣ Currency Market Impact
🇪🇺 EUR → Weak
🇬🇧 GBP → Weak
🇺🇸 USD → Strong initially
But long term → USD also becomes unstable due to trade retaliation risk.
3️⃣ Global Trade War Revival
This officially reopens:
🔥 US vs EU Trade War
🔥 NATO political fracture
🔥 WTO disputes
🔥 Retaliatory tariffs
🔥 Supply chain realignment
🪙 Impact on Gold & Silver
This statement is EXTREMELY BULLISH for Bullion.
Because:
✔ Geopolitical fear rises
✔ Trade war risk rises
✔ Currency trust weakens
✔ Defense spending increases
✔ Inflation expectations increase
✔ Central bank gold buying increases
📈 Gold Reaction
Gold benefits from:
• Political instability
• Trade conflict
• Military tension
• Currency risk
• Safe-haven demand
➡ Gold becomes strategic asset, not just commodity.
📈 Silver Reaction
Silver gains from:
• Industrial defense demand
• Green technology usage
• Electronics
• Investment shift
Silver becomes hybrid asset: Industrial + Safe haven.
🔥 Why Trump Uses Tariffs As Weapons
Trump does not use tariffs for economics.
He uses tariffs as:
🛡 Political pressure
🛡 Negotiation tool
🛡 Strategic leverage
🛡 Military diplomacy
🛡 Psychological warfare
This is economic warfare model.
🌐 NATO & EU Risk Factor
Trump’s statement directly challenges:
• NATO authority
• European sovereignty
• Arctic territorial balance
• Denmark’s control legitimacy
This may lead to:
⚠ EU military alignment against US
⚠ NATO internal conflict
⚠ Arctic militarization
⚠ Increased Russian activity
⚠ Chinese Arctic ambitions
🧩 Why This Is Bullish for Long-Term Gold
Because the world is entering:
✔ Multi-polar power struggle
✔ Currency fragmentation
✔ Military competition
✔ Trade nationalism
✔ Strategic resource wars
Gold thrives in chaos cycles.
📊 Tradeline Capital View
We clearly believe:
🟡 Gold is no longer just inflation hedge
🟡 Gold is becoming geopolitical insurance
🟡 Silver is following strategic industrial demand
🟡 Trade wars guarantee long-term upside
📌 Trading Psychology
Every geopolitical escalation:
➡ Creates volatility
➡ Creates opportunity
➡ Creates trend continuation
➡ Creates panic buying
➡ Creates hedging demand
And bullion benefits the most.
🔮 Forward Outlook
If this tension continues:
Gold can test new historic highs
Silver can accelerate sharply
USD volatility will increase
Equity markets will remain unstable
🧠 Final Conclusion
Trump’s Greenland tariff threat is:
✔ Not a political drama
✔ Not a media stunt
✔ Not a temporary threat
It is a long-term strategic restructuring of global power.
And whenever power restructures…
👉 Gold rises
👉 Silver follows
👉 Risk assets suffer
🏷 Tradeline Capital Note
We strongly advise investors and traders to:
✔ Track geopolitical statements daily
✔ Not ignore tariff politics
✔ Not underestimate Trump policy power
✔ Keep bullion exposure strategic
Because markets don’t move only on numbers — they move on power.
Stay on Buy Side on any price with back up Trade weekly or Positional only this news makes open Buy again in Bullion
🌍 Trump’s Greenland Tariff Bombshell: Global Trade, Security & Bullion Market Impact
Trumptariffs

Nifty Under Pressure-FII Exodus,Trump Insanity & Rupee Weakness1. Since May 2025, USDINR gained ~8.7%, while Nifty gained 8.0% (as the Indian rupee is devaluing, market won't get out of this correction)
2. FII outflows hit record in 2025; DII's inflows hold base but mutual fund AUM growth slowed to 18% (Refer to the Out data in the given image.)
3. Trump Factor
4. Short Buildup at 26000
5. Threat of Inflation
What can reverse this...?
1. FTA news
2. Tax relief by the government in the budget.
3. Monetary Easing by Fed & RBI (It will reverse the USD price to some extent)
4. Earning Surge post Q1 of 2026.
Sectors where you should find the opportunity to invest...
1. Metals
2. Banking

Kiwi H&S and strong Dollar confirm breakdown, eyes on PCE next!The Kiwi hit multi-month lows near 0.5750 following USD strength yesterday, as the dollar index was driven by upbeat US economic data following warnings by Fed Chair just on Tuesday.
The head and shoulders (H&S) pattern on NZDUSD has broken down, targeting the golden pocket for the time being, but the PCE data could offer a breather if it cools down.
Kiwi drop was driven by :
US jobless claims crush expectations (218K vs 233K expected)
US GDP revised to 3.8% from 3.3%, fastest growth in 2 years
RBNZ cutting cycle accelerates amid economic contraction
Tariff-related risk-off sentiment hammering high-beta currencies
Technical Setup :
Head & Shoulders targeting 61.80% or lower while trading below the neckline
Current price action near 0.5750 round support reveals pressure
Upside possible but hangs on PCE, with 38-50% retracement as a resistance zone
RSI is at near-oversold levels with more room to trend lower
Bias - BEARISH :
Entry: Below 0.5775 breakdown
Target 1: 0.5720 (immediate support)
Target 2: 0.5620 (78.6% Fib retracement)
Stop Loss: 0.5830+ (failed bounce level)
Risk/Reward: 1:2+ setup
Eyes on :
Today : US PCE inflation data
Oct 9 : RBNZ meeting (50bp cut possible)
Watch DXY strength continuation towards 100.00
This content is not directed to residents of the EU or UK. Any opinions, news, research, analyses, prices or other information contained on this website is provided as general market commentary and does not constitute investment advice. ThinkMarkets will not accept liability for any loss or damage including, without limitation, to any loss of profit which may arise directly or indirectly from use of or reliance on such information.

A calm start to the week for EURUSDToday is a public holiday in the U.S., so no major moves are expected.
The market opened quietly following eased tensions between the U.S. and China.
We’re continuing to watch for a potential higher low on EURUSD and possible buying opportunities.
Don’t rush your entries — manage your risk carefully.

BTCUSD 2H – Bullish Continuation Expected BITSTAMP:BTCUSD
🚀
Structure | Trend | Key Reaction Zones
Price reacted strongly from the strong demand box, confirming a potential bullish reversal zone.
After sweeping liquidity below the previous low, BTC reclaimed structure and is now pushing upward
If the yellow demand area (112–113 zone) holds, the market is likely preparing for the next impulsive move toward 120.
Market Overview
Bitcoin has completed a textbook liquidity grab beneath previous lows, followed by a clean recovery candle, signaling smart money absorption. The current move shows bullish intent as the market breaks short-term resistance. Holding above the demand box could trigger continuation toward 117–120, aligning with overall bullish structure reaccumulation after a major drop.
Key Scenarios
✅ Bullish Case 🚀 → 🎯 Target 1: 117 | 🎯 Target 2: 119 | 🎯 Target 3: 120
❌ Bearish Case 📉 → 🎯 Downside Target 1: 112 (if demand fails) | 🎯 Target 2: 109
Current Levels to Watch
Resistance 🔴 : 117 – 120
Support 🟢 : 112 – 113
⚠️ Disclaimer: For educational purposes only. Not financial advice.

EURUSD still bullish. Here is why. Last week's sell off was triggered by the resignation of the French prime minister which was then slowed by the Trump's 100% threat on China. Also in the same week Gaza has agreed to a cease fire deal. This week we expect the US CPI to set the pace for EURUSD. Any higher than expected will confirm that inflation is too hot for a cut. Reports have been emerging that the tariffs have shown close to no effects on the US economy allowing room for disinflationary measures. Therefore, a low than expected CPI will mean the sell off that happened in the past week was just a correction and the 1.18 zone is likely to be tested. Finally if Powell maintains a dovish tone on Tuesday then bulls will hold.

TradeCityPro | Bitcoin Daily Analysis #194👋 Welcome to TradeCity Pro!
Let’s analyze Bitcoin today, the market has calmed down a bit, and we can perform some analysis.
⏳ 1-Hour Timeframe
In the 1-hour timeframe, Bitcoin has reached a support level around $109,000 and has shown a reaction to this level.
⭐ After the heavy drop that occurred two days ago, the open interest and market volume have decreased significantly, which clearly indicates that market participants are currently indecisive.
✨ Yesterday, the price reacted to the support zone on Bitcoin, and a significant resistance was created around $112,420, which it has now reached again.
💥 The RSI oscillator has finally moved out of the Oversell zone, and it’s currently below the 50 level.
🧮 Although there’s still fear and a bearish momentum in the market, breaking the $112,420 resistance could be a very risky long trigger.
✔️ Personally, I’m waiting and observing. However, for those who like to open positions every day, breaking this resistance is the only long trigger I can provide.
💡 For a short position, we could enter after the price breaks below the level. I’m passing on this position for now and will wait for a confirmation to search for a short trigger after the price stabilizes below this zone.
❌ Disclaimer ❌
Trading futures is highly risky and dangerous. If you're not an expert, these triggers may not be suitable for you. You should first learn risk and capital management. You can also use the educational content from this channel.
Finally, these triggers reflect my personal opinions on price action, and the market may move completely against this analysis. So, do your own research before opening any position.

TradeCityPro | Bitcoin Daily Analysis #193👋 Welcome to TradeCity Pro!
Let’s analyze Bitcoin, yesterday, a phenomenon called a Flash Crash occurred, and the market experienced a massive drop. Let’s review what happened and where the market stands now.
⏳ 4-Hour Timeframe
Before diving into the chart, let’s first understand what happened in the broader market.
🔍 Yesterday, the U.S. restricted the sale of certain computer chips to China,
and in response, China halted exports of five rare elements to the U.S.
📰 Then, the U.S. reimposed heavy tariffs on China, and China raised duties on American ships.
✨ These escalating tensions severely impacted global markets — and we witnessed the largest Flash Crash in Bitcoin’s history.
📉 A total of $19 billion worth of positions were liquidated, marking the highest figure ever recorded in crypto history.
To put that into perspective, during the COVID crash, only about $3 billion was liquidated — a massive difference.
🔔 Interestingly, Bitcoin dropped less compared to most altcoins and managed to recover partially.
However, altcoins like TON, AVAX, ARB, and SUI (each with their own networks) saw brutal crashes, many with wicks of 60–70% downward.
📊 Now, looking at the chart, yesterday, Bitcoin was ranging above the $120,835 zone.
🧮 Once the geopolitical tension began, the price started a strong downward move, breaking below its key support.
🔽 After two large red candles and a close below support, the third candle formed a 12% wick, dropping as low as $102,000.
✔️ Following that, the price quickly recovered and is now consolidating above the $109,000 support zone.
💡 At the moment, in such a highly volatile environment, finding valid triggers and opening new positions isn’t ideal.
🔑 The price action has been driven mostly by news and panic, so it’s best to wait until the market stabilizes and the effects of these developments fade away.
❌ Disclaimer ❌
Trading futures is highly risky and dangerous. If you're not an expert, these triggers may not be suitable for you. You should first learn risk and capital management. You can also use the educational content from this channel.
Finally, these triggers reflect my personal opinions on price action, and the market may move completely against this analysis. So, do your own research before opening any position.

Uncertainty can prevail with latest Trump Tariff Tantrum.The chart indicates a Trend line resistance near 25323 which Nifty was set to overhaul but latest Trump Tariff Tantrum has potential to derail the progress again. This time the announcement is 100% tariff on China. Global markets, Crypto and Gift Nifty is showing weakness due to the announcement which will be effective from 1st November.
Resistance for Nifty are at 25323 (Trend line resistance), 25438, 25565 and finally channel top at 25702. Supports for Nifty are at 25215, 25087 (Mother line support), 24987 (Father line support), 24922 and 24750 is the channel bottom support. Shadow of the candle was positive to neutral but this tariff announcement has turned it negative as of now. Let us see how the cookie crumbles next week.
To know mover about Mother line, Father line, Mid channel support / resistance, Chanel top resistnace and channle bottom support, trend line support and resistance (To understand the role of Mother line and Father line) or to be able to draw resistances and supports based on historic peaks and valleys you can read my book THE HAPPY CANDLES WAY TO WEALTH CREATION. The book is available in Amazon in paperback or Kindle version and is rated 4.8/5. This book teaches you Techno-Funda investing. (Techno Funda investing means Knowing which are Fundamentally strong companies and investing / booking profits / staying invested in them based on Technical analysis). The book has some more unique features like rating a stock with the help of Happy Candles Number wherein you can give a stock marks out of 100 based on Techincal and Fundamental analysis you have learned by reading it. Thus you can know if the stock is currently investible or not based on the marks it scores out of 100. The book also covers various aspect of behavioural finance. Lot of people who have read the book consider it as a hand book to equity investing. Buy the book you will not be dissapointed as the book is reasonably priced. Search by the key words The Happy Candles Way to wealth creation and you will get it.
Disclaimer: The above information is provided for educational purpose, analysis and paper trading only. Please don't treat this as a buy or sell recommendation for the stock or index. The Techno-Funda analysis is based on data that is more than 3 months old. Supports and Resistances are determined by historic past peaks and Valley in the chart. Many other indicators and patterns like EMA, RSI, MACD, Volumes, Fibonacci, parallel channel etc. use historic data which is 3 months or older cyclical points. There is no guarantee they will work in future as markets are highly volatile and swings in prices are also due to macro and micro factors based on actions taken by the company as well as region and global events. Equity investment is subject to risks. I or my clients or family members might have positions in the stocks that we mention in our educational posts. We will not be responsible for any Profit or loss that may occur due to any financial decision taken based on any data provided in this message. Do consult your investment advisor before taking any financial decisions. Stop losses should be an important part of any investment in equity.

The reason we still have EURUSD bulls in play
If you check my chart I have used the 4HR TF to show the reaction points well. The reason I am maintaining a bullish stance is because of Powell's comments on rate cut. The comments indicated a dovish tone while at the same time signaling uncertainty in the policy rate path. With these comments the dollar still remains at risk. Therefore any sell offs are just retests. The only major event this week is the QGDP which is expected to rise. A higher than expected will only push the pair for retest to the marked levels.

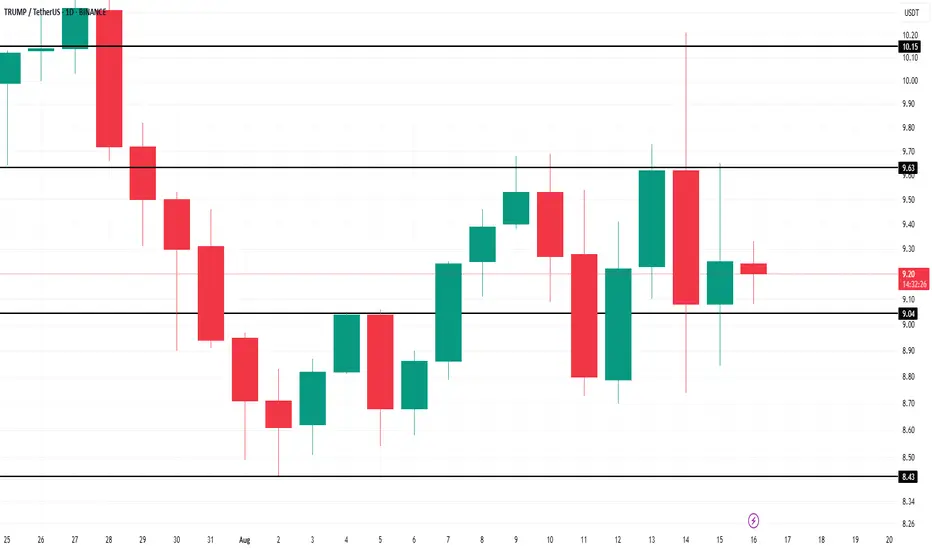
This Is Why TRUMP Price Didn’t Surge After Alaska MeetingBINANCE:TRUMPUSDT is currently trading at $9.17, holding above the support level of $9.04. This range-bound movement suggests that the price could continue consolidating between the $9.04 support and the resistance of $9.63. The market’s indecisiveness points to a period of low volatility.
However, if the outflows continue, BINANCE:TRUMPUSDT could fall through the $9.04 support and fall to the next support level of $8.43. This would extend the losses and put further downward pressure on the price, signaling a potential decline.
On the other hand, if BINANCE:TRUMPUSDT manages to flip the $9.63 resistance level into support, it could make its way towards $10.00 . This would require a change in investor sentiment, likely driven by renewed confidence in the asset's potential.
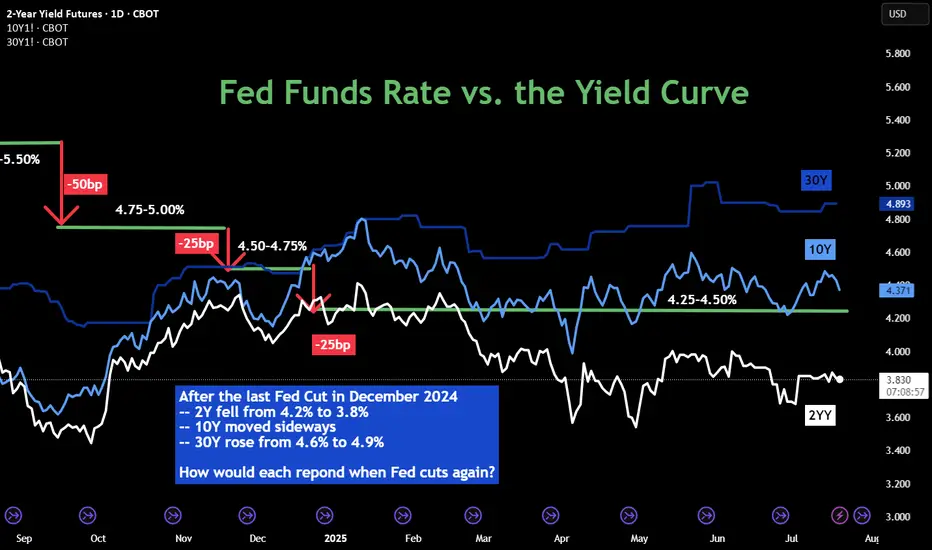
10Y: Positioning for a Falling Yield EnvironmentCBOT: Micro 10 Year Yield Futures ( CBOT_MINI:10Y1! ), #microfutures
The Federal Reserve last cut interest rates in December 2024. Since then, it has kept the rates unchanged in its January, March, April and June FOMC meetings. While the official Fed Funds rate stays at 4.25-4.50% in the past seven months, we have seen diverging trends in the interest rate market:
• 2-Year Yield has trended down from 4.25% to around 3.85%;
• 10-Year Yield mostly moved sideways, currently at 4.42%;
• 30-Year Yield rose from 4.60% to top 5.00% in May, then pulled back to 4.89%.
The futures market expects the Fed to cut rates once or twice in the remaining four FOMC meetings in 2025, according to CME Fed Watch Tool.
• As of July 20th, there is a 95.3% chance that the Fed will keep rates unchanged in its July 30th meeting;
• The odd of lowering 25 bps is approximately 60% for September 17th;
• By the last 2025 meeting on December 10th, futures market sees just 6.4% chance that the Fed keeps the rates at current level 4.25-4.50%, while the odds of 1 cut to 4.00-4.25% are 29.2%, and the odds of 2 cuts to 3.75-4.00% are 64.3%.
The Fed’s Challenges
The Fed tries to fulfil its dual mandate established by the Congress: (1) to support maximum employment and (2) to maintain price stability. Its official targets are to keep the unemployment rate below 4%, as measured by the BLS nonfarm payroll data, and to keep the inflation rate at 2%, as measured by the PCE price index. When we face an outlook of rising prices and slowing employment, the Fed will have a hard time meeting both policy goals.
Firstly, as the Trump Administration raises tariffs for all trading partners on all imports, it’s a matter of time before the inflation rate picks up again. Even if many countries may reach trade agreements with the U.S., they will still get a bigger tax bill.
• According to the Bureau of Economic Analysis (BEA), the total US imports of goods and services was $4.1 trillion for 2024.
• Imports account for 14% of the US GDP in 2024, which is $29.2 trillion (BEA data).
• Simple math suggests that a universal 10% tariff hike could contribute to 1.4% in price increases, assuming all tariffs are passed through to the retail prices.
The most recent inflation data is the June CPI at 2.7% (BLS data). The tariff hike could easily push inflation to twice the Fed policy target. Therefore, cutting rates will be a very difficult decision if inflation rebounds.
Secondly, US employment growth has slowed down significantly in 2025. On July 3rd, the BLS reported total nonfarm payroll increased by 147,000 in June, and the unemployment rate changed little at 4.1 percent. Current employment growth is less than half the level in December 2024, which saw the data above 300,000.
There are weaknesses in the payroll data. All private sectors combined accounted for about half of the employment gain, or 74,000. Government jobs, while at a much smaller base, accounted for the other half.
Tariffs raise the cost of input, while business borrowing costs remain high at current rate level. To support growth and maximum employment, cutting rates make sense.
Finally, the Fed is under tremendous pressure from the Administration. President Trump openly and repeatedly calls for a 300bp cut.
In an ideal world, the Fed wants to make monetary policy decisions free of political interference. It may not be the case. Let’s look at the Fed rate decisions during the first Trump presidential term. The current Fed Chair was appointed to the role by President Trump in February 2018.
• The Fed raised interest rates four times in 2018, for a total of 100 basis points, with the Fed Funds rate increased from 1.25-1.50% to 2.25-2.50%.
• Under pressure from the White House, the Fed cut rates three times in 2019 for a total of 75 basis points, with the Fed Funds rate ending at 1.50-1.75%.
• In 2020, in response to the Pandemic, the Fed cut rates by 150 points, all the way to a zero-rate environment (0%-0.25%).
In my opinion, the Fed will cut rates this year, similar to 2019. Once the Fed Chair retires in May 2026, his replacement, who will be nominated by President Trump, will no doubt follow his guidelines and bring the Fed Funds rate all the way down to 1%-2% level.
While there is uncertainty in the timing and pace, we are likely to embark on the path to low interest-rate environment.
Shorting Micro 10-Year Yield Futures
A trader sharing a bearish view on interest rates could explore shorting the CBOT Micro 10-Year Yield Futures ($10Y).
Last Friday, the August 10Y contract (10YQ5) was settled at 4.425. Each contract has a notional value of 1,000 index points, or a market value of $4,425. To buy or sell 1 contract, a trader is required to post an initial margin of $300. The margining requirement reflects a built-in leverage of 14.7-to-1.
Let’s use a hypothetical trade to illustrate how to use a short futures position to take advantage of a potential Fed rate cut.
Hypothetical Trade:
• Short 1 10YQ5 at 4.425, and set a stop loss at 4.60
• Trader pays $300 for initial margin
Scenario 1: Fed keeps rates unchanged on July 30th, 10Y moves sideways
• If Futures price changes little after the July FOMC, the trader could close the position
• He could short the September contract 10YU5, with an eye open for the September 17th FOMC rate decision
• This is a futures rollover strategy.
Scenario 2: Fed cuts 25 bps on July 30th, 10YU5 falls 250 points to 4.175
• Short position gains: $250 (= (4.425-4.175) x 1000)
• The hypothetical return will be 83% (= 250 / 300)
Happy Trading.
Disclaimers
*Trade ideas cited above are for illustration only, as an integral part of a case study to demonstrate the fundamental concepts in risk management under the market scenarios being discussed. They shall not be construed as investment recommendations or advice. Nor are they used to promote any specific products, or services.
CME Real-time Market Data help identify trading set-ups and express my market views. If you have futures in your trading portfolio, you can check out on CME Group data plans available that suit your trading needs www.tradingview.com
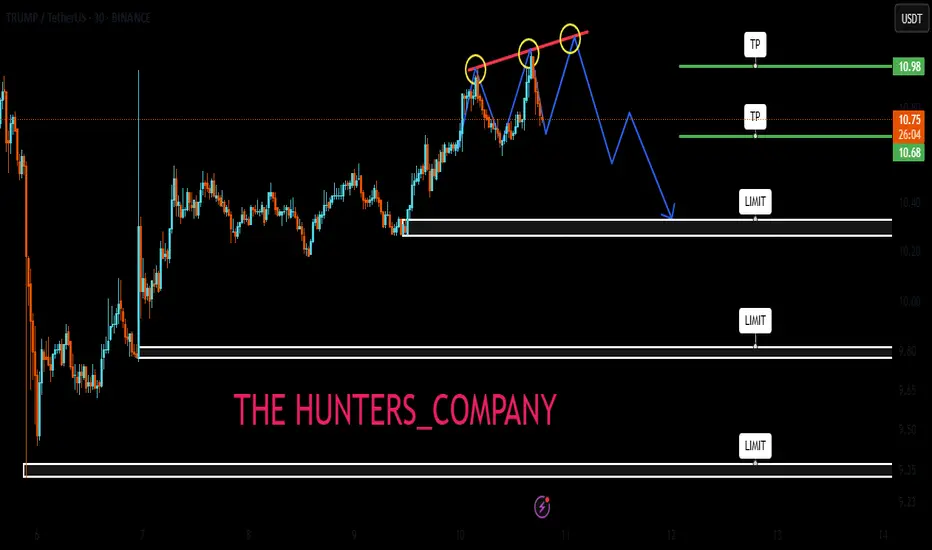
Trump's signalHello friends🙌
🔊Given the good growth we had, you can see that the price has hit resistance and you can see that the upward waves are getting weaker, which indicates that we are likely to have a correction until the support areas are identified...
You can buy in the identified support areas in steps and with capital management and move with it to the specified targets.
🔥Join us for more signals🔥
*Trade safely with us*
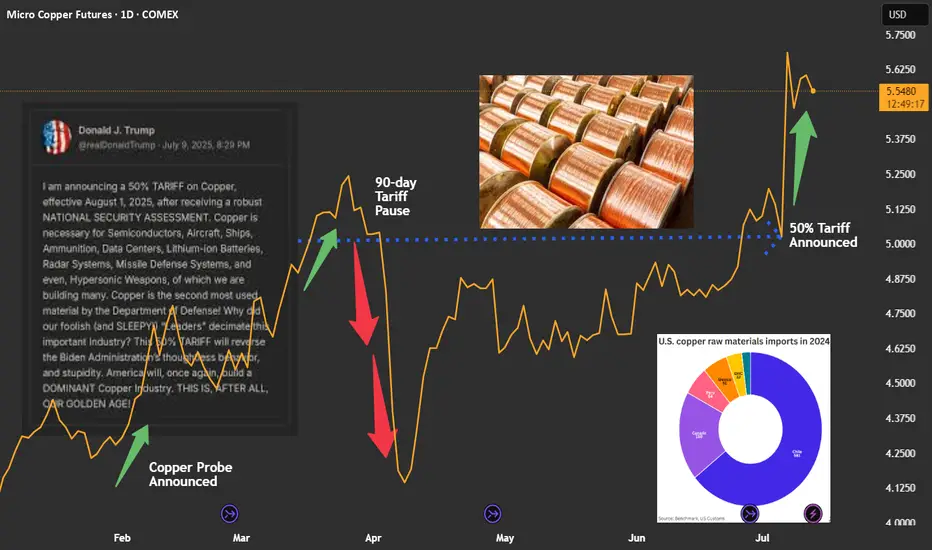
Copper: Event-driven Trade Idea on Recent TariffsCOMEX: Micro Copper Futures ( COMEX_MINI:MHG1! ), #microfutures
The Event
On July 9th, President Trump announced that he would impose a 50% tariff on imports of copper, effective August 1st.
The decision was based on national security assessment. Copper is the second most used material by the U.S. Department of Defense. The President intents to use tariffs to reduce reliance on imports and shore up support for domestic production.
Immediate Market Reaction
U.S. copper prices ended Tuesday’s session over 13% higher — the sharpest single-day gain since 1989. The September COMEX copper futures contract was settled at $5.584 a pound on Friday, up 35.7% year-to-date.
Due to tariffs, Copper in the U.S. is priced at a large premium over international markets.
• UK: LME copper contract was quoted at $9,660.5 per ton on Friday.
• China: SHFE coper futures was settled at RMB 78,420 per ton. It can be converted to $10,959.4 via the Dollar/RMB exchange rate of 7.1555.
• US: COMEX copper quote of $5.584 can be converted to $12,312.7 per ton.
• As of Friday, COMEX copper is priced at a 27.5% premium over LME copper, and a 12.3% premium over SHFE copper.
The U.S. Copper Market
The U.S. Geological Survey reports that the 2024 total refined copper consumption was 1.8 million metric tons. Of which, 850,000 tons were from mining, 150,000 tons were refined from scrap, and 810,000 tons from imports.
Chile is the biggest source of U.S. copper imports, accounting for 581,000 tons, or 71.7% of total imports. Canada is the second largest, for 169,000 tons, or 20.9%.
Copper is a widely used base metal, found in products ranging from machinery, electronics, household goods, housing, infrastructure projects, to aircraft and missiles.
Since President Trump announced a probe into copper in February, traders have been poised for a hike on copper duties, leading to major shifts in inventories away from Europe and Asia and into the U.S.
The Next Event: Will the Copper Tariffs get postponed or reduced?
The goal to increase domestic production of copper is very challenging. It will take years to ramp up and decades to fully meet demand — at a massive upfront investment cost.
Hiking the import duties would not help national security. It could not change the fact that the biggest copper mines are in Chile, Peru and Canada. A sharp increase in the cost of copper will quickly translate into wide-ranging inflation in the U.S.
In my opinion, once the Trump administration realizes the full impacts, we could possibly see a crawl-back from the intended copper tariffs. The effective date would be postponed, the tariff rate could be reduced, and many companies may get exemption/waiver. We have seen similar maneuvers happening multiple times in the past few months.
Overall, the actual impact of copper tariffs will be much smaller than the original announcement.
Shorting COMEX Copper Futures
Historically, the price difference between COMEX and LME coppers has been near-zero and was around the $150 level in 2024.
Since February, COMEX copper has been trading at $500-$1,500 premium over LME. As of Friday, COMEX copper futures have gone up 35% this year and are now priced at $2,652 per ton above LME copper.
In my opinion, these price differences reflect no economic fundamentals. It is purely due to the ever-changing global tariff conflict. If President Trump rescinds his tariff narratives, we could likely see a large drop in COMEX copper prices.
A trader sharing this view could explore shorting the COMEX Micro copper ( GETTEX:MHG ).
Last Friday, the September micro copper futures contract (MHGU5) was settled at 5.5910. Each contract has a notional value of 2,500 pounds of high-grade copper, or a market value of $13,977.5. To buy or sell 1 contract, a trader is required to post an initial margin of $1,100. The margining requirement reflects a built-in leverage of 12.7-to-1.
Let’s use a hypothetical trade to illustrate how to use a short futures position to take advantage a potential reduction on copper tariffs.
Hypothetical Trade:
• Short 1 MHGU5 contract at 5.5910, and set a stop loss at 6.00
• Trader pays $1,100 for initial margin
Scenario 1: Tariffs go into effect, copper rises to $6.57
• Futures reflect a 50% premium over current LME copper price, which is at $4.38 per pound
• Short order stop loss at 6.00, and the maximum loss is $1,022.5 (= (6-5.591) x 2500)
• The trader loses most of the margining fund, but owes no more
Scenario 2: Trump Rescinds Tariffs, Copper falls to $4.38
• COMEX copper will be priced at No premium over LME
• Short position gains: $3,027.5 (= (5.591-4.38) x 2500)
• The hypothetical return will be 275.2% (= 3027.5 / 1100)
The above scenarios show that
• When copper falls, short position will have higher returns due to its leverage nature.
• When copper rises, the stoploss will kick in to set maximum losses.
The above trade idea could be deployed using the standard-size Copper Futures contract. Its notional value is 25,000 tons, which is 10 times bigger than that of the micro contract. The initial margin is $11,000. The standard-size contract is more liquid. On Friday, it had a total volume of 60,313 contracts, and an open interest of 221,682.
Happy Trading.
Disclaimers
*Trade ideas cited above are for illustration only, as an integral part of a case study to demonstrate the fundamental concepts in risk management under the market scenarios being discussed. They shall not be construed as investment recommendations or advice. Nor are they used to promote any specific products, or services.
CME Real-time Market Data help identify trading set-ups and express my market views. If you have futures in your trading portfolio, you can check out on CME Group data plans available that suit your trading needs www.tradingview.com
Live Trump TradeHello friends
Based on the analysis and research we have concluded that it is possible to enter into a transaction with risk and capital management, given the entry of buyers and the price pullback.
*Trade safely with us*

The TACO Trade Is Back!🌮 AMEX:SPY
📊 The Setup:
The TACO trade ("Trump Always Chickens Out") continues to prove its resilience in the face of trade war headlines. The market dips sharply when tariffs are announced, and then surges back up as the news cycle turns, with Trump pausing or reversing his decisions.
We’ve seen multiple examples of this year-to-date on the AMEX:SPY chart:
🔹 Trump Pauses Tariffs for Canada & Mexico – market bounces.
🔹 Trump Pauses Most Liberation Day Tariffs – another bounce.
🔹 Trump Floats Lowering Tariffs on China – bounce continues.
🔹 Trump Pushes Back EU Tariffs to July – market rips higher.
It’s as if every tariff tantrum is followed by an inevitable rebound. Could this be the pattern to trade around for the next few months?
At this point, it almost feels like we’re watching a predictable movie. Every new threat to impose tariffs or spark a trade war is just a scene in the “TACO” storyline, and the markets are starting to get used to the plot twist.
Are we playing into an endless loop of fear and relief? Is this time different, or just the same old TACO? How much longer can we trust that the market will “chicken out” and bounce back every time tariffs are floated?

US Federal Court Rules Trump Tariffs UnconstitutionalUS Federal Court Rules Trump Tariffs Unconstitutional
According to media reports, the US Court of International Trade has:
- declared the tariffs imposed by President Donald Trump illegal;
- ruled that the President exceeded his authority;
- blocked the tariffs, emphasising that under the US Constitution, only Congress has the power to impose tariffs.
The decision was made unanimously by a panel of three judges. Financial markets reacted with:
- a rise in US stock indices;
- strengthening of the US dollar — most notably seen today on the USD/CHF chart, as demand for so-called safe-haven assets declined in light of the tariff reversal.
Technical Analysis of the USD/CHF Chart
The bullish momentum has broken upward through:
- a local downward trendline (shown in red);
- resistance at the 0.8300 level, near the May 22 high.
Additionally:
- the RSI indicator on the 4-hour chart has moved upwards to the overbought territory;
- the area highlighted with a purple rectangle resembles a bullish Fair Value Gap.
Could this upward momentum lead to a sustained uptrend? There is reason for doubt.
Consider the steep decline in USD/CHF in early April (driven mainly by the introduction of Trump's tariffs) and the relatively small size of today's bullish candle compared to that prior drop.
Price action seems to suggest that market participants are skeptical about any lasting change in the situation. The Trump administration has already filed an appeal, and it’s possible the White House could succeed in defending its position.
This article represents the opinion of the Companies operating under the FXOpen brand only. It is not to be construed as an offer, solicitation, or recommendation with respect to products and services provided by the Companies operating under the FXOpen brand, nor is it to be considered financial advice.

Trump Delays Tariffs, but Trade Tensions with EU Are Heating UpDonald Trump is back in headline mode — and this time, the EU is in his crosshairs.
After weeks of relative calm, the US President reignited global trade tensions by announcing a 50% tariff on all EU imports. But in a surprise twist — and in true reality-TV fashion — he’s now pushed the start date from June 1 to July 9.
So Europe gets a five-week stay of execution. Lucky? Or just stuck in limbo?
Let’s dive into what it means for markets, why traders aren’t exactly panicking yet, and whether this is just another Trump bluff — or a prelude to Trade Wars, Season 2.
🍝 All EU Imports — Yes, Even the Pasta
Trump’s post-holiday bombshell would slap a sweeping 50% tariff on everything from French wine and Italian olive oil to German sedans and Spanish ham.
His reason? Brussels is “dragging its feet,” and Trump, never one to shy away from drama, says enough is enough.
Cue the “America First” soundtrack.
But with the tariff now rescheduled for July 9, markets are interpreting this as more of a pressure tactic than an immediate economic hammer. A cooling-off period? Or the calm before the tariff storm?
👀 Markets Blink — But Just Barely
When the initial June 1 announcement hit Friday, Europe’s Stoxx 600 TVC:SXXP dropped about 1% — not exactly a meltdown, more like a “here we go again” shrug.
US stocks , which are closed for Memorial Day Monday, had already wrapped Friday in the red. Investors were digesting the potential for yet another trade war rerun — just when things were starting to feel a bit less chaotic.
The new July 9 date has offered some breathing room, but it hasn’t erased the risk. Instead, it’s created a countdown clock for volatility — one that traders can’t ignore.
⏳ Bluff or Battle Plan?
Trump’s tone this time is more poker table than podium.
“That’s the way it is,” he told reporters.
“Our discussions with them are going nowhere!” he posted on Truth Social.
“I’m not looking for a deal — we’ve set the deal: 50%.”
Still, the sudden five-week delay suggests there might be some wiggle room behind the scenes. Maybe it’s about giving Brussels time to blink. Or maybe it’s about giving voters time to rally.
🧐 Should Traders Be Freaking Out?
Short answer: No.
Slightly longer answer: Not yet.
While the tone feels sharper and the numbers bigger, traders have learned one thing about Trump: even the most dramatic threats often serve as negotiation leverage.
That said, this isn't 2018. The global economy is more fragile. Rates are higher. Consumer fatigue is real. And if this escalates into tit-for-tat tariffs, the recovery narrative could hit a speed bump — just in time for earnings season.
So traders should:
Keep an eye on EU-exposed sectors — autos, luxury goods, industrials
Monitor the FX space — especially EUR/USD volatility
Watch the earnings calendar for reports from multinationals with eurozone exposure
Stay alert for a potential 3 a.m. Trump pivot post
And maybe keep one tab open for the Brussels response
🌱 A New Deadline, Same Old Drama
So, is this real? Maybe. Is it priced in? Partially. Is it over? Definitely not.
The July 9 date might delay the fallout, but it also means the headlines — and market jitters — aren’t going anywhere. Investors now have five more weeks of speculation, positioning, and potential volatility as the transatlantic trade story unfolds.
And if you’re sitting on European exposure? Maybe don’t go full “buy-the-dip” mode just yet. More like a “watch the tape, prep your hedges, and don’t believe everything you read is final.”
Your turn: are you fading the noise or surfing the chaos? Let us know how you’re playing the next move in this global chess match.

US Technology Stock Sector. The Underpressured PathThe recent reduction of tariffs under former President Trump's administration, while intended to ease trade tensions, has had several negative impacts on the U.S. technology sector, particularly in 2025.
Increased Costs and Supply Chain Disruptions
Despite some tariff reductions, the overall tariff environment remains highly volatile and complex. Many tariffs on tech products, especially those involving China, remain elevated-up on Chinese-made smartphones and other electronics. This has significantly increased manufacturing costs for U.S. tech companies reliant on global supply chains, particularly those sourcing components or assembling products in China, Vietnam, and other Asian countries.
The tariffs have disrupted supply chains, forcing companies to reconsider production locations and logistics. Many firms are shifting production away from China to countries like India or Vietnam to mitigate tariff impacts, but this transition is costly and slow. Reshoring semiconductor manufacturing to the U.S. is challenging due to high labor costs and lack of skilled workforce, which means higher prices for end products like AI-enabled PCs and servers are expected.
Suppressed Consumer Demand and Market Uncertainty
Higher tariffs translate to increased retail prices for consumer electronics, reducing demand. For example, smartphone prices have risen, leading to weaker consumer sentiment and slower sales growth. This is particularly harmful in a sector where rapid innovation and high sales volume are critical for profitability and investment in new technologies.
The uncertainty caused by fluctuating tariff policies has also led to delayed purchasing decisions by enterprises and consumers. Companies are hesitant to invest in new hardware or AI infrastructure due to unclear future costs and potential further tariff changes. This delay threatens technology roadmaps and weakens the U.S. tech sector's competitiveness globally.
Impact on Innovation and Investment
Tariffs have broader implications beyond immediate cost increases. By fragmenting markets and increasing operational costs, they reduce incentives for innovation. Companies face pressure to duplicate investments or abandon certain markets, which slows technological progress and reduces the U.S.'s ability to maintain leadership in emerging fields like AI and advanced semiconductors.
The increased costs and uncertainty have also dampened investment in U.S. tech infrastructure. Although some companies like TSMC and Apple have announced U.S. manufacturing investments to offset tariff impacts, these efforts are insufficient to counterbalance the negative effects fully. The long lead times and capital intensity of building semiconductor fabs mean that reshoring will not provide a quick fix.
Economic and Strategic Risks
The tariffs contribute to broader economic risks, including potential recession, inflation, and job losses in the tech sector and related industries. CEOs across sectors have expressed concerns about the tariffs leading to economic downturns, higher prices, and layoffs. The tech sector, being highly globalized and interconnected, is particularly vulnerable to these macroeconomic shocks.
Moreover, the tariffs strain U.S.-China relations, a critical factor in global tech supply chains and innovation ecosystems. Retaliatory tariffs from China and other countries further complicate market access for U.S. tech firms, reducing their export opportunities and competitiveness.
Conclusion
In summary, the recent tariff reductions under Trump's policy have not fully alleviated the negative impacts on the U.S. technology sector. Elevated tariffs continue to raise manufacturing costs, disrupt supply chains, and suppress consumer demand. The resulting uncertainty delays investments and innovation, while economic risks and strained international relations further threaten the sector's growth and global standing. These factors collectively undermine the competitiveness and future prospects of the U.S. tech industry.
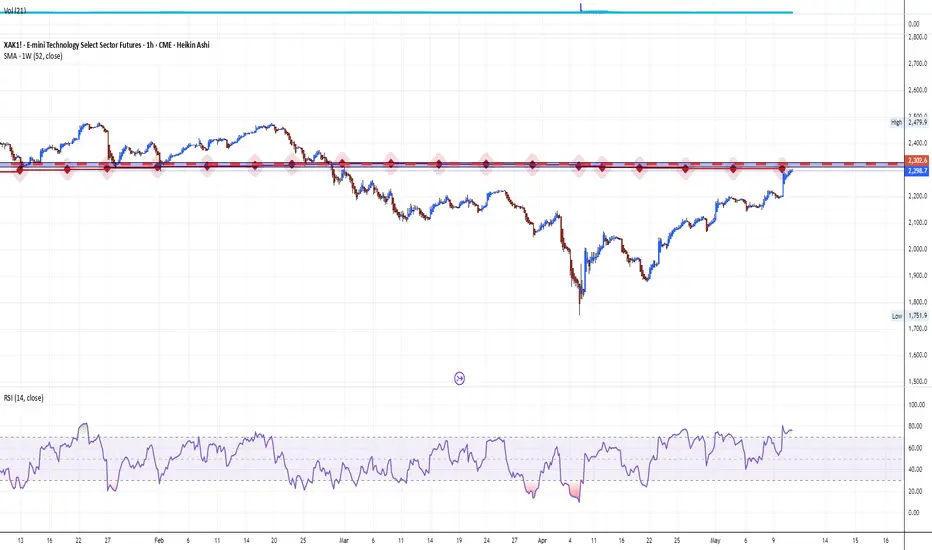
Technical challenge
The main technical graph for US Technology Sector Futures CME_MINI:XAK1! (cost-adjusted modification) still remains under key resistance of 52-week SMA, which indicates on further possible bearish pressure.
--
Best wishes
@PandorraResearch Team
NAS100 - Stock Market Expects a Devastating Week!The index is trading above the EMA200 and EMA50 on the 4-hour timeframe and is trading in its ascending channel. I expect corrective moves from the specified range, but if the index corrects towards the demand range, we can look for the next Nasdaq buy positions with a good risk-reward ratio.
U.S. stock futures responded positively to signals from both Chinese and American officials. Looking ahead to the coming week, investor focus is squarely on the Consumer Price Index (CPI) report from the United States—marking the first chance to assess the impact of the new tariffs implemented on April 9.
Meanwhile, ongoing trade negotiations between the U.S. and China remain a crucial factor, with significant implications for inflation, Federal Reserve policy, and overall market expectations. In addition to inflation data, retail sales figures and the preliminary results of the University of Michigan sentiment survey could influence market outlook regarding interest rates—especially since price stability and full employment remain core mandates of the Federal Reserve. At present, Fed officials are working to maintain a cautious stance in order to anchor inflation expectations. However, if clear signs of economic weakness emerge, that stance could shift rapidly—something that several Fed officials have already openly acknowledged.
Retail sales, in particular, could provide a different narrative about the health of the economy. After a notable 1.5% jump in March, estimates suggest that growth in April slowed to just 0.1%. This deceleration may reflect consumer reluctance to spend, stemming either from inflationary pressures or broader economic uncertainty.
Thursday’s data release will include the Producer Price Index (PPI), industrial production, and the Philadelphia Fed manufacturing index—offering a clearer picture of supply-side dynamics and the performance of the industrial sector.
On Friday, attention will turn to a fresh batch of economic indicators: building permits, housing starts, the New York (Empire State) manufacturing index, and especially the University of Michigan’s preliminary consumer sentiment survey. This survey has gained importance in recent months due to notable increases in both one-year and five-year inflation expectations. As recent charts indicate, while consumer confidence has plummeted to multi-year lows, inflation expectations have trended upward—a worrisome combination that could limit the Fed’s ability to ease monetary policy.
Although concerns about a U.S. recession persist, recent data suggest more of a “gradual slowdown” rather than signs of an imminent crisis. In March, both the CPI and PCE indices declined, indicating a temporary easing of inflationary pressures. However, this trend may reverse in April, as the broad implementation of reciprocal tariffs likely raised import costs—particularly for Chinese goods, which now face duties as high as 145%.
New estimates indicate that these tariffs could add 2.25% to core inflation over the next year, effectively reversing the progress made in 2024 on taming price pressures.Prior to the Trump administration’s tariff announcements, economists had differing views on inflation, with some expecting it to approach the Fed’s 2% annual target by year-end. Contrary to trade experts, Trump claimed that sellers would not pass these price increases on to consumers.
Goldman Sachs’ analysis this week suggests that Trump’s tariffs could push inflation to levels not seen since the post-pandemic price surge. The broad import taxes announced between February and April may have a substantial impact on the economy, and consumers are likely to feel the effects first at the checkout counter. Goldman economists estimate that the tariffs could drive annual inflation—as measured by core Personal Consumption Expenditures (PCE)—to 3.8% by December, marking the highest rate since 2023. The Fed’s preferred inflation gauge rose 2.6% last year.
This metric remains above the Fed’s 2% target and has shown limited progress toward that goal since 2023. The last time inflation was below this benchmark was in January 2021.
A renewed wave of price increases could severely strain American household budgets—particularly if the labor market also weakens, as many economists anticipate. This would also represent a significant setback for the Federal Reserve, which has kept interest rates elevated since 2022 in an effort to combat post-pandemic inflation.
While inflation hovered around 3% at the beginning of 2024 with little change, it saw a notable drop in March. Many analysts forecast that inflation will continue to decline and approach the 2% target by the end of 2025.
Walker and Peng’s analysis factored in both the direct effects of tariffs—most of which will likely be passed on to consumers—and several indirect consequences. The trade war has unexpectedly weakened the U.S. dollar, reducing Americans’ purchasing power.
Moreover, some manufacturers may shift production away from China, where tariffs are particularly severe, to locations with higher production costs. As a result, American consumers may end up paying significantly more for imported goods, especially in categories like consumer electronics and apparel.

DXY Analysis: Rising Dollar and Market ImplicationsAnalyzing the recent DXY chart, we observe a significant upward movement following a demand build-up. This article explores the implications of a rising U.S. Dollar Index (DXY) on currency pairs and major indices like the SP 500 and NASDAQ, aligning with current market dynamics.
DXY Chart Breakdown:
The chart highlights a strong weekly/daily demand level at 98,500, with an internal structural shift marking a pivot point. A demand build-up preceded a sharp rise, tapping the extreme level
of the last point of supply at 100.385, suggesting bullish momentum. The DXY currently
stands at 99.915, with potential to test previous supply levels around 101.850.
Impact on Currency Pairs:
A rising DXY typically strengthens the USD, influencing forex markets:
• XXXUSD Pairs (e.g., EURUSD, GBPUSD): These pairs are likely to decline
as fewer dollars are needed to purchase foreign currencies, reflecting the USD’s
increased value.
• USDXXX Pairs (e.g., USDJPY, USDCAD): These pairs are expected to
climb, as a stronger USD buys more of the counterpart currency.
Exceptions may arise due to region-specific economic data or central bank policies.
Effects on Major Indices:
The strengthening dollar has broader market implications:
• SP 500: Multinational companies may face pressure from reduced overseas earnings, while higher interest rates (often linked to a rising DXY) could lower valuations, potentially leading to declines.
• NASDAQ: Tech-heavy and growth-oriented, the NASDAQ may underperform due
to its sensitivity to a stronger USD and rising borrowing costs, especially for firms
with global revenue.
However, a risk-off sentiment or strong U.S. economic data could counter these effects,
supporting both indices.
Conclusion:
The DXY’s upward trajectory signals a robust USD, likely pressuring XXXUSD pairs
downward and lifting USDXXX pairs. For indices, the SP 500 and NASDAQ may face
headwinds, though context like economic releases or global sentiment will play a key role.
Traders should monitor these levels closely for strategic entries and exits.
Trump’s speech today may create short-term volatility for the DXY. A focus on tariffs could push it toward 101.850.

$SPX / $SP500 – China Deal or Global Meltdown? The Risk/Reward 📉 The S&P 500 ( SP:SPX / VANTAGE:SP500 / $ES_F) is at a geopolitical crossroads.
After the Global Pause, the index rebounded, but only to retest resistance near the 200-day EMA. Now it faces a binary outcome:
Scenario A: ✅ Deal with China
Estimated probability: 20%
Potential upside: +10%
Expected value: +2%
Scenario B: ❌ No Deal with China
Estimated probability: 80%
Potential downside: -50%
Expected value: -40%
📉 Expected move: -38% net Markets are not priced for this. Volatility ( TVC:VIX ) is quietly coiling under the surface (chart 2), ready to explode if the no-deal scenario materializes.

XAUUSD - Gold Trend Before FOMC!Gold is trading above its EMA200 and EMA50 on the 4-hour timeframe and is trading on its uptrend line. A continued upward move in gold will put it in the supply zone, where it is possible to look for short positions. A downward correction in gold will also open up long positions.
Gold traders endured another turbulent week, marked by the second consecutive decline in prices—once again underscoring the market’s acute sensitivity to economic news and developments.
Adrian Day, CEO of Adrian Day Asset Management, offered a cautiously humorous take on the situation by likening it to the Peggy Lee song that asks, “Is that all there is?” He pointed out that gold has pulled back by over 7% from its recent high in less than two weeks.Although this correction is notable, it hasn’t been deep enough to flush out all short-term traders or weak-handed investors from the market.
Day added that rising fears of a U.S. recession—which typically exert early downward pressure on gold—alongside the possibility of easing U.S.-China trade tensions, may limit investment demand for gold in the short term. Concluding his comments, he maintained a cautious stance, saying that further downside remains likely and that his outlook for the coming week is bearish.
Meanwhile, U.S. President Donald Trump, in a new interview with NBC, addressed several key economic and political issues. He stated that if necessary, the deadline for selling TikTok would be extended, and some tariffs on Chinese goods might become permanent. Nevertheless, he indicated that he is also considering reducing certain tariffs in the future.
Trump emphasized that small businesses do not require additional assistance and that the Federal Reserve should cut interest rates. He confirmed that Jerome Powell will remain Fed Chair through the end of his term in 2026. He also mentioned potential successors for his own position, naming Vance and Rubio as possibilities.
After a week dominated by employment data, the upcoming week will be entirely focused on monetary policy. The centerpiece will be the May FOMC meeting, the Fed’s rate decision, and Jerome Powell’s press conference on Wednesday. While markets broadly expect the Fed to hold rates steady, Powell’s official remarks and answers to press questions—especially following his sharp tone earlier in April—will be under close scrutiny.
It is widely expected that the Federal Reserve will leave its key interest rate unchanged on Wednesday, as policymakers assess how President Trump’s tariffs gradually impact various sectors of the economy. Markets are currently pricing in a potential rate cut starting in July. The Fed’s dual mandate is to maintain low inflation and high employment, and it may face a dilemma if tariffs negatively affect both indicators, as many economists now warn.
Immediately following the Fed meeting, senior policymakers including Barr, Kugler, Waller, and Cook will travel to Iceland to attend the Reykjavik Economic Conference. On Friday, they will participate in panels discussing artificial intelligence, labor market trends, and monetary research—topics that could offer insights into the Fed’s long-term policy direction.
Simultaneously, traders are also awaiting two key reports: the ISM Services Index for May, due today, and weekly jobless claims figures set for release on Thursday. Together, these reports will help complete the picture of the U.S. economy as critical monetary policy decisions approach.
